| Param | Original file | Final file |
|---|---|---|
| Filename | modeM0/AS1C09_011T07_9000006470_52095cztM0_level2.fits | modeM0/AS1C09_011T07_9000006470_52095cztM0_level2_quad_clean.evt |
| Size (bytes) | 1,109,430,720 | 89,951,040 |
| Size | 1.0 GB | 85.8 MB |
| Events in quadrant A | 6,537,282 | 727,521 |
| Events in quadrant B | 6,937,821 | 783,933 |
| Events in quadrant C | 11,775,041 | 611,629 |
| Events in quadrant D | 15,197,988 | 39,365 |
| Mode SS | |||
|---|---|---|---|
| Quadrant | BADHDUFLAG | Total packets | Discarded packets |
| A | 0 | 160 | 0 |
| B | 0 | 160 | 0 |
| C | 0 | 160 | 0 |
| D | 0 | 160 | 0 |
| Mode M0 | |||
|---|---|---|---|
| Quadrant | BADHDUFLAG | Total packets | Discarded packets |
| A | 0 | 24846 | 0 |
| B | 0 | 26220 | 0 |
| C | 0 | 40559 | 0 |
| D | 0 | 50794 | 0 |
| Quadrant | Total seconds | Saturated seconds | Saturation percentage |
|---|---|---|---|
| A | 7990 | 419 | 5.244055% |
| B | 7991 | 481 | 6.019272% |
| C | 7991 | 2725 | 34.100863% |
| D | 7990 | 7990 | 100.000000% |
Noise dominated data is calculated using 1-second bins in cleaned event files. If a bin has >2000 counts, and if more than 50% of those come from <1% of pixels, then it is considered to be noise-dominated and hence unusable.
| Quadrant | # 1 sec bins | Bins with >0 counts | Bins with >2000 counts | High rate bins dominated by noise | Noise dominated (total time) | Noise dominated (detector-on time) | Marked lightcurve |
|---|---|---|---|---|---|---|---|
| A | 7990 | 7990 | 521 | 521 | 6.52% | 6.52% | 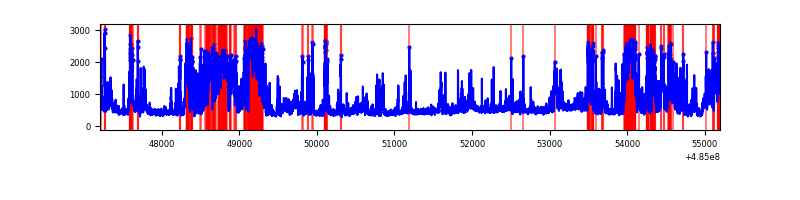 |
| B | 7991 | 7991 | 348 | 348 | 4.35% | 4.35% | 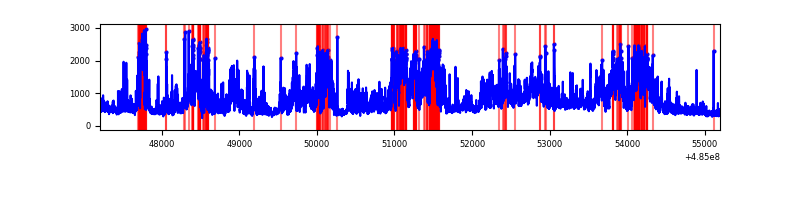 |
| C | 7991 | 7991 | 2410 | 2410 | 30.16% | 30.16% | 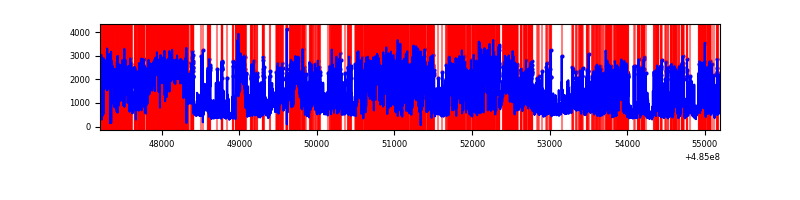 |
| D | 7990 | 7990 | 3594 | 3594 | 44.98% | 44.98% | 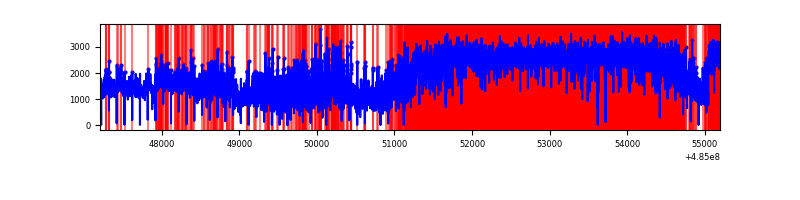 |
Top three noisy pixels from each quadrant. If the there are fewer than three noisy pixels in the level2.evt file, extra rows are filled as -1
| Pixel properties | Quadrant properties | ||||||
|---|---|---|---|---|---|---|---|
| Quadrant | DetID | PixID | Counts | Sigma | Mean | Median | Sigma |
| A | 12 | 3 | 1387807 | 6855.09 | 811 | 789 | 202.3 |
| A | 8 | 43 | 932370 | 4604.17 | 811 | 789 | 202.3 |
| A | 3 | 231 | 220489 | 1085.83 | 811 | 789 | 202.3 |
| B | 10 | 254 | 2123509 | 12380.68 | 812 | 782 | 171.5 |
| B | 5 | 172 | 252648 | 1468.99 | 812 | 782 | 171.5 |
| B | 8 | 3 | 211362 | 1228.2 | 812 | 782 | 171.5 |
| C | 15 | 224 | 5591569 | 29003.9 | 690 | 683 | 192.8 |
| C | 5 | 80 | 2102628 | 10904.28 | 690 | 683 | 192.8 |
| C | 15 | 248 | 394185 | 2041.37 | 690 | 683 | 192.8 |
| D | 15 | 94 | 8290667 | 410547.2 | 64 | 61 | 20.2 |
| D | 12 | 17 | 5225921 | 258782.31 | 64 | 61 | 20.2 |
| D | 6 | 42 | 1117729 | 55346.43 | 64 | 61 | 20.2 |
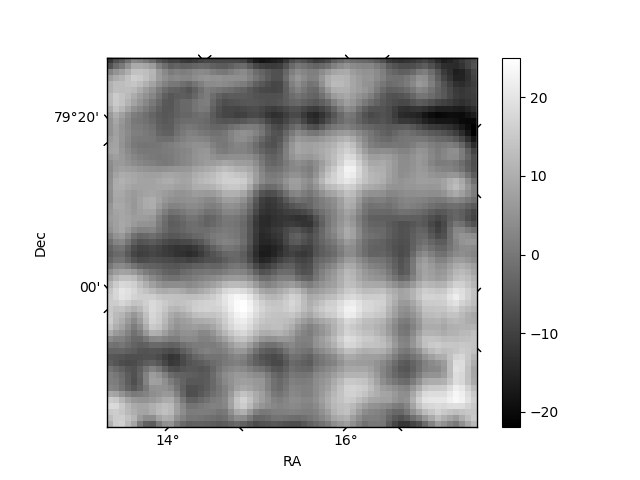
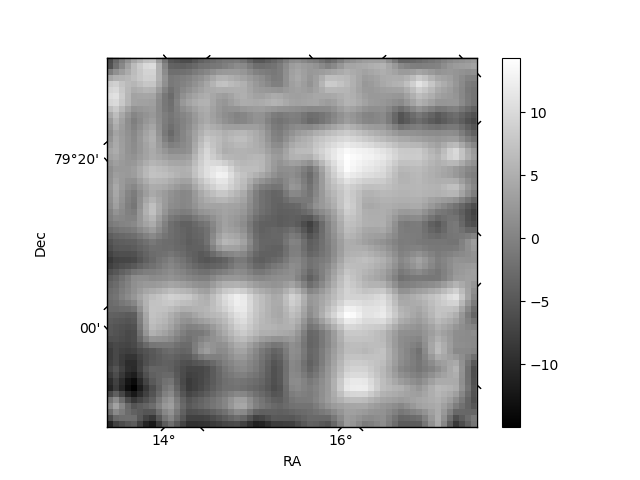
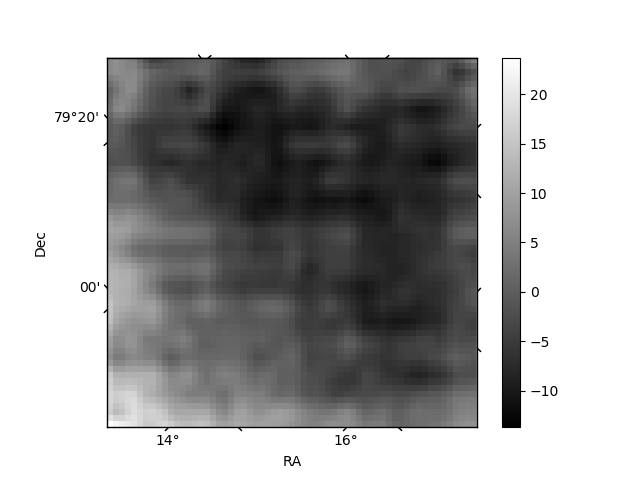
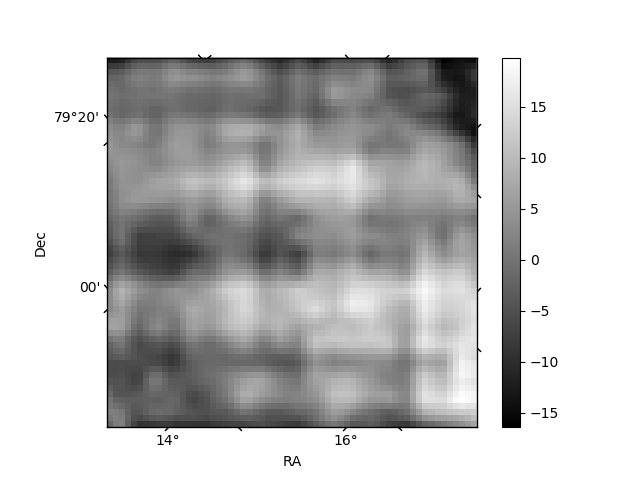
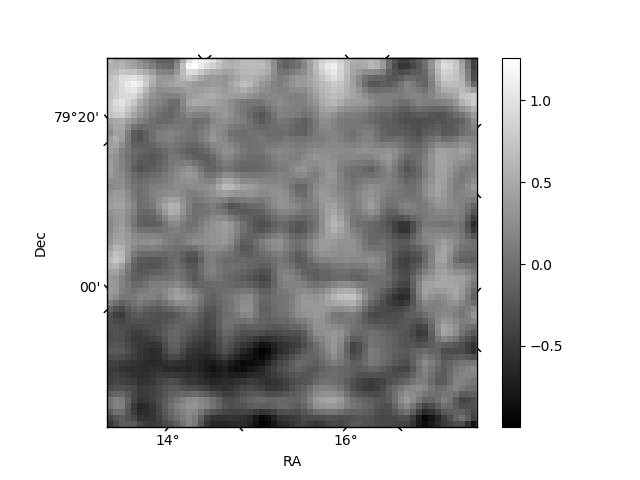
Histogram calculated using DETX and DETY for each event in the final _common_clean file
| Quadrant A | 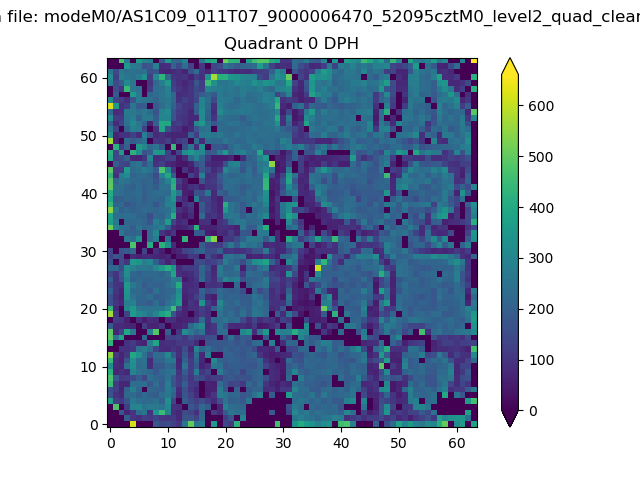 |
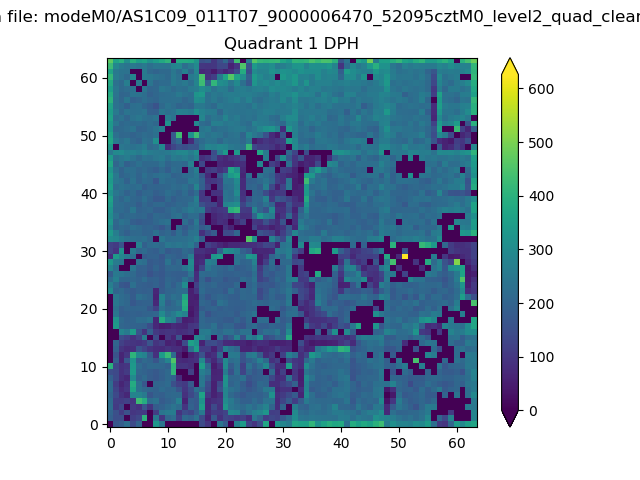 |
Quadrant B |
|---|---|---|---|
| Quadrant D | 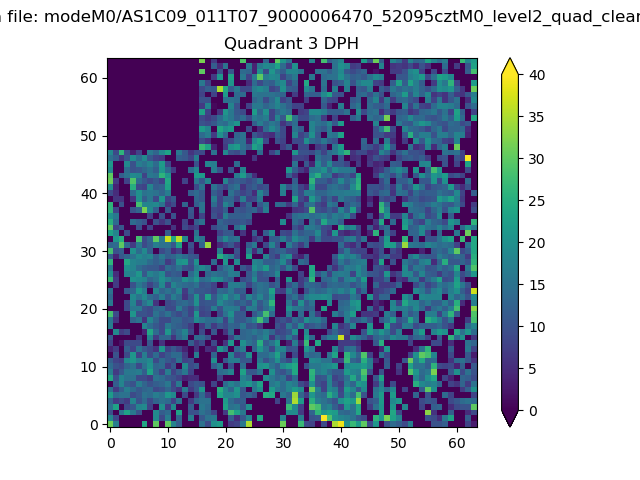 |
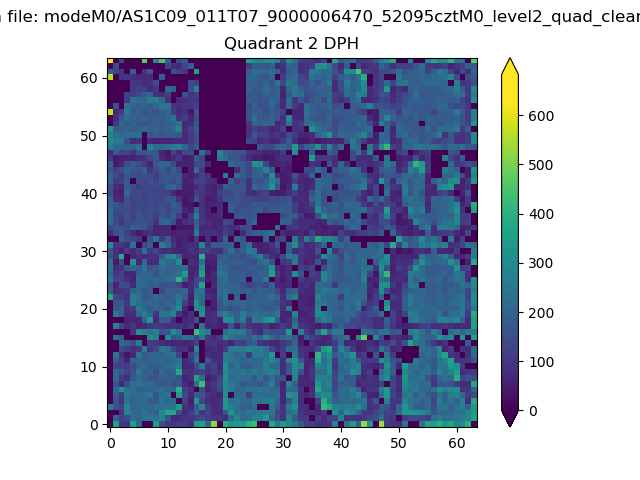 |
Quadrant C |
| Plot type | Count rate plots | Images |
|---|---|---|
| Comparison with Poisson distribution Blue bars denote a histogram of data divided into 1 sec bins. Red curve is a Poisson curve with rate = median count rate of data. |
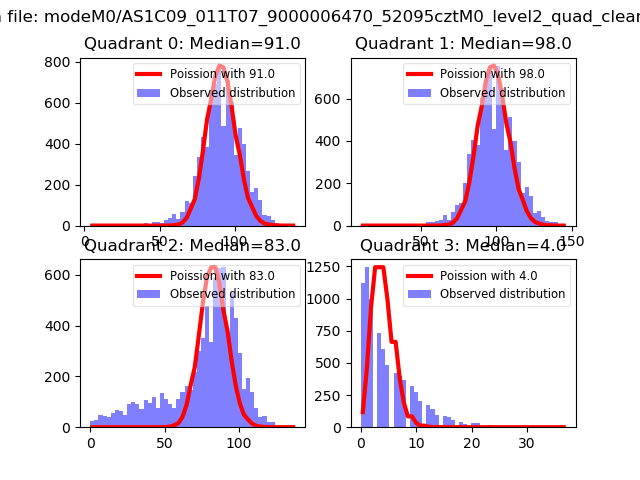 |
 |
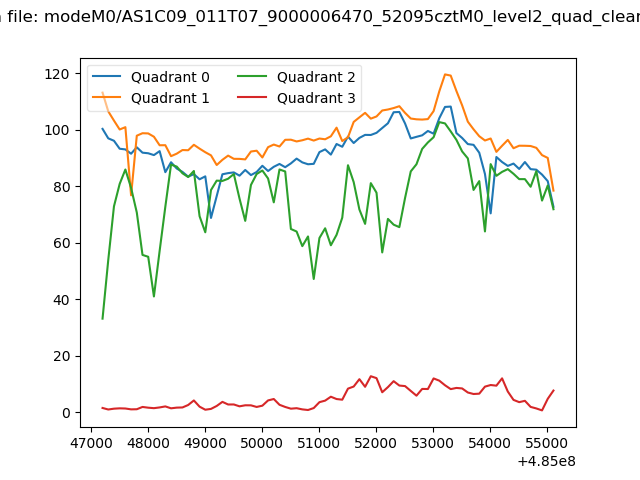
| Quadrant-wise count rates Data is divided into 100 sec bins |
 |
|
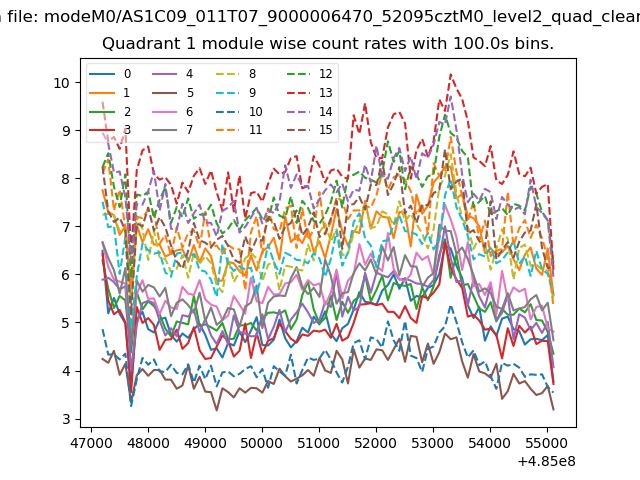
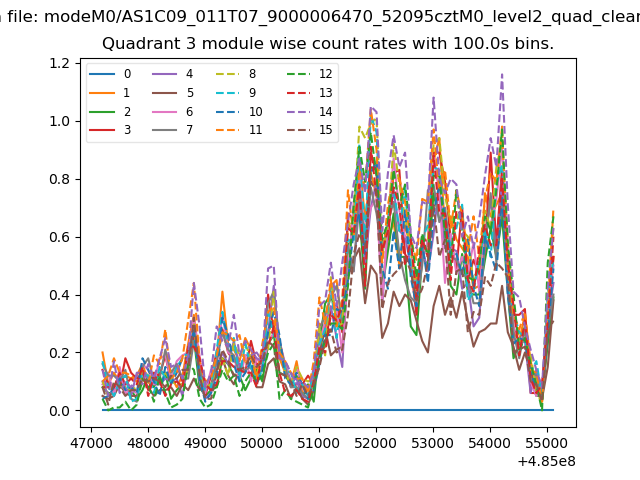
| Module-wise count rates for Quadrant A Data is divided into 100 sec bins |
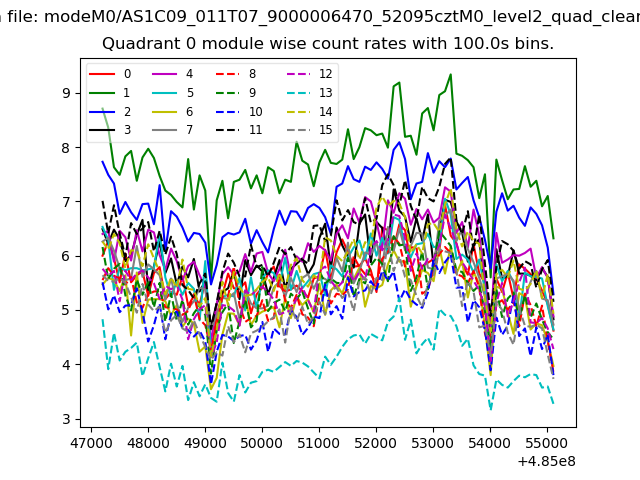 |
 |
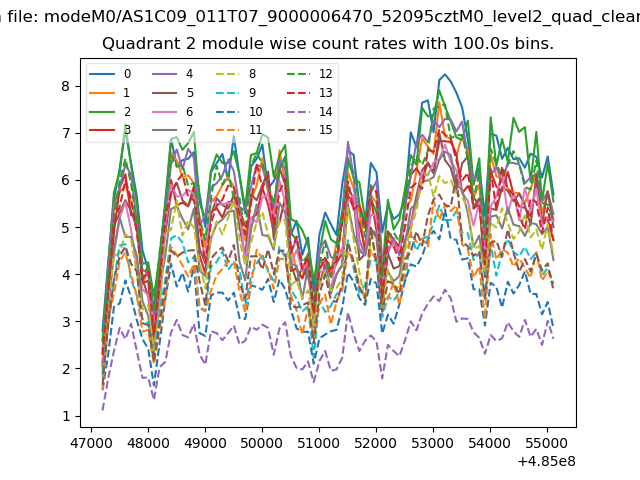
| Module-wise count rates for Quadrant B Data is divided into 100 sec bins |
 |
 |
| Module-wise count rates for Quadrant C Data is divided into 100 sec bins |
 |
 |
| Module-wise count rates for Quadrant D Data is divided into 100 sec bins |
 |
 |
| Parameter | Plot |
|---|---|
| CZT HV Monitor | 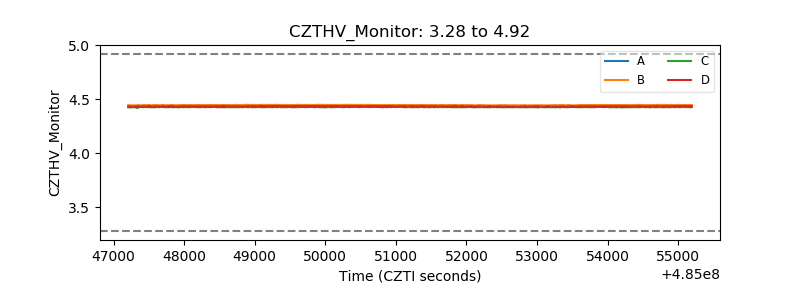 |
| D_VDD | 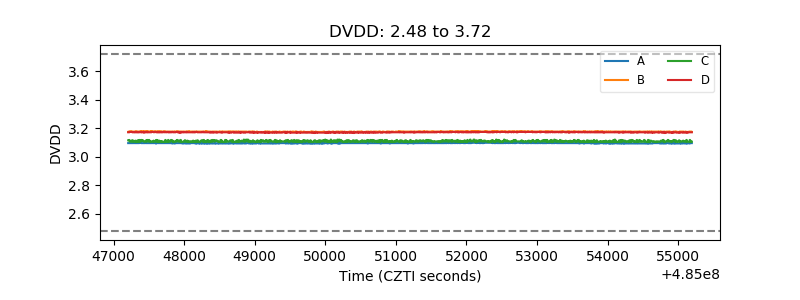 |
| Temperature 1 | 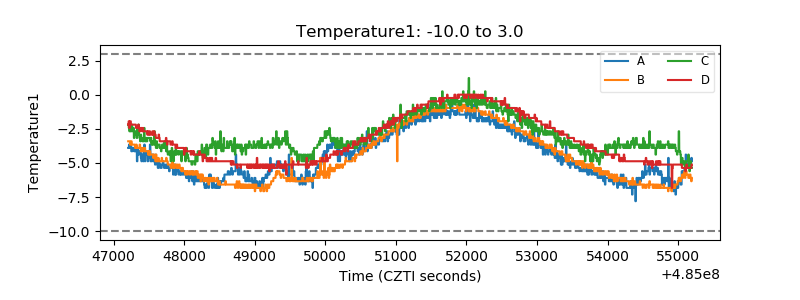 |
| Veto HV Monitor | 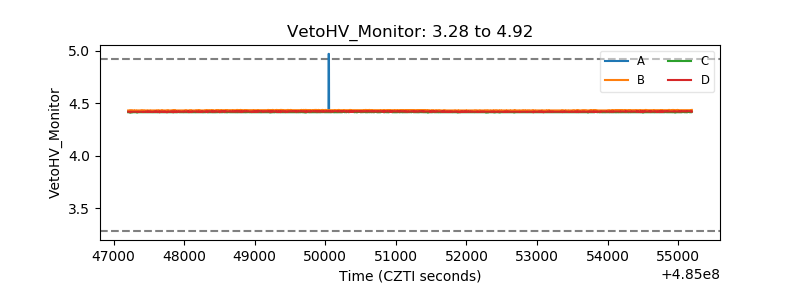 |
| Veto LLD | 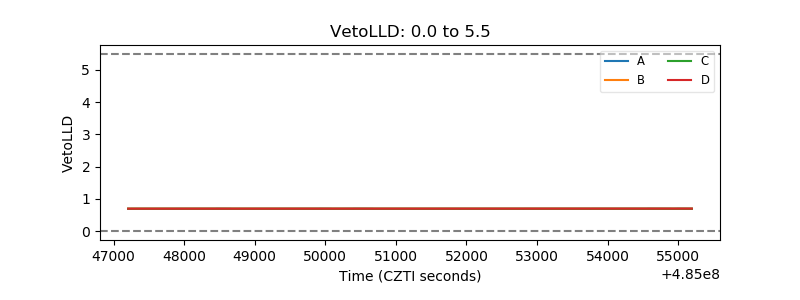 |
| Alpha Counter | 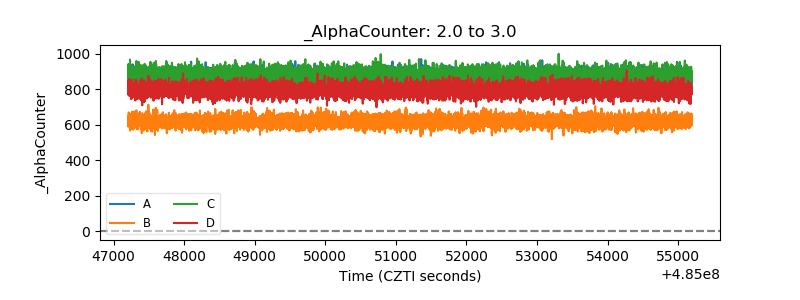 |
| _CPM_Rate | 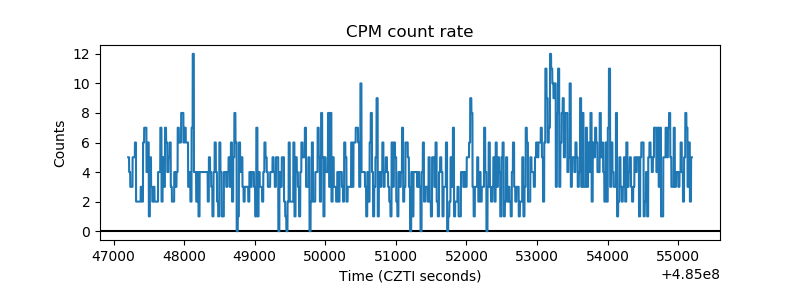 |
| CZT Counter | 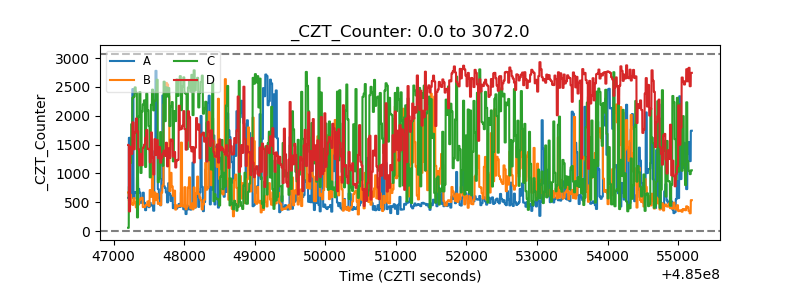 |
| +2.5 Volts monitor | 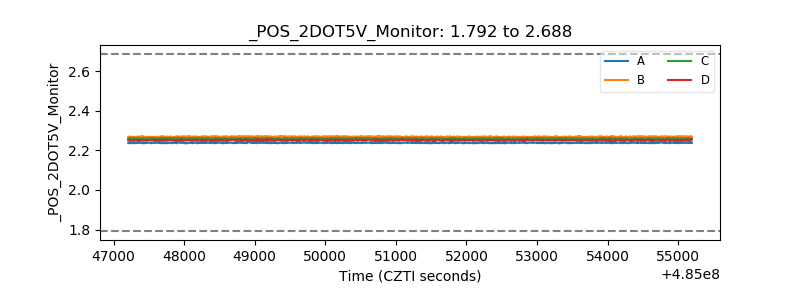 |
| +5 Volts monitor | 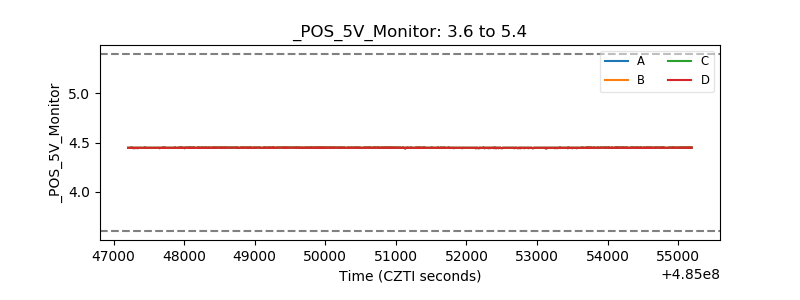 |
| _ROLL_ROT | 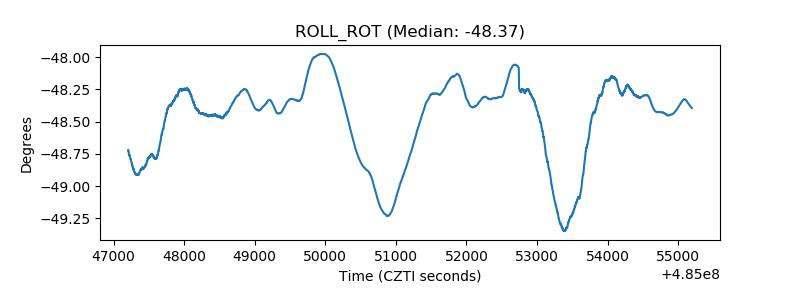 |
| _Roll_DEC | 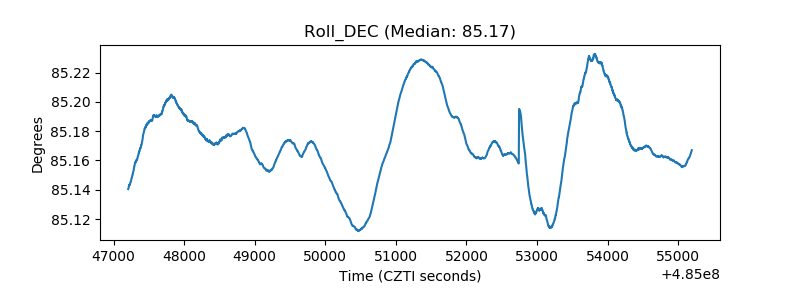 |
| _Roll_RA | 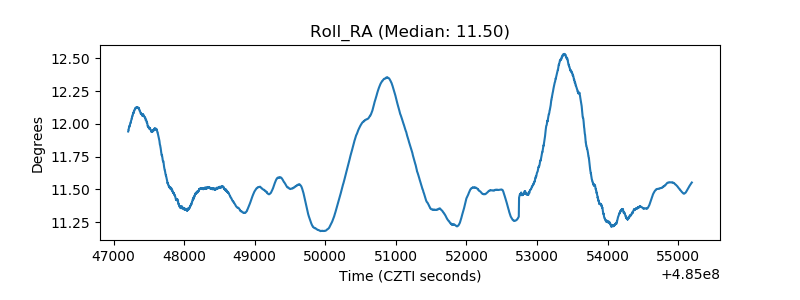 |
| Veto Counter | 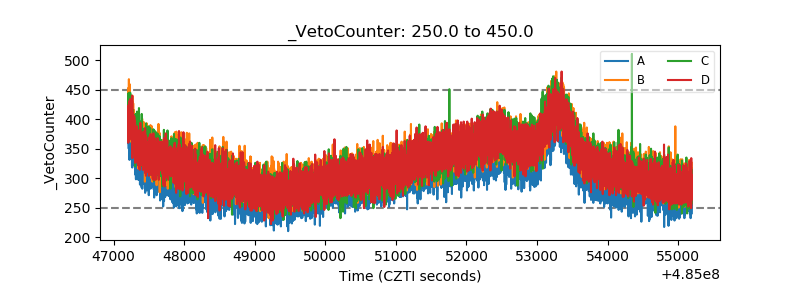 |