| Param | Original file | Final file |
|---|---|---|
| Filename | modeM0/AS1C09_011T07_9000006470_52096cztM0_level2.fits | modeM0/AS1C09_011T07_9000006470_52096cztM0_level2_quad_clean.evt |
| Size (bytes) | 1,098,898,560 | 82,238,400 |
| Size | 1.0 GB | 78.4 MB |
| Events in quadrant A | 5,985,100 | 673,454 |
| Events in quadrant B | 4,386,631 | 738,272 |
| Events in quadrant C | 12,062,058 | 477,177 |
| Events in quadrant D | 17,664,369 | 75,034 |
| Mode SS | |||
|---|---|---|---|
| Quadrant | BADHDUFLAG | Total packets | Discarded packets |
| A | 0 | 148 | 0 |
| B | 0 | 148 | 0 |
| C | 0 | 148 | 0 |
| D | 0 | 148 | 0 |
| Mode M9 | |||
|---|---|---|---|
| Quadrant | BADHDUFLAG | Total packets | Discarded packets |
| A | 1 | 140223219832872 | 140222092279854 |
| B | 1 | -1 | -1 |
| C | 1 | -1 | -1 |
| D | 1 | -1 | -1 |
| Mode M0 | |||
|---|---|---|---|
| Quadrant | BADHDUFLAG | Total packets | Discarded packets |
| A | 0 | 22988 | 0 |
| B | 0 | 18386 | 0 |
| C | 0 | 41090 | 0 |
| D | 0 | 57547 | 0 |
| Quadrant | Total seconds | Saturated seconds | Saturation percentage |
|---|---|---|---|
| A | 7483 | 400 | 5.345450% |
| B | 7498 | 156 | 2.080555% |
| C | 7492 | 3316 | 44.260545% |
| D | 7480 | 7480 | 100.000000% |
Noise dominated data is calculated using 1-second bins in cleaned event files. If a bin has >2000 counts, and if more than 50% of those come from <1% of pixels, then it is considered to be noise-dominated and hence unusable.
| Quadrant | # 1 sec bins | Bins with >0 counts | Bins with >2000 counts | High rate bins dominated by noise | Noise dominated (total time) | Noise dominated (detector-on time) | Marked lightcurve |
|---|---|---|---|---|---|---|---|
| A | 7618 | 7497 | 453 | 453 | 5.95% | 6.04% | 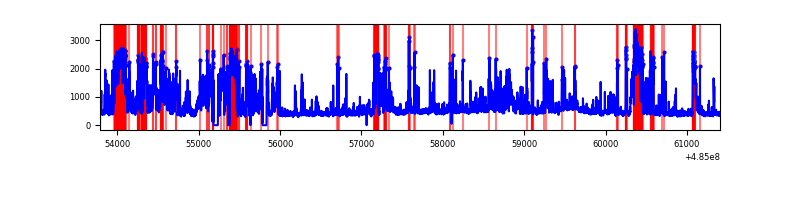 |
| B | 7619 | 7510 | 113 | 113 | 1.48% | 1.50% | 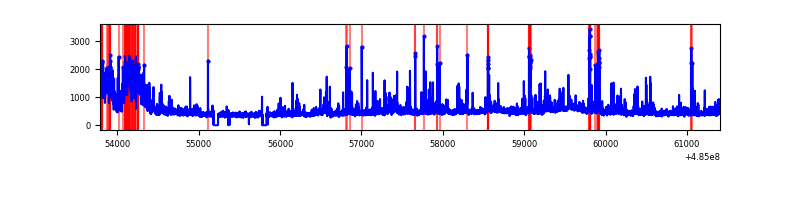 |
| C | 7619 | 7502 | 3134 | 3134 | 41.13% | 41.78% | 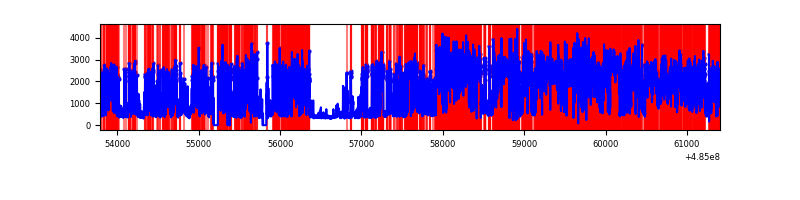 |
| D | 7619 | 7495 | 5636 | 5636 | 73.97% | 75.20% | 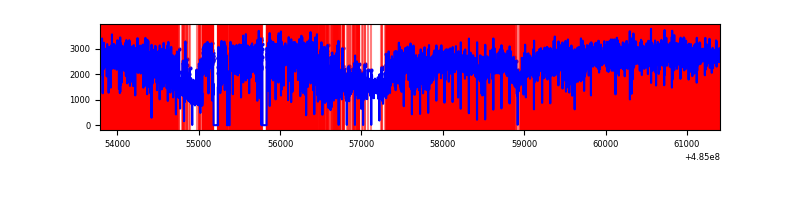 |
Top three noisy pixels from each quadrant. If the there are fewer than three noisy pixels in the level2.evt file, extra rows are filled as -1
| Pixel properties | Quadrant properties | ||||||
|---|---|---|---|---|---|---|---|
| Quadrant | DetID | PixID | Counts | Sigma | Mean | Median | Sigma |
| A | 12 | 3 | 1242046 | 6619.65 | 755 | 736 | 187.5 |
| A | 8 | 43 | 889435 | 4739.25 | 755 | 736 | 187.5 |
| A | 12 | 194 | 157329 | 835.08 | 755 | 736 | 187.5 |
| B | 10 | 254 | 521000 | 3166.4 | 766 | 739 | 164.3 |
| B | 5 | 172 | 121486 | 734.89 | 766 | 739 | 164.3 |
| B | 8 | 128 | 104390 | 630.84 | 766 | 739 | 164.3 |
| C | 5 | 80 | 5507512 | 36440.39 | 539 | 534 | 151.1 |
| C | 15 | 224 | 3823361 | 25296.14 | 539 | 534 | 151.1 |
| C | 13 | 3 | 146798 | 967.85 | 539 | 534 | 151.1 |
| D | 15 | 94 | 9447240 | 314824.81 | 99 | 94 | 30.0 |
| D | 6 | 42 | 3040430 | 101318.77 | 99 | 94 | 30.0 |
| D | 12 | 17 | 2659767 | 88633.23 | 99 | 94 | 30.0 |
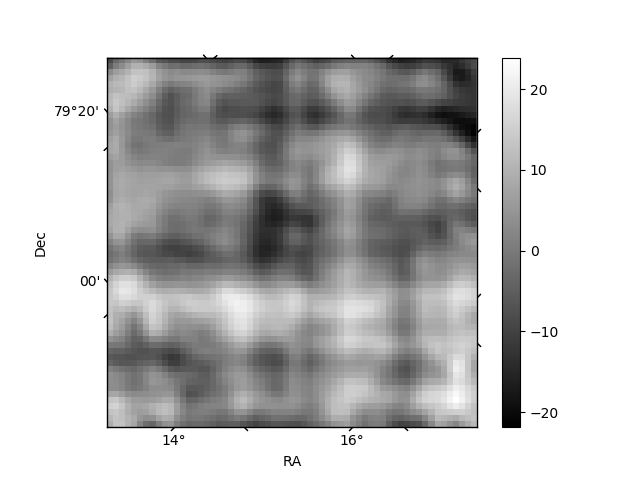
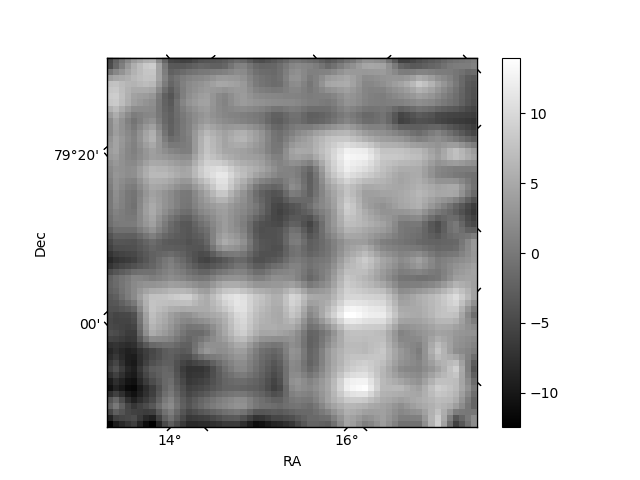
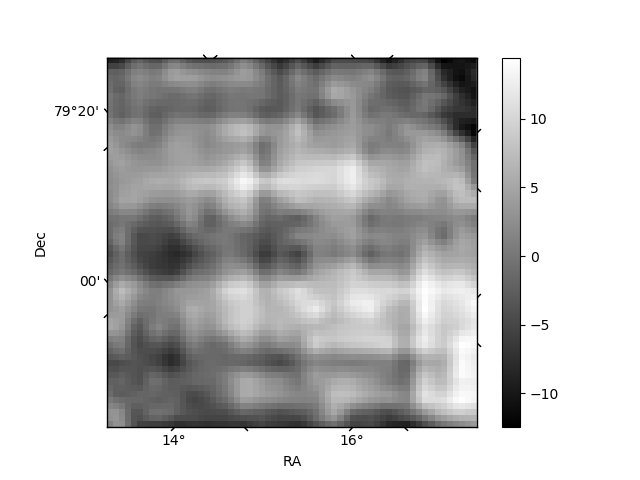
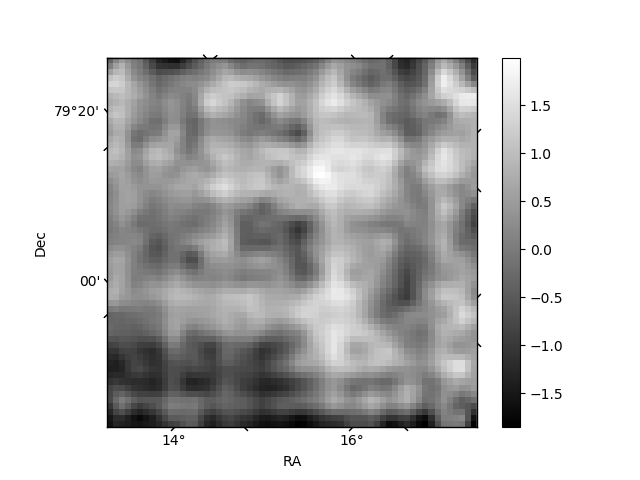
Histogram calculated using DETX and DETY for each event in the final _common_clean file
| Quadrant A | 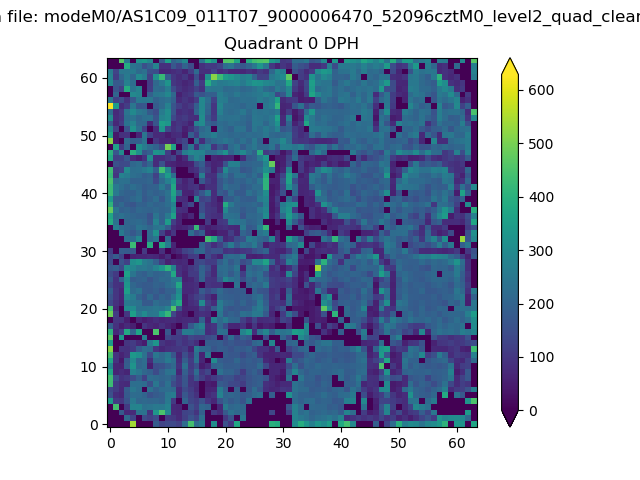 |
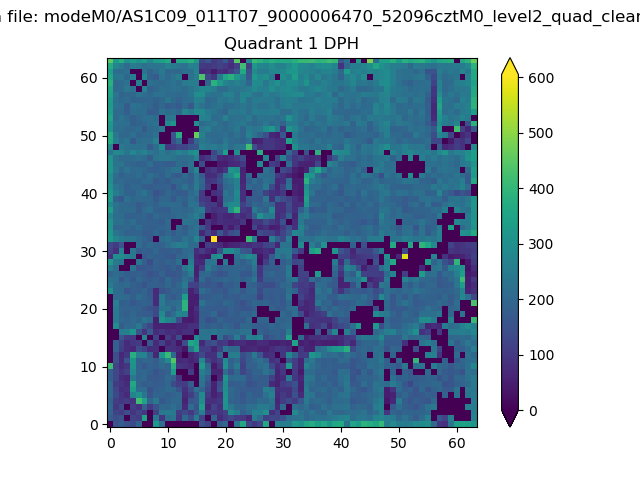 |
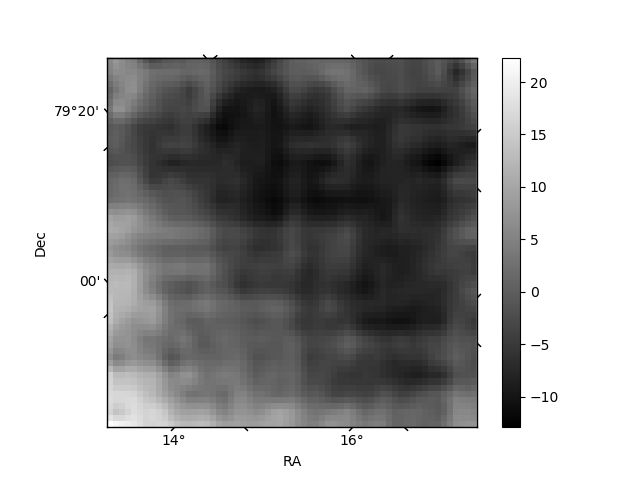
Quadrant B |
|---|---|---|---|
| Quadrant D | 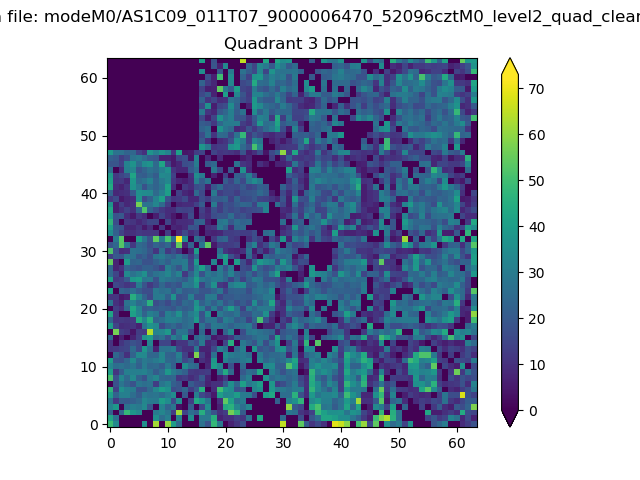 |
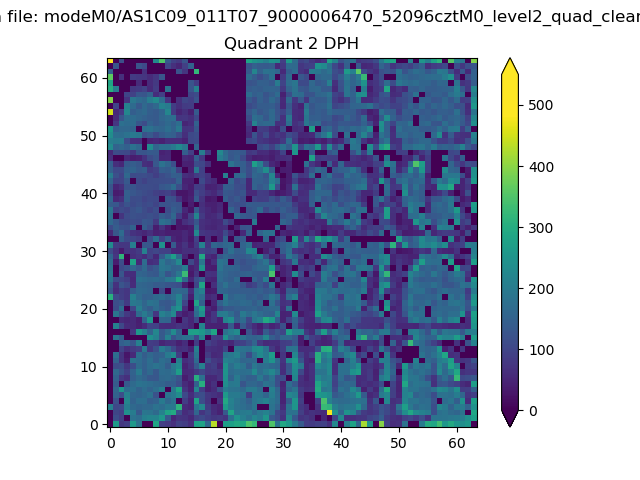 |
Quadrant C |
| Plot type | Count rate plots | Images |
|---|---|---|
| Comparison with Poisson distribution Blue bars denote a histogram of data divided into 1 sec bins. Red curve is a Poisson curve with rate = median count rate of data. |
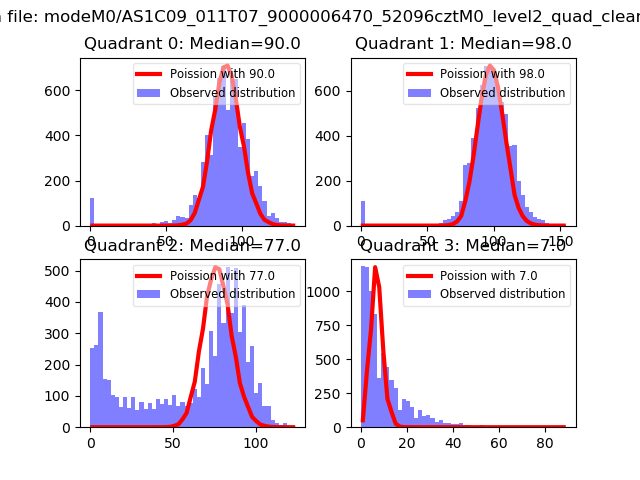 |
 |
| Quadrant-wise count rates Data is divided into 100 sec bins |
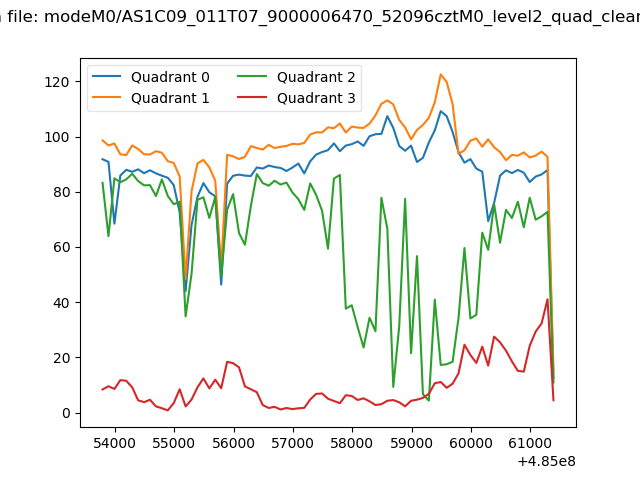 |
|
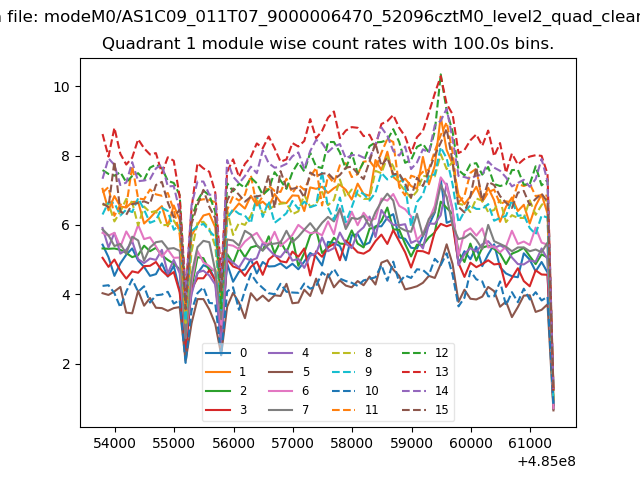
| Module-wise count rates for Quadrant A Data is divided into 100 sec bins |
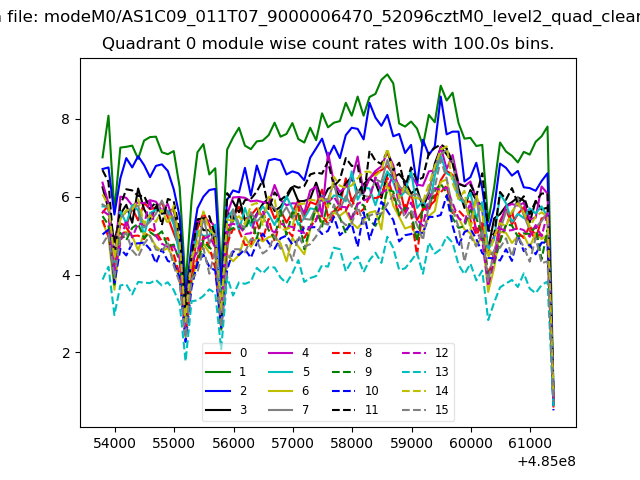 |
 |
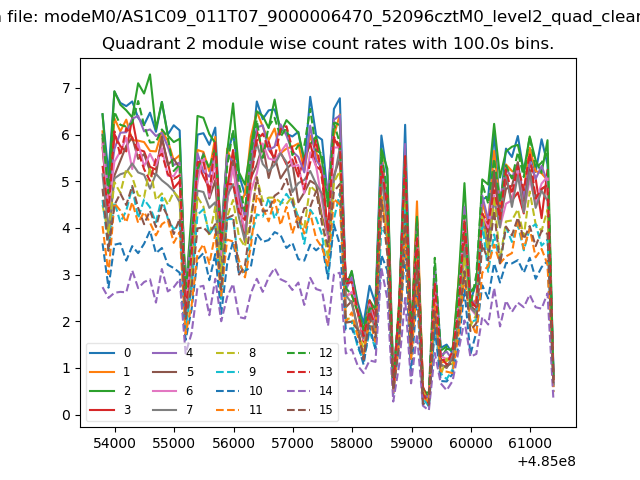
| Module-wise count rates for Quadrant B Data is divided into 100 sec bins |
 |
 |
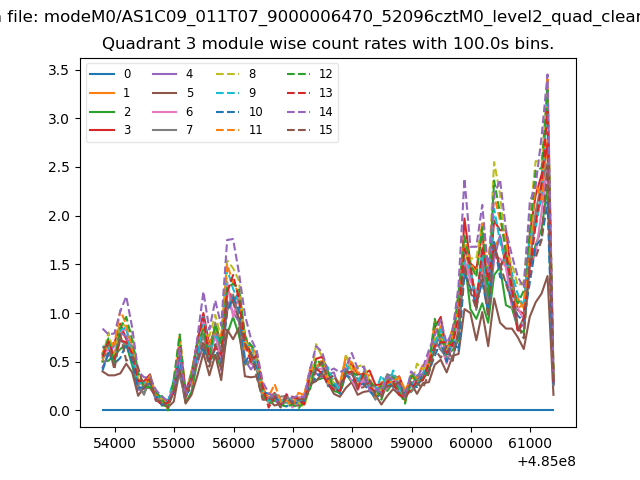
| Module-wise count rates for Quadrant C Data is divided into 100 sec bins |
 |
 |
| Module-wise count rates for Quadrant D Data is divided into 100 sec bins |
 |
 |
| Parameter | Plot |
|---|---|
| CZT HV Monitor | 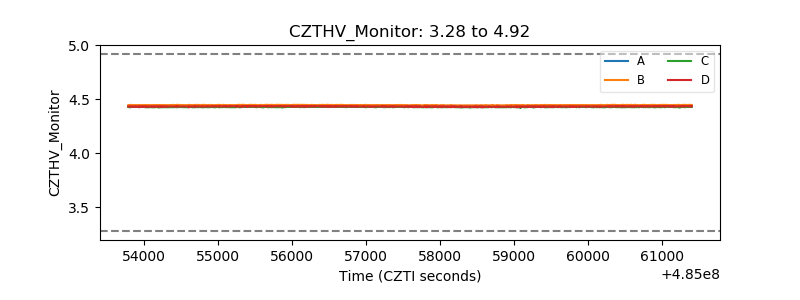 |
| D_VDD | 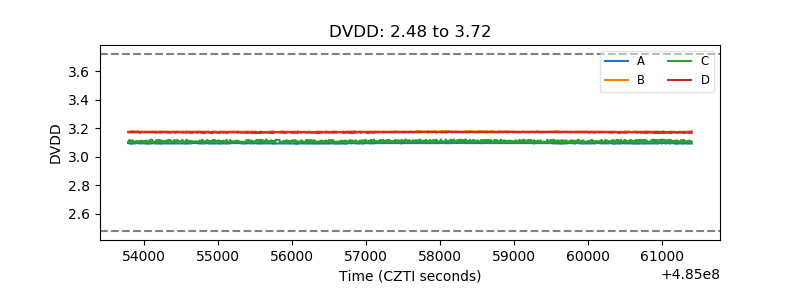 |
| Temperature 1 |  |
| Veto HV Monitor |  |
| Veto LLD | 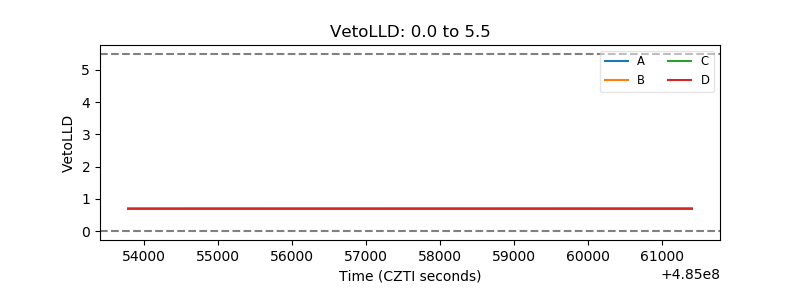 |
| Alpha Counter | 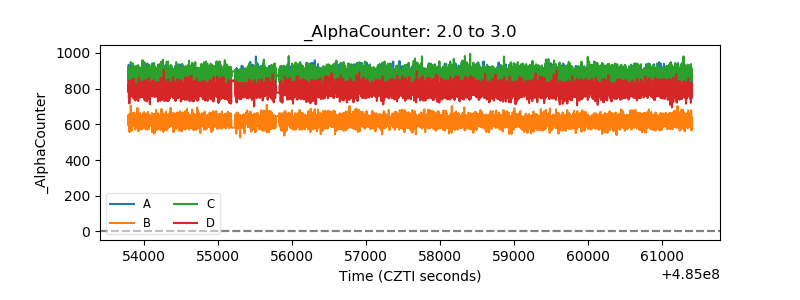 |
| _CPM_Rate | 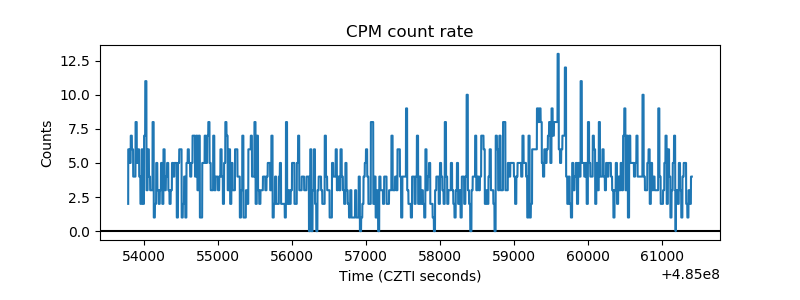 |
| CZT Counter | 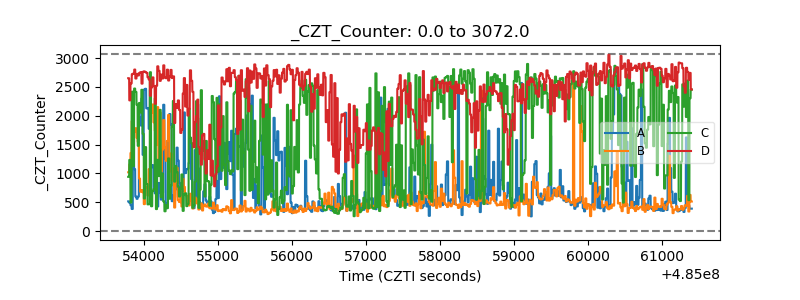 |
| +2.5 Volts monitor | 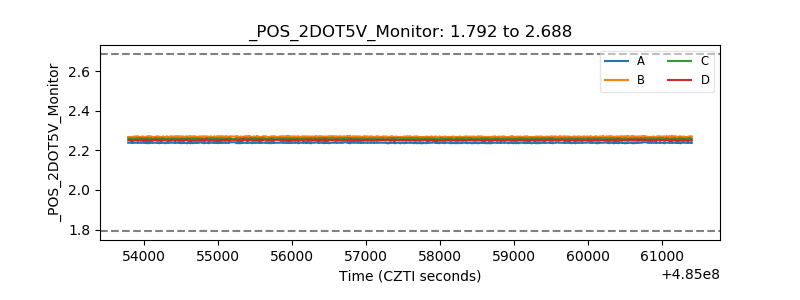 |
| +5 Volts monitor | 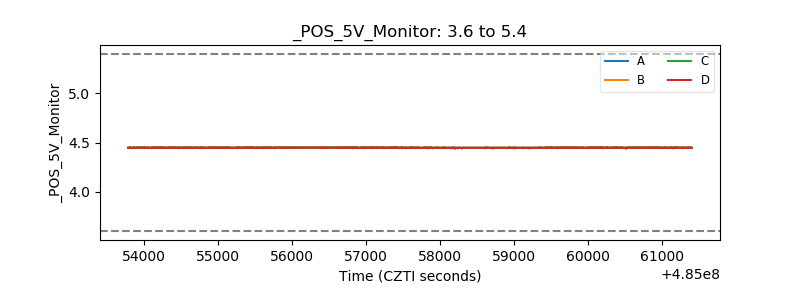 |
| _ROLL_ROT | 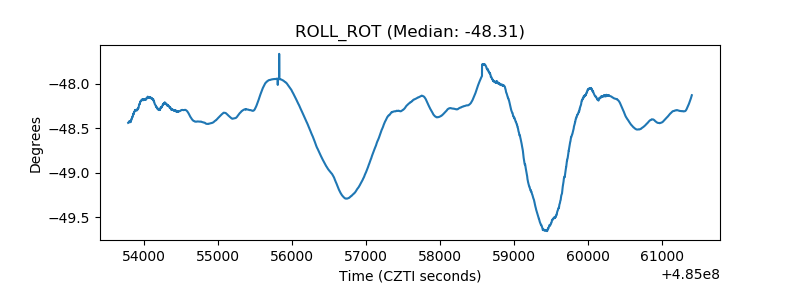 |
| _Roll_DEC | 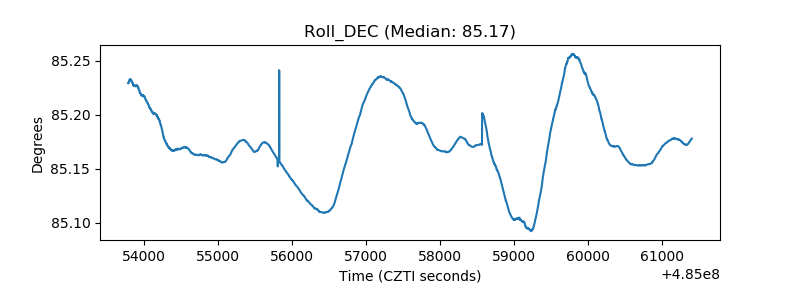 |
| _Roll_RA | 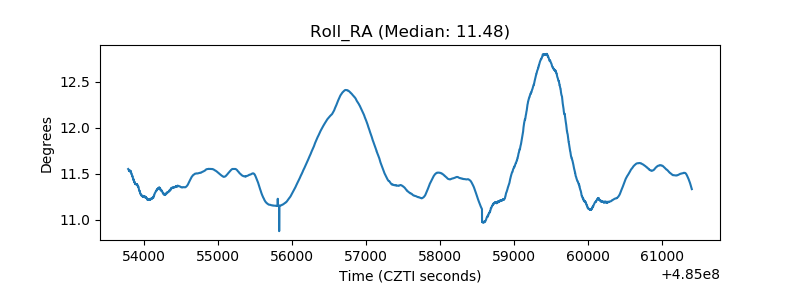 |
| Veto Counter | 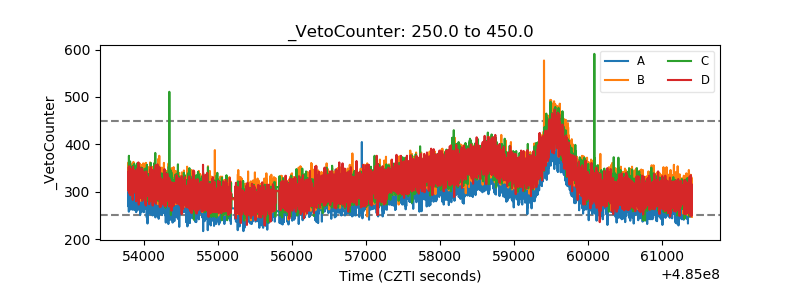 |