| Param | Original file | Final file |
|---|---|---|
| Filename | modeM0/AS1C09_011T07_9000006470_52099cztM0_level2.fits | modeM0/AS1C09_011T07_9000006470_52099cztM0_level2_quad_clean.evt |
| Size (bytes) | 1,932,854,400 | 126,434,880 |
| Size | 1.8 GB | 120.6 MB |
| Events in quadrant A | 8,702,022 | 1,072,413 |
| Events in quadrant B | 11,544,205 | 1,093,108 |
| Events in quadrant C | 19,700,210 | 742,390 |
| Events in quadrant D | 30,631,797 | 48,587 |
| Mode SS | |||
|---|---|---|---|
| Quadrant | BADHDUFLAG | Total packets | Discarded packets |
| A | 0 | 260 | 0 |
| B | 0 | 258 | 1 |
| C | 0 | 260 | 3 |
| D | 0 | 260 | 2 |
| Mode M9 | |||
|---|---|---|---|
| Quadrant | BADHDUFLAG | Total packets | Discarded packets |
| A | 0 | 10 | 0 |
| B | 0 | 11 | 1 |
| C | 0 | 11 | 1 |
| D | 0 | 10 | 0 |
| Mode M0 | |||
|---|---|---|---|
| Quadrant | BADHDUFLAG | Total packets | Discarded packets |
| A | 0 | 34874 | 532 |
| B | 0 | 43558 | 469 |
| C | 0 | 68716 | 1406 |
| D | 0 | 101369 | 1754 |
| Quadrant | Total seconds | Saturated seconds | Saturation percentage |
|---|---|---|---|
| A | 12605 | 825 | 6.545022% |
| B | 12599 | 1776 | 14.096357% |
| C | 12570 | 4646 | 36.961018% |
| D | 12565 | 12028 | 95.726224% |
Noise dominated data is calculated using 1-second bins in cleaned event files. If a bin has >2000 counts, and if more than 50% of those come from <1% of pixels, then it is considered to be noise-dominated and hence unusable.
| Quadrant | # 1 sec bins | Bins with >0 counts | Bins with >2000 counts | High rate bins dominated by noise | Noise dominated (total time) | Noise dominated (detector-on time) | Marked lightcurve |
|---|---|---|---|---|---|---|---|
| A | 13912 | 12633 | 590 | 590 | 4.24% | 4.67% | 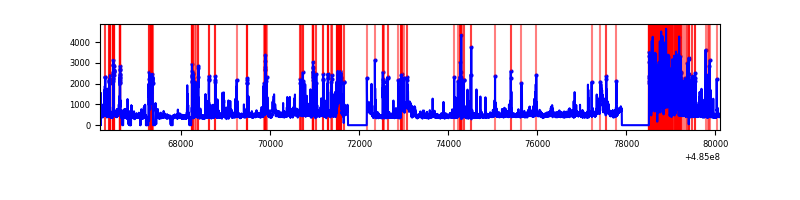 |
| B | 13920 | 12631 | 1122 | 1122 | 8.06% | 8.88% | 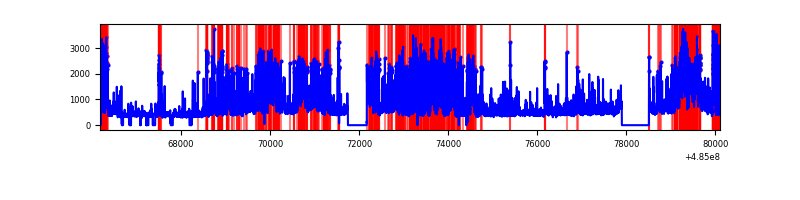 |
| C | 13920 | 12602 | 4064 | 4064 | 29.20% | 32.25% | 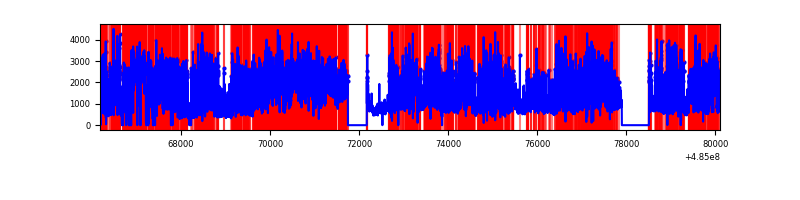 |
| D | 13920 | 12596 | 10282 | 10282 | 73.86% | 81.63% | 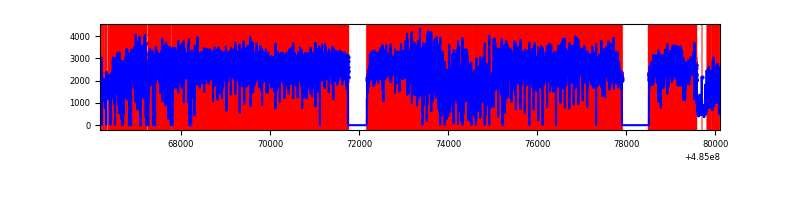 |
Top three noisy pixels from each quadrant. If the there are fewer than three noisy pixels in the level2.evt file, extra rows are filled as -1
| Pixel properties | Quadrant properties | ||||||
|---|---|---|---|---|---|---|---|
| Quadrant | DetID | PixID | Counts | Sigma | Mean | Median | Sigma |
| A | 3 | 114 | 1238393 | 3909.56 | 1287 | 1254 | 316.4 |
| A | 8 | 43 | 396260 | 1248.28 | 1287 | 1254 | 316.4 |
| A | 3 | 61 | 344977 | 1086.22 | 1287 | 1254 | 316.4 |
| B | 8 | 3 | 4739938 | 17993.89 | 1242 | 1201 | 263.4 |
| B | 10 | 254 | 452630 | 1714.16 | 1242 | 1201 | 263.4 |
| B | 10 | 44 | 186978 | 705.43 | 1242 | 1201 | 263.4 |
| C | 15 | 224 | 8530108 | 28702.16 | 1074 | 1067 | 297.2 |
| C | 5 | 80 | 4911934 | 16526.18 | 1074 | 1067 | 297.2 |
| C | 15 | 148 | 787457 | 2646.38 | 1074 | 1067 | 297.2 |
| D | 12 | 17 | 9709731 | 101392.99 | 334 | 318 | 95.8 |
| D | 15 | 94 | 9476689 | 98959.39 | 334 | 318 | 95.8 |
| D | 6 | 42 | 8889007 | 92822.37 | 334 | 318 | 95.8 |
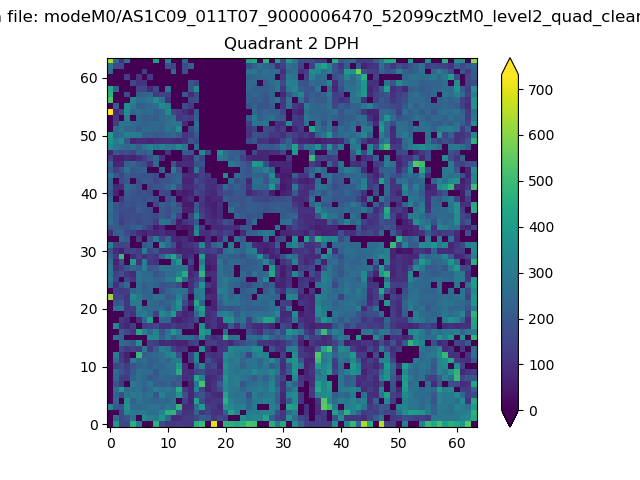
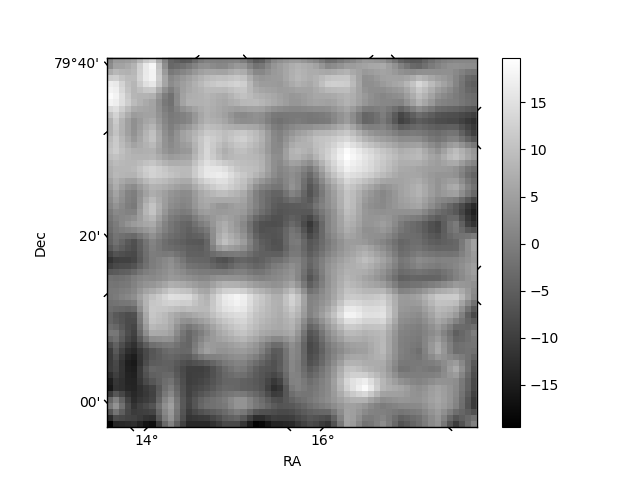
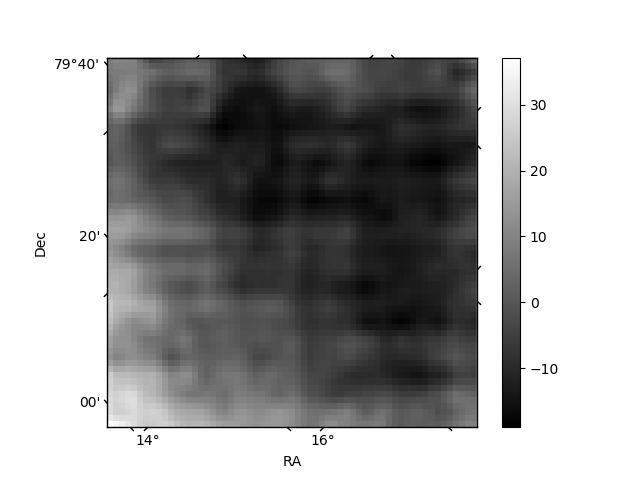
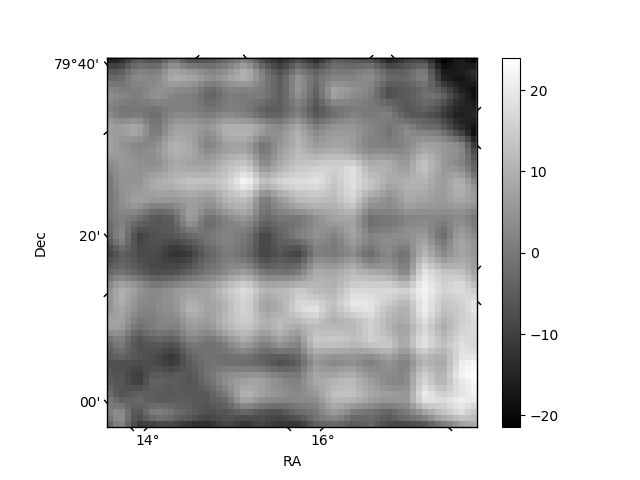
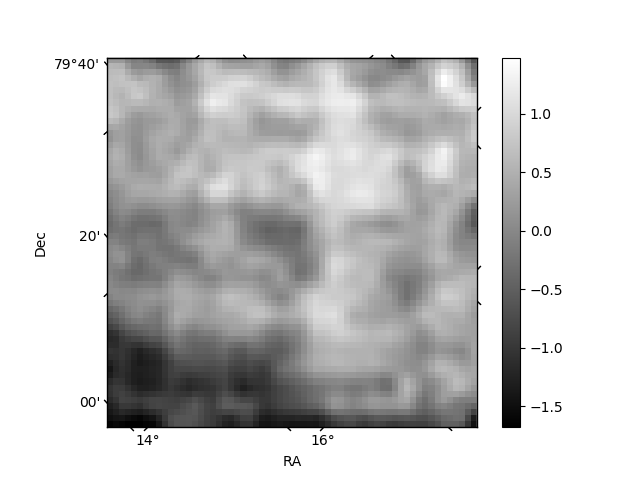
Histogram calculated using DETX and DETY for each event in the final _common_clean file
| Quadrant A | 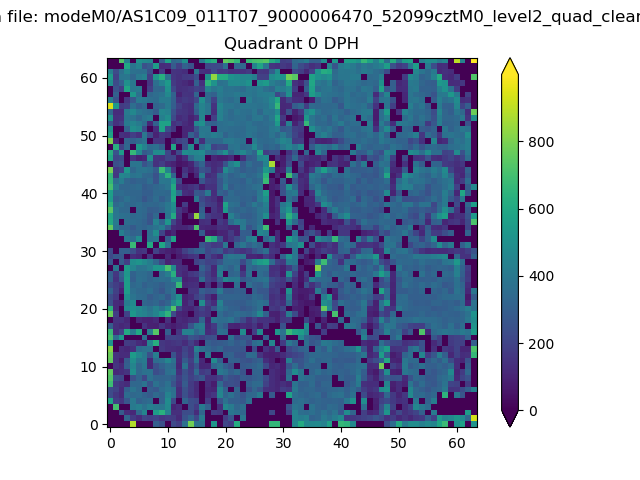 |
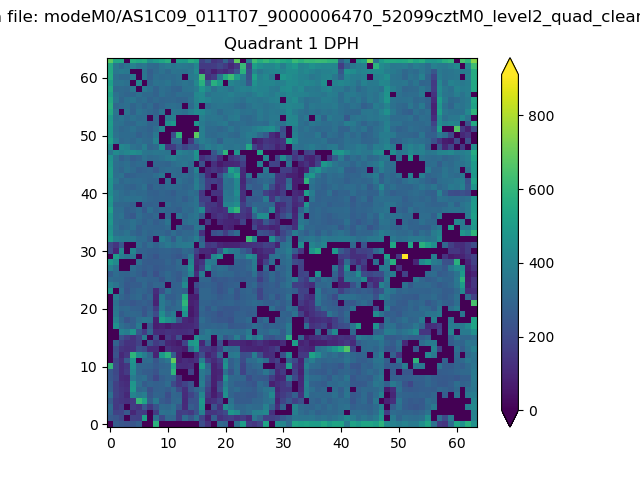 |
Quadrant B |
|---|---|---|---|
| Quadrant D | 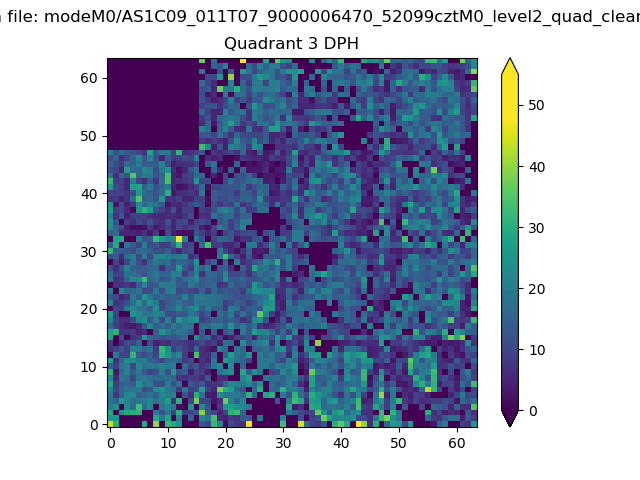 |
 |
Quadrant C |
| Plot type | Count rate plots | Images |
|---|---|---|
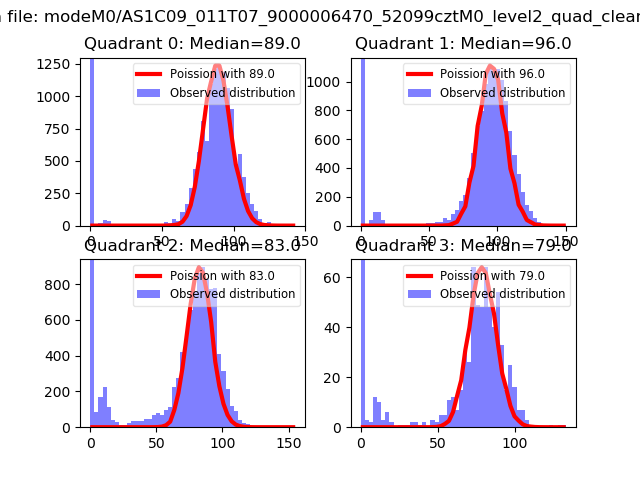
| Comparison with Poisson distribution Blue bars denote a histogram of data divided into 1 sec bins. Red curve is a Poisson curve with rate = median count rate of data. |
 |
 |
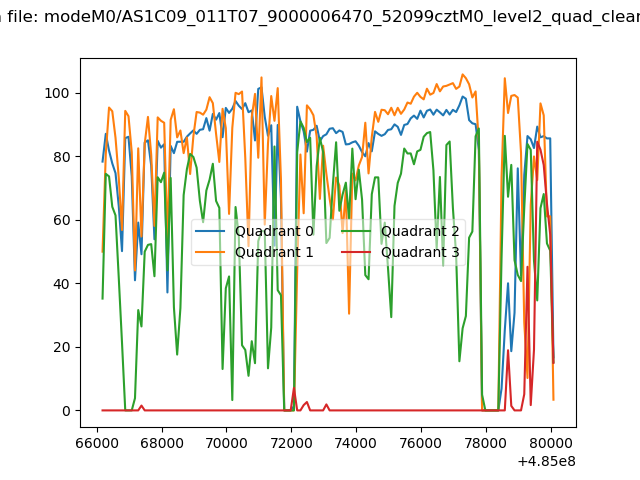
| Quadrant-wise count rates Data is divided into 100 sec bins |
 |
|
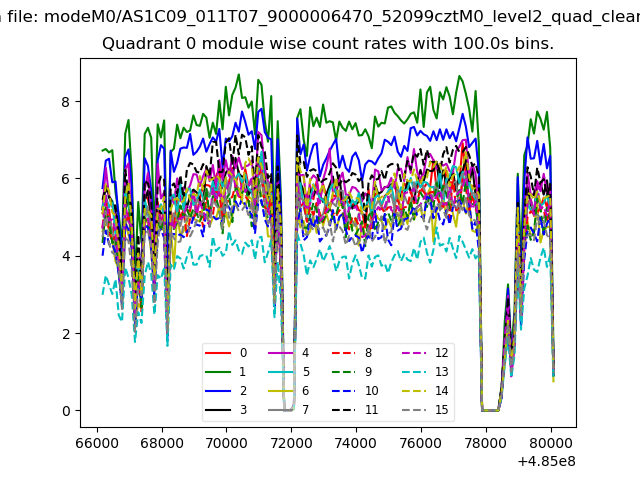
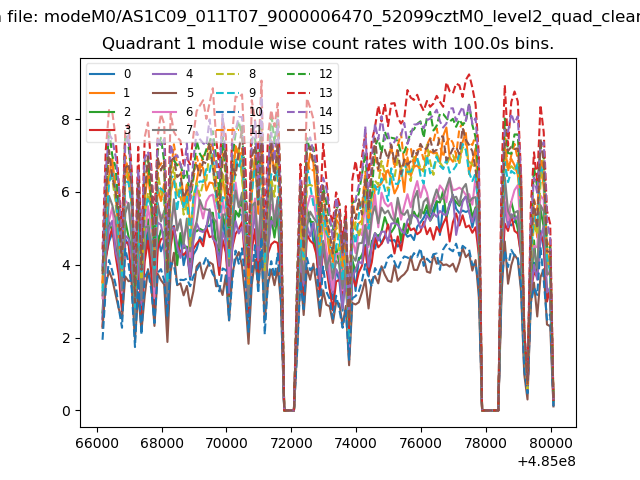
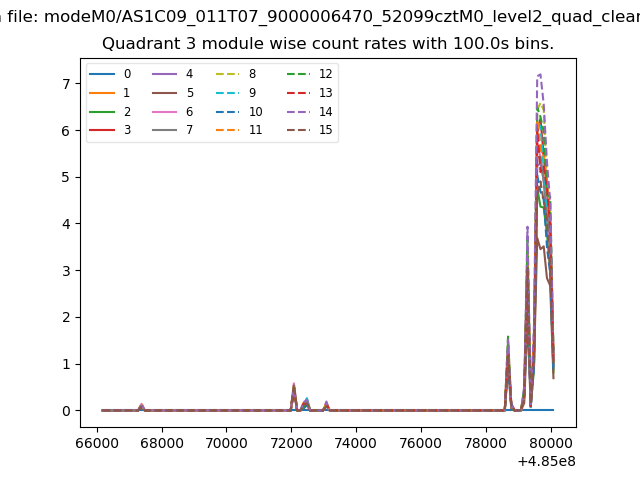
| Module-wise count rates for Quadrant A Data is divided into 100 sec bins |
 |
 |
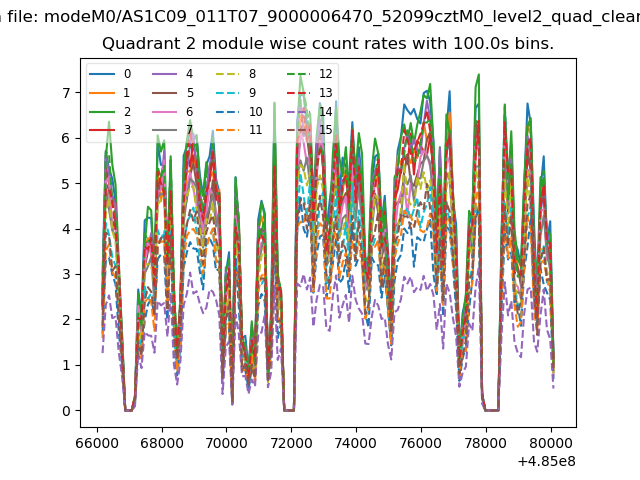
| Module-wise count rates for Quadrant B Data is divided into 100 sec bins |
 |
 |
| Module-wise count rates for Quadrant C Data is divided into 100 sec bins |
 |
 |
| Module-wise count rates for Quadrant D Data is divided into 100 sec bins |
 |
 |
| Parameter | Plot |
|---|---|
| CZT HV Monitor | 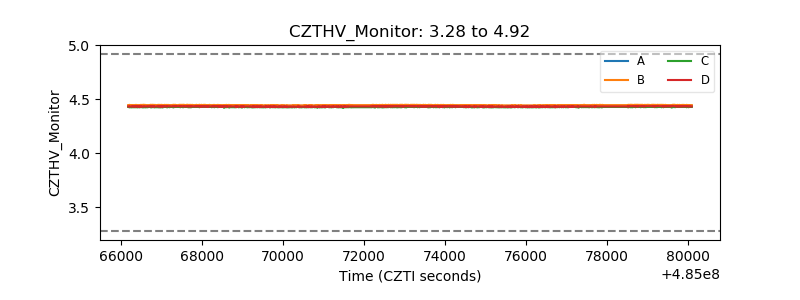 |
| D_VDD | 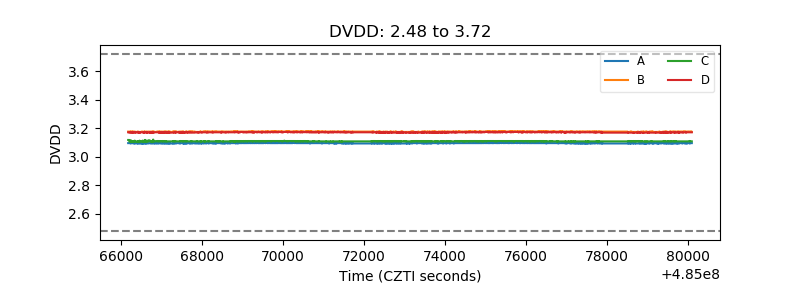 |
| Temperature 1 | 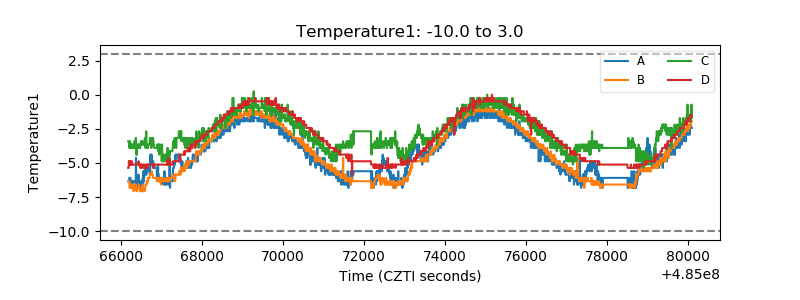 |
| Veto HV Monitor | 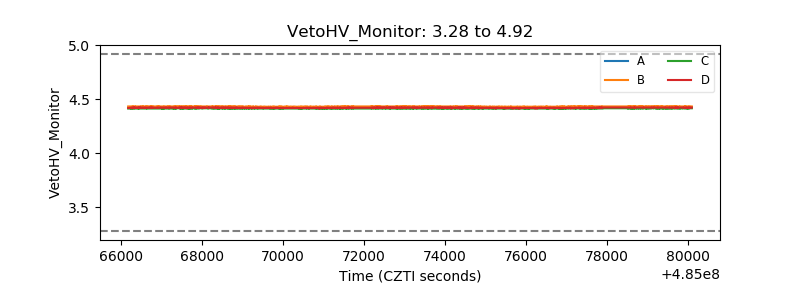 |
| Veto LLD | 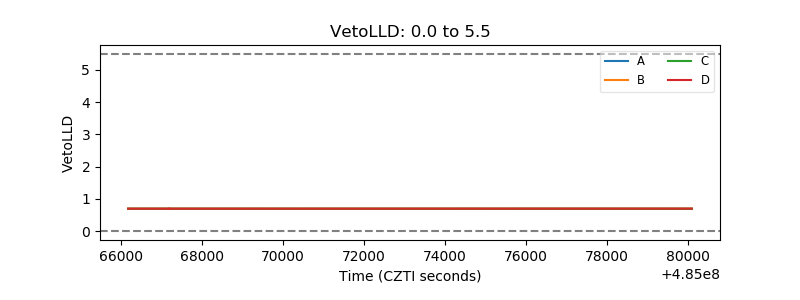 |
| Alpha Counter | 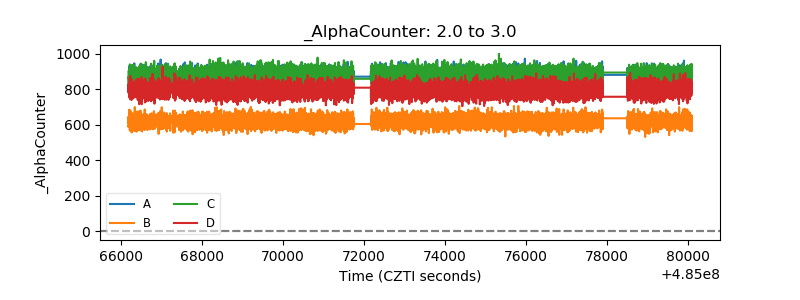 |
| _CPM_Rate | 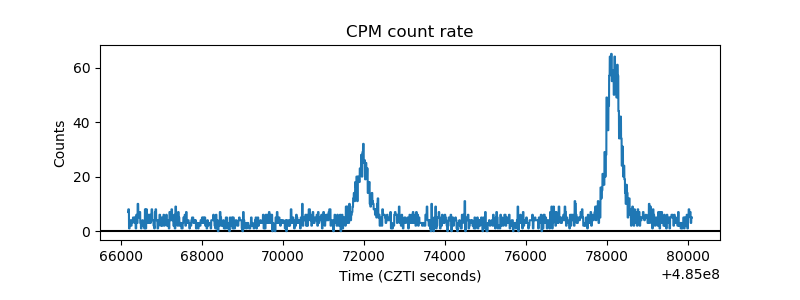 |
| CZT Counter | 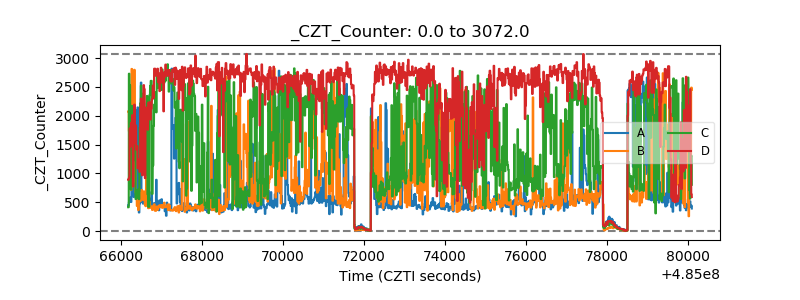 |
| +2.5 Volts monitor |  |
| +5 Volts monitor | 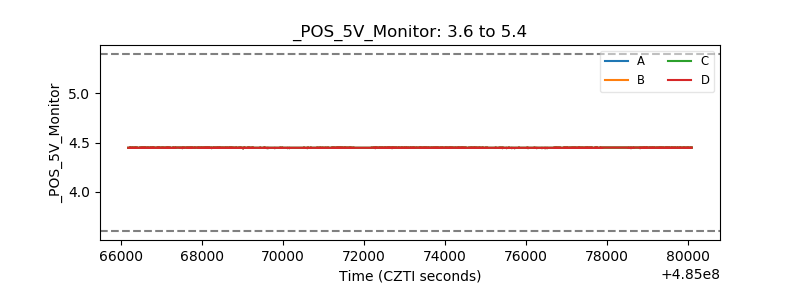 |
| _ROLL_ROT | 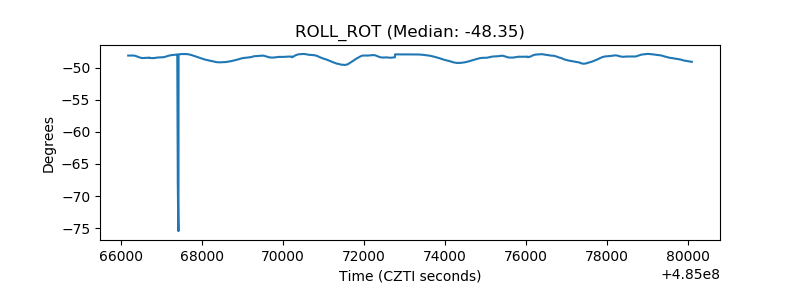 |
| _Roll_DEC | 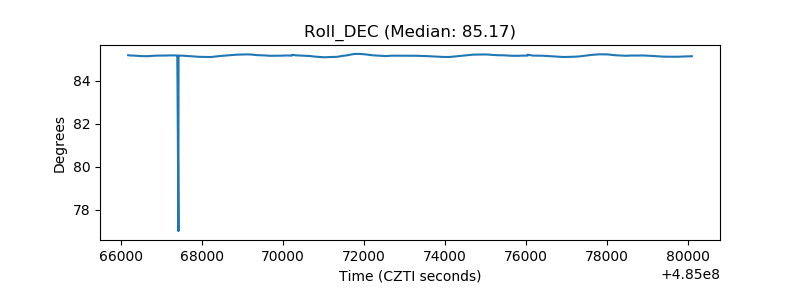 |
| _Roll_RA | 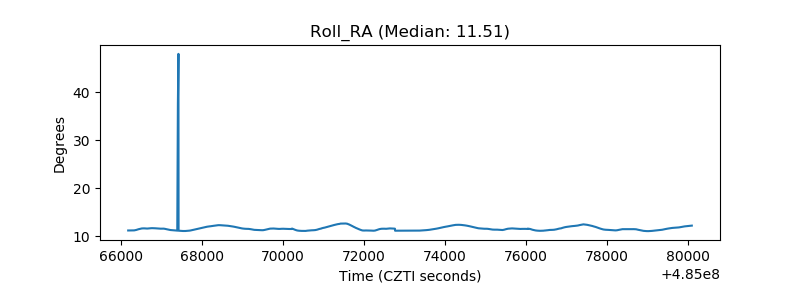 |
| Veto Counter | 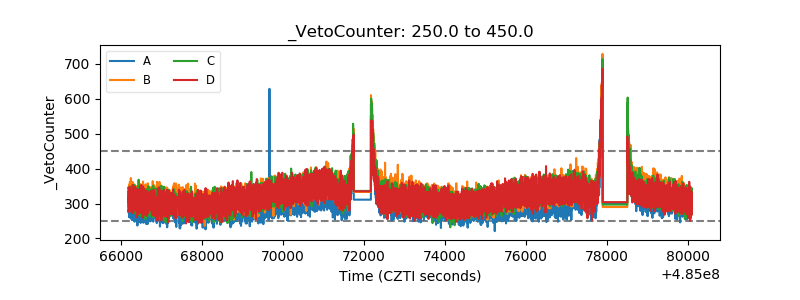 |