| Param | Original file | Final file |
|---|---|---|
| Filename | modeM0/AS1C09_011T07_9000006470_52100cztM0_level2.fits | modeM0/AS1C09_011T07_9000006470_52100cztM0_level2_quad_clean.evt |
| Size (bytes) | 1,092,611,520 | 58,250,880 |
| Size | 1.0 GB | 55.6 MB |
| Events in quadrant A | 3,967,642 | 561,715 |
| Events in quadrant B | 10,509,222 | 327,563 |
| Events in quadrant C | 12,049,015 | 261,439 |
| Events in quadrant D | 13,434,542 | 173,523 |
| Mode SS | |||
|---|---|---|---|
| Quadrant | BADHDUFLAG | Total packets | Discarded packets |
| A | 0 | 128 | 0 |
| B | 0 | 128 | 0 |
| C | 0 | 128 | 0 |
| D | 0 | 128 | 0 |
| Mode M9 | |||
|---|---|---|---|
| Quadrant | BADHDUFLAG | Total packets | Discarded packets |
| A | 0 | 8 | 0 |
| B | 0 | 8 | 0 |
| C | 0 | 8 | 0 |
| D | 0 | 8 | 0 |
| Mode M0 | |||
|---|---|---|---|
| Quadrant | BADHDUFLAG | Total packets | Discarded packets |
| A | 0 | 16019 | 2 |
| B | 0 | 35564 | 12 |
| C | 0 | 40181 | 22 |
| D | 0 | 44215 | 33 |
| Quadrant | Total seconds | Saturated seconds | Saturation percentage |
|---|---|---|---|
| A | 6289 | 284 | 4.515821% |
| B | 6288 | 3262 | 51.876590% |
| C | 6286 | 3524 | 56.061088% |
| D | 6285 | 4317 | 68.687351% |
Noise dominated data is calculated using 1-second bins in cleaned event files. If a bin has >2000 counts, and if more than 50% of those come from <1% of pixels, then it is considered to be noise-dominated and hence unusable.
| Quadrant | # 1 sec bins | Bins with >0 counts | Bins with >2000 counts | High rate bins dominated by noise | Noise dominated (total time) | Noise dominated (detector-on time) | Marked lightcurve |
|---|---|---|---|---|---|---|---|
| A | 7070 | 6291 | 161 | 161 | 2.28% | 2.56% | 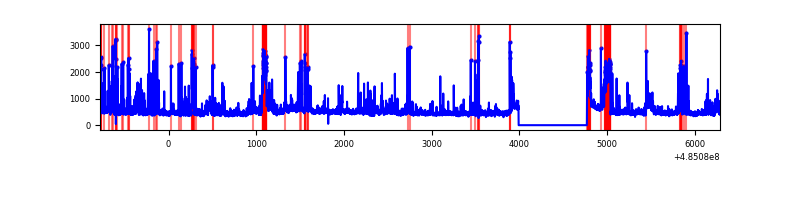 |
| B | 7069 | 6290 | 2542 | 2542 | 35.96% | 40.41% | 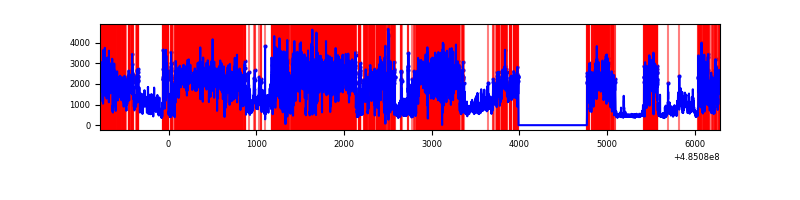 |
| C | 7069 | 6289 | 2987 | 2987 | 42.25% | 47.50% | 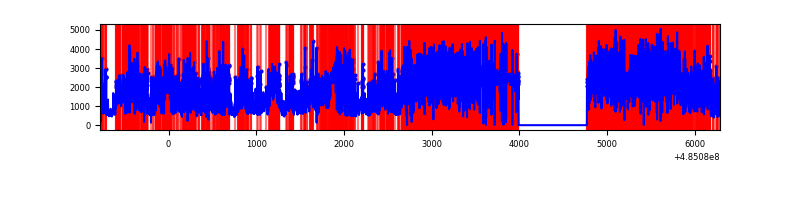 |
| D | 7069 | 6289 | 4280 | 4280 | 60.55% | 68.06% | 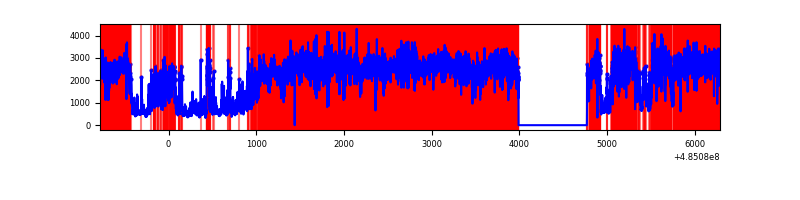 |
Top three noisy pixels from each quadrant. If the there are fewer than three noisy pixels in the level2.evt file, extra rows are filled as -1
| Pixel properties | Quadrant properties | ||||||
|---|---|---|---|---|---|---|---|
| Quadrant | DetID | PixID | Counts | Sigma | Mean | Median | Sigma |
| A | 3 | 114 | 319958 | 1962.0 | 655 | 638 | 162.8 |
| A | 8 | 43 | 212038 | 1298.91 | 655 | 638 | 162.8 |
| A | 3 | 61 | 204959 | 1255.41 | 655 | 638 | 162.8 |
| B | 8 | 3 | 7213950 | 69640.85 | 483 | 466 | 103.6 |
| B | 10 | 254 | 769314 | 7422.66 | 483 | 466 | 103.6 |
| B | 10 | 44 | 118754 | 1141.98 | 483 | 466 | 103.6 |
| C | 5 | 80 | 6273262 | 56458.58 | 400 | 395 | 111.1 |
| C | 15 | 224 | 3167629 | 28506.51 | 400 | 395 | 111.1 |
| C | 15 | 147 | 461656 | 4151.55 | 400 | 395 | 111.1 |
| D | 6 | 42 | 7811539 | 65911.81 | 411 | 392 | 118.5 |
| D | 15 | 94 | 1851616 | 15620.95 | 411 | 392 | 118.5 |
| D | 12 | 17 | 1389683 | 11723.08 | 411 | 392 | 118.5 |
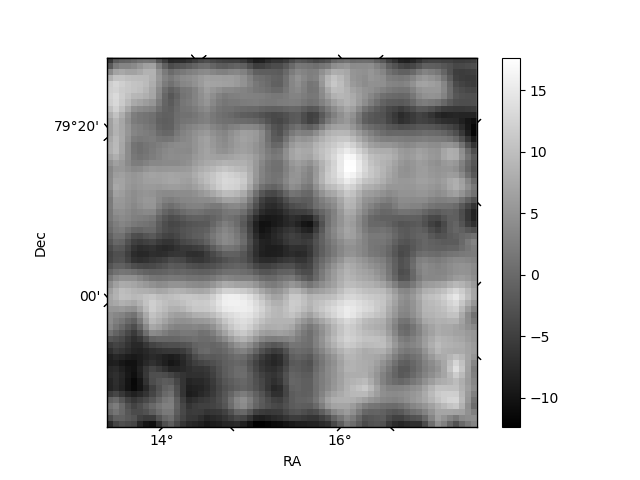
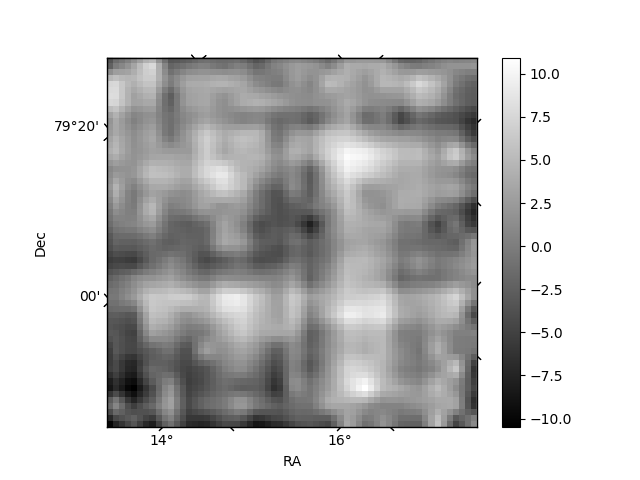
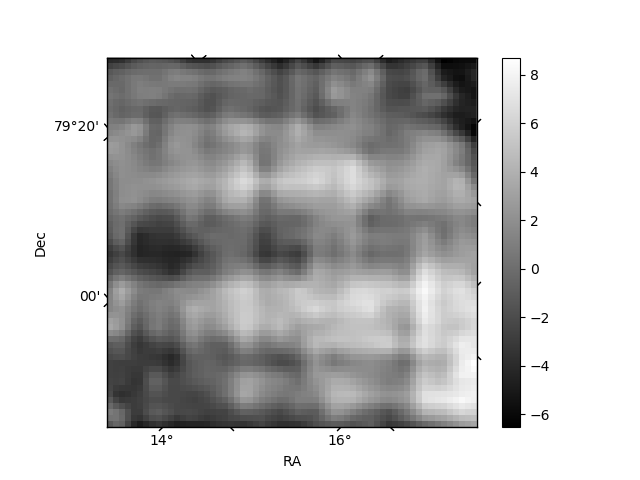
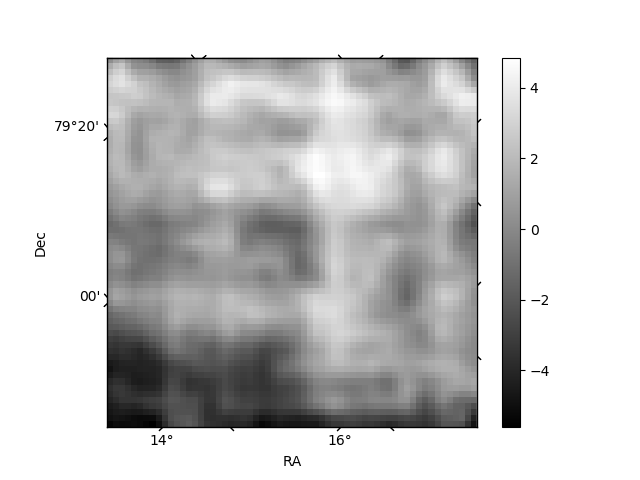
Histogram calculated using DETX and DETY for each event in the final _common_clean file
| Quadrant A | 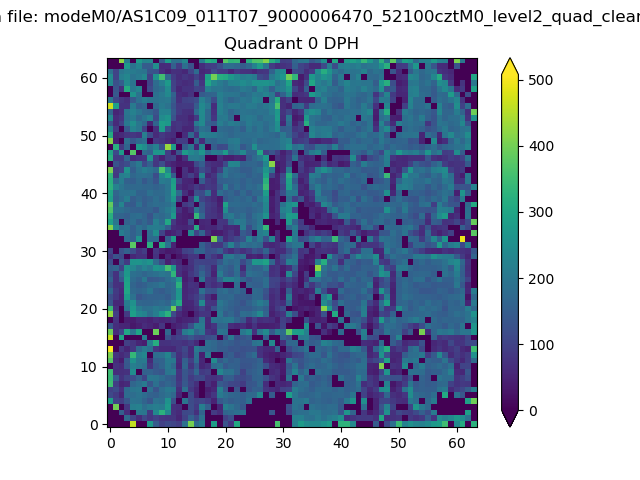 |
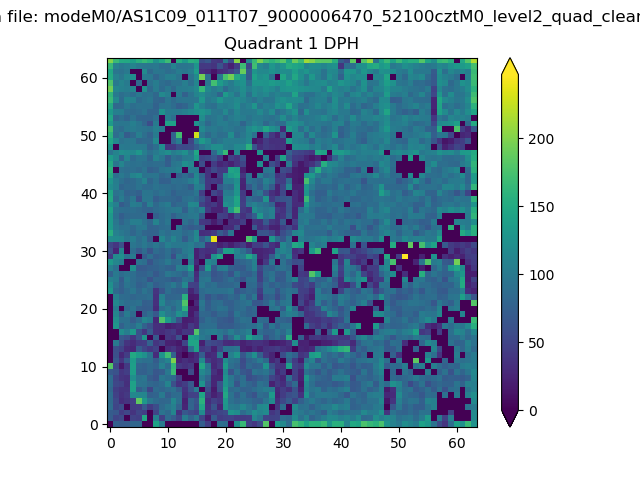 |
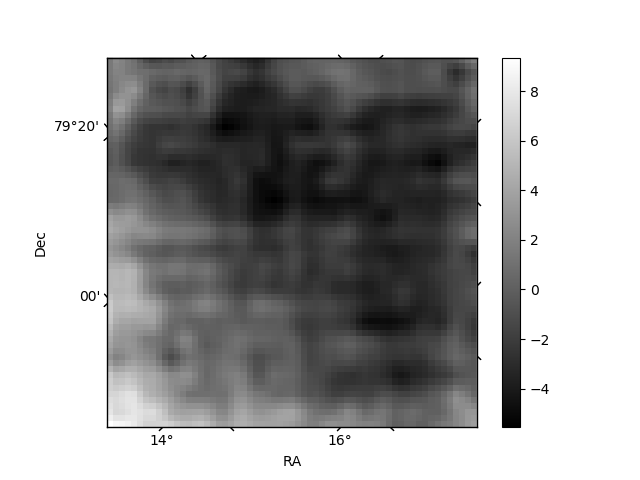
Quadrant B |
|---|---|---|---|
| Quadrant D | 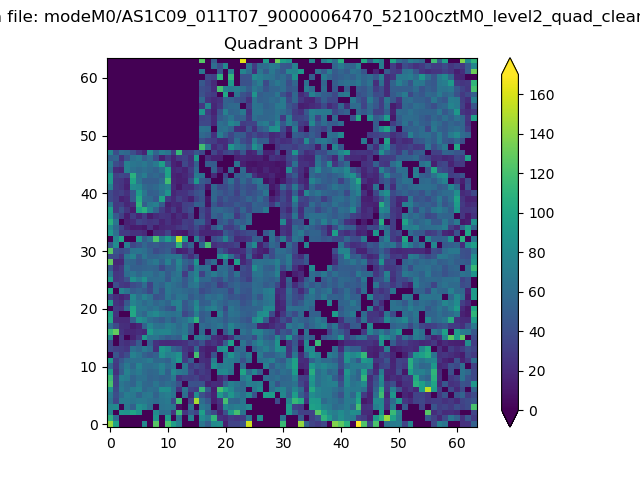 |
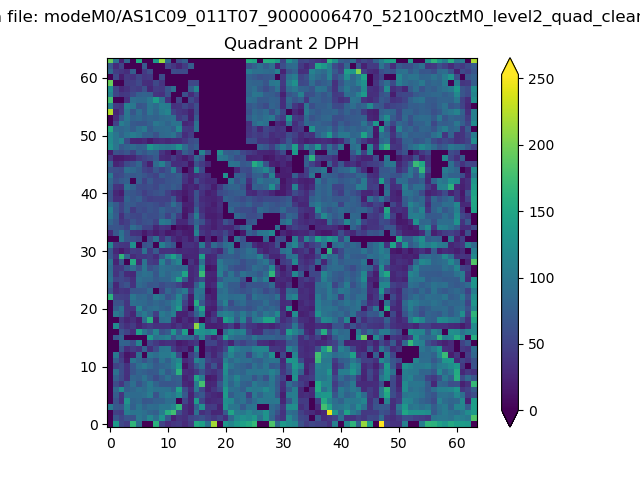 |
Quadrant C |
| Plot type | Count rate plots | Images |
|---|---|---|
| Comparison with Poisson distribution Blue bars denote a histogram of data divided into 1 sec bins. Red curve is a Poisson curve with rate = median count rate of data. |
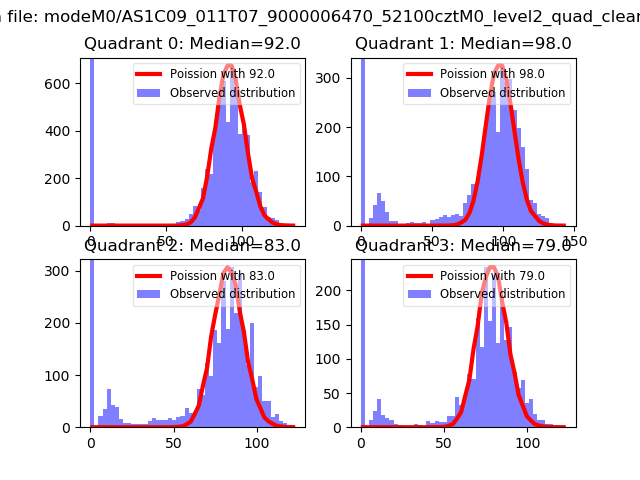 |
 |
| Quadrant-wise count rates Data is divided into 100 sec bins |
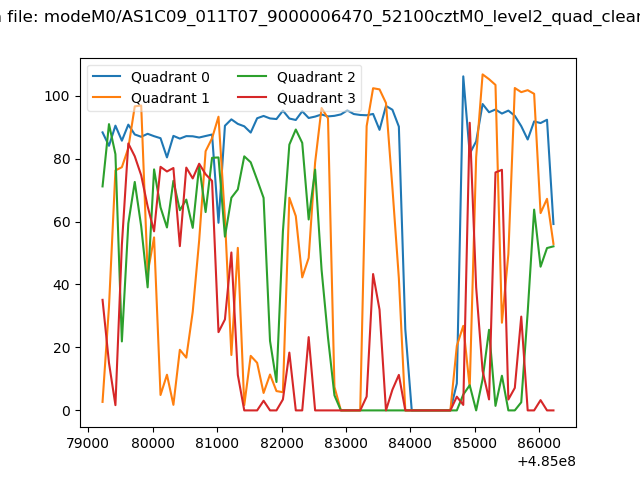 |
|
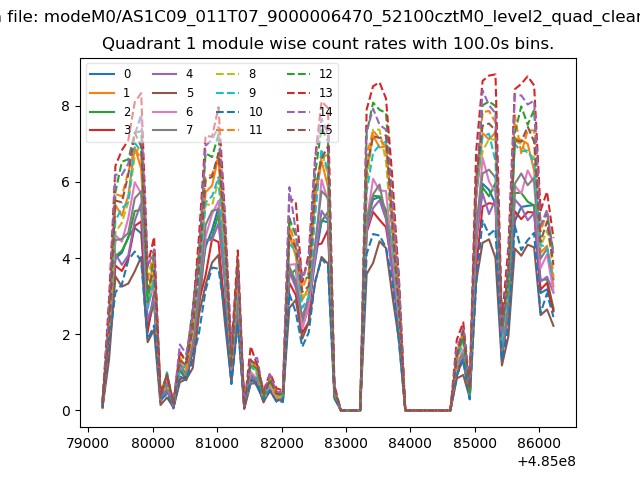
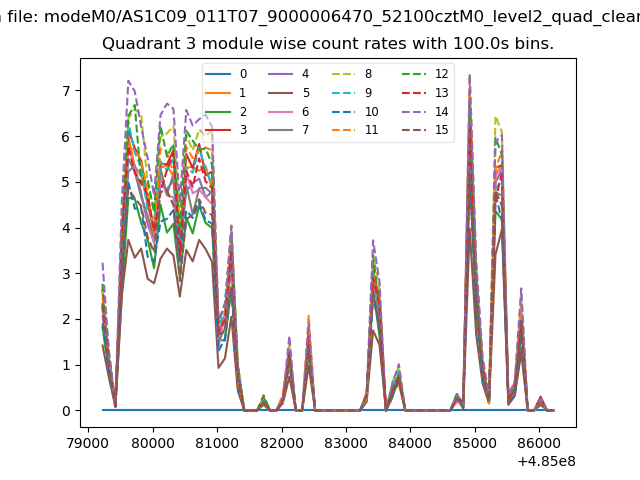
| Module-wise count rates for Quadrant A Data is divided into 100 sec bins |
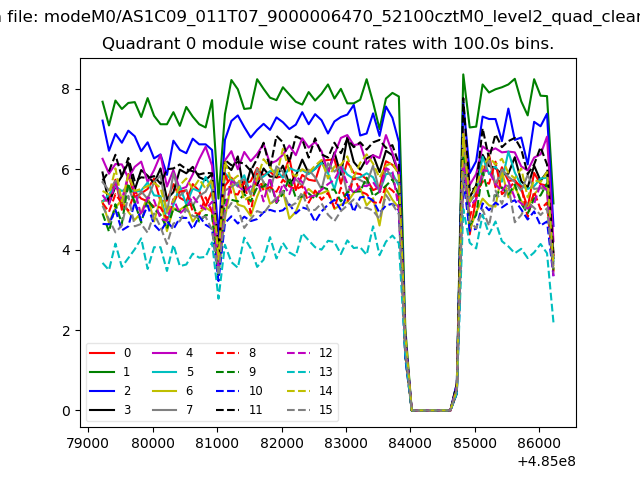 |
 |
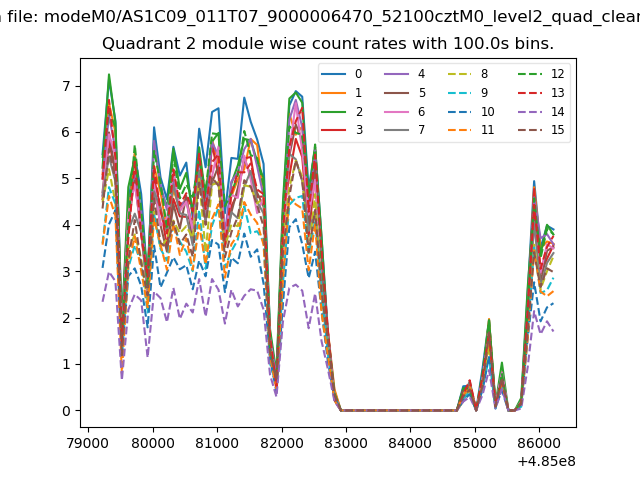
| Module-wise count rates for Quadrant B Data is divided into 100 sec bins |
 |
 |
| Module-wise count rates for Quadrant C Data is divided into 100 sec bins |
 |
 |
| Module-wise count rates for Quadrant D Data is divided into 100 sec bins |
 |
 |
| Parameter | Plot |
|---|---|
| CZT HV Monitor | 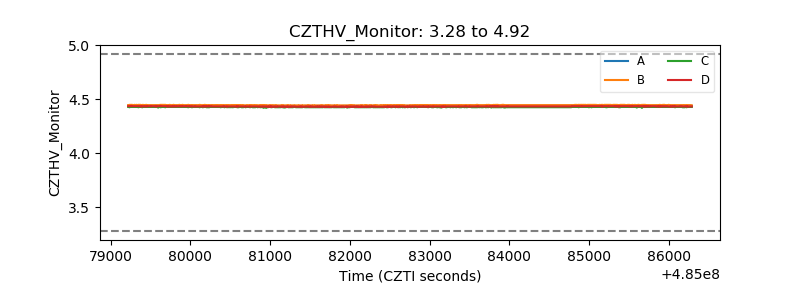 |
| D_VDD | 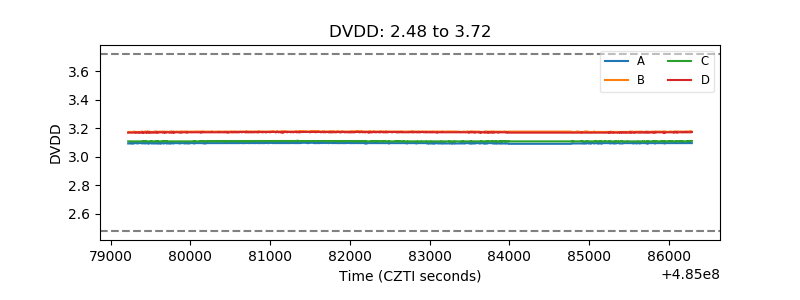 |
| Temperature 1 | 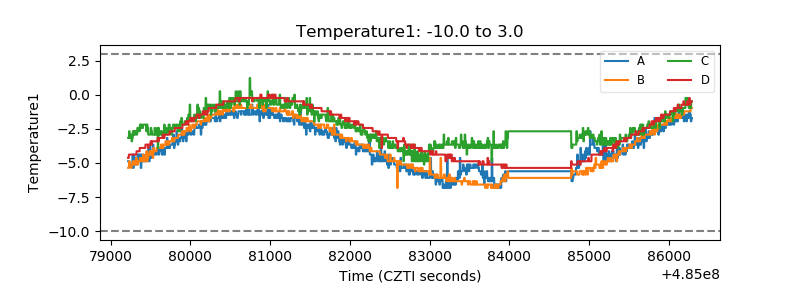 |
| Veto HV Monitor | 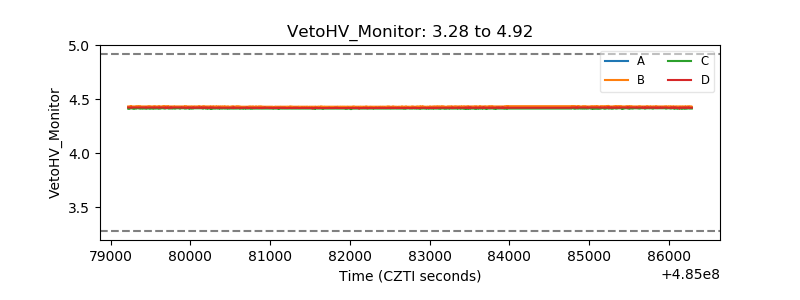 |
| Veto LLD | 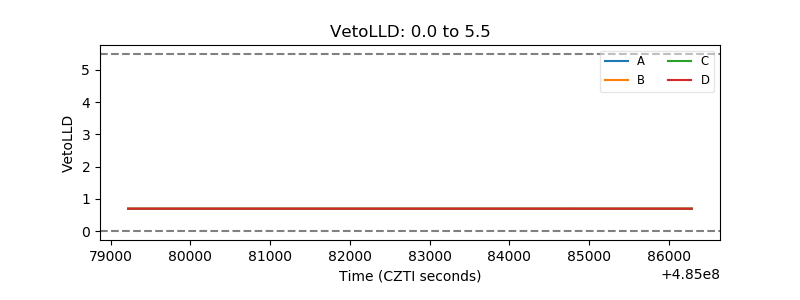 |
| Alpha Counter | 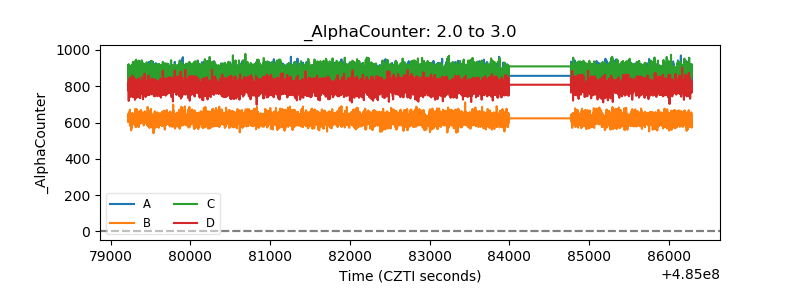 |
| _CPM_Rate |  |
| CZT Counter | 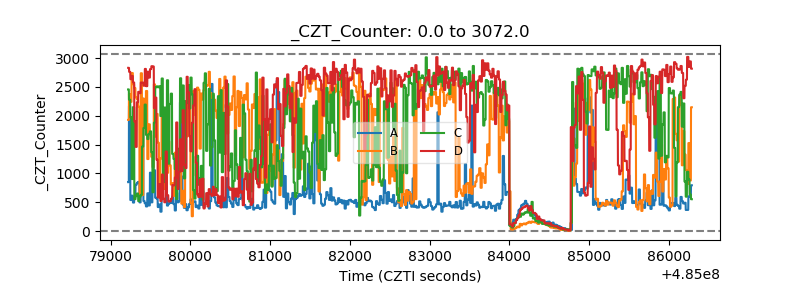 |
| +2.5 Volts monitor | 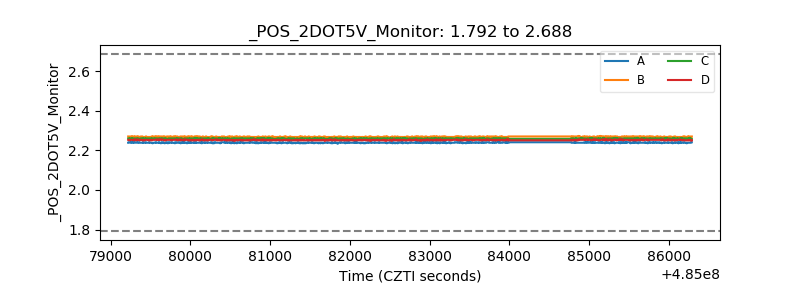 |
| +5 Volts monitor | 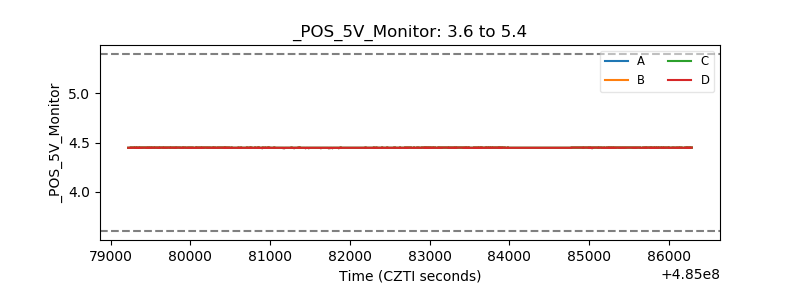 |
| _ROLL_ROT | 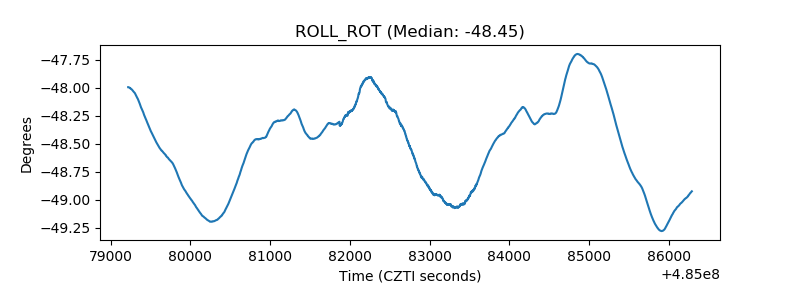 |
| _Roll_DEC | 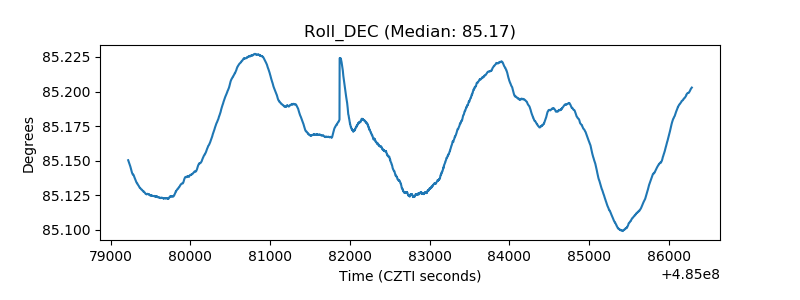 |
| _Roll_RA | 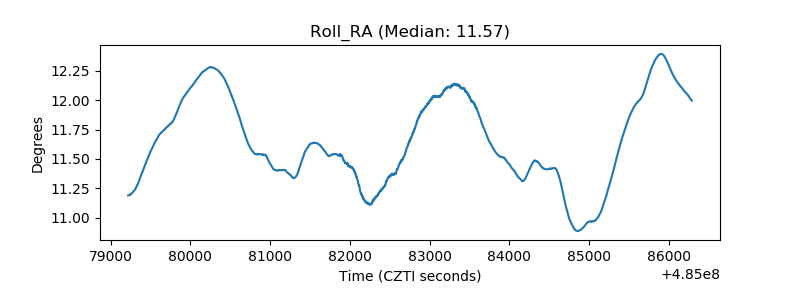 |
| Veto Counter | 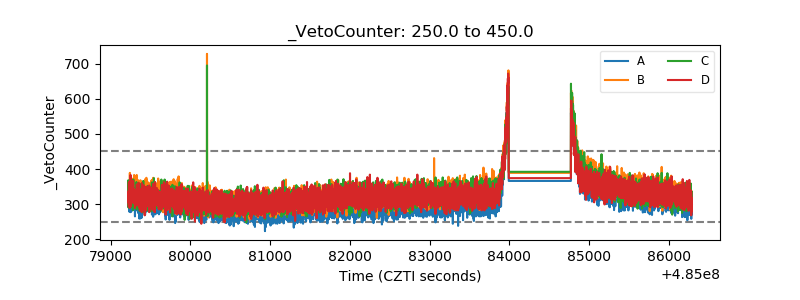 |