| Param | Original file | Final file |
|---|---|---|
| Filename | modeM0/AS1C09_011T07_9000006470_52102cztM0_level2.fits | modeM0/AS1C09_011T07_9000006470_52102cztM0_level2_quad_clean.evt |
| Size (bytes) | 1,068,200,640 | 49,314,240 |
| Size | 1018.7 MB | 47.0 MB |
| Events in quadrant A | 3,689,289 | 551,302 |
| Events in quadrant B | 8,610,297 | 291,195 |
| Events in quadrant C | 12,093,102 | 205,219 |
| Events in quadrant D | 14,695,299 | 33,630 |
| Mode SS | |||
|---|---|---|---|
| Quadrant | BADHDUFLAG | Total packets | Discarded packets |
| A | 0 | 125 | 1 |
| B | 0 | 124 | 0 |
| C | 0 | 125 | 3 |
| D | 0 | 125 | 1 |
| Mode M9 | |||
|---|---|---|---|
| Quadrant | BADHDUFLAG | Total packets | Discarded packets |
| A | 0 | 11 | 1 |
| B | 0 | 10 | 0 |
| C | 0 | 14 | 4 |
| D | 0 | 10 | 0 |
| Mode M0 | |||
|---|---|---|---|
| Quadrant | BADHDUFLAG | Total packets | Discarded packets |
| A | 0 | 15336 | 398 |
| B | 0 | 30634 | 988 |
| C | 0 | 41387 | 1396 |
| D | 0 | 49362 | 1698 |
| Quadrant | Total seconds | Saturated seconds | Saturation percentage |
|---|---|---|---|
| A | 5907 | 130 | 2.200779% |
| B | 5868 | 2994 | 51.022495% |
| C | 5859 | 3830 | 65.369517% |
| D | 5862 | 5548 | 94.643466% |
Noise dominated data is calculated using 1-second bins in cleaned event files. If a bin has >2000 counts, and if more than 50% of those come from <1% of pixels, then it is considered to be noise-dominated and hence unusable.
| Quadrant | # 1 sec bins | Bins with >0 counts | Bins with >2000 counts | High rate bins dominated by noise | Noise dominated (total time) | Noise dominated (detector-on time) | Marked lightcurve |
|---|---|---|---|---|---|---|---|
| A | 7197 | 5933 | 70 | 70 | 0.97% | 1.18% | 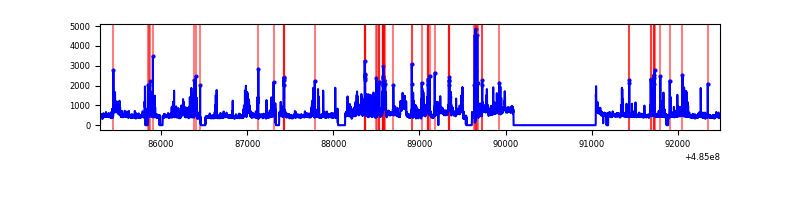 |
| B | 7197 | 5898 | 2187 | 2187 | 30.39% | 37.08% | 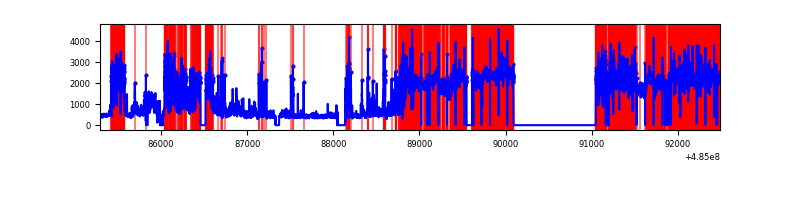 |
| C | 7197 | 5889 | 3291 | 3291 | 45.73% | 55.88% | 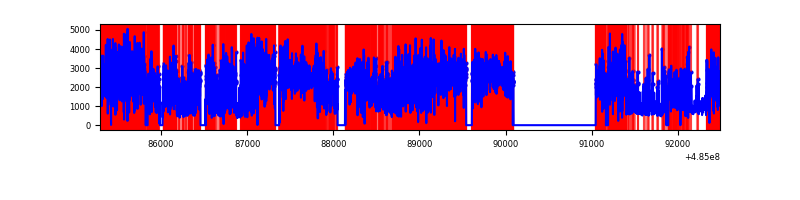 |
| D | 7198 | 5889 | 5191 | 5191 | 72.12% | 88.15% | 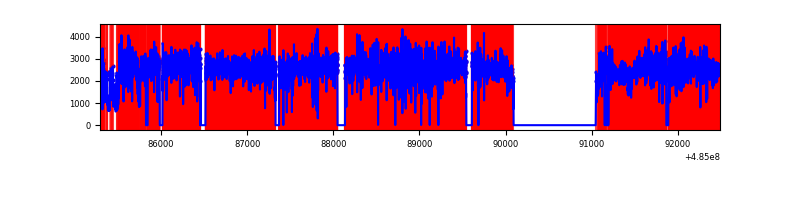 |
Top three noisy pixels from each quadrant. If the there are fewer than three noisy pixels in the level2.evt file, extra rows are filled as -1
| Pixel properties | Quadrant properties | ||||||
|---|---|---|---|---|---|---|---|
| Quadrant | DetID | PixID | Counts | Sigma | Mean | Median | Sigma |
| A | 8 | 43 | 237781 | 1518.22 | 624 | 608 | 156.2 |
| A | 3 | 61 | 208472 | 1330.6 | 624 | 608 | 156.2 |
| A | 5 | 240 | 170052 | 1084.66 | 624 | 608 | 156.2 |
| B | 8 | 3 | 6494878 | 83630.86 | 356 | 346 | 77.7 |
| B | 10 | 254 | 284216 | 3655.43 | 356 | 346 | 77.7 |
| B | 8 | 128 | 63924 | 818.7 | 356 | 346 | 77.7 |
| C | 5 | 80 | 6608434 | 64931.52 | 366 | 362 | 101.8 |
| C | 15 | 224 | 3245543 | 31887.44 | 366 | 362 | 101.8 |
| C | 15 | 147 | 204112 | 2002.06 | 366 | 362 | 101.8 |
| D | 6 | 42 | 10996708 | 137442.24 | 276 | 264 | 80.0 |
| D | 15 | 94 | 1760478 | 22000.55 | 276 | 264 | 80.0 |
| D | 12 | 17 | 295871 | 3694.73 | 276 | 264 | 80.0 |
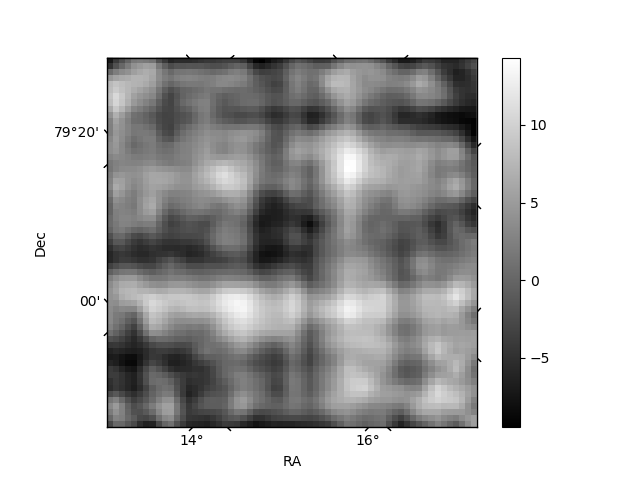
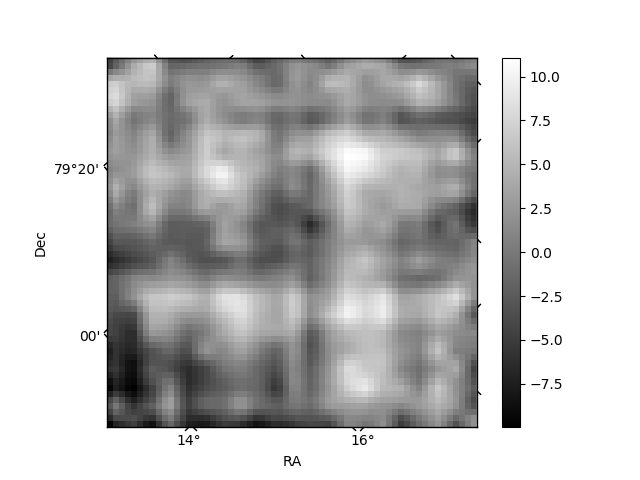
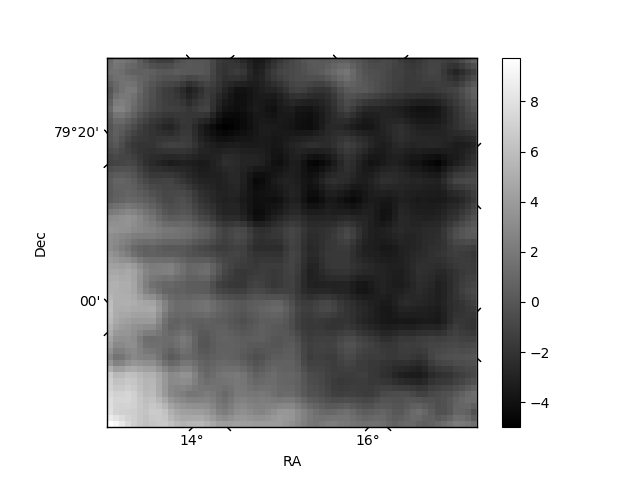
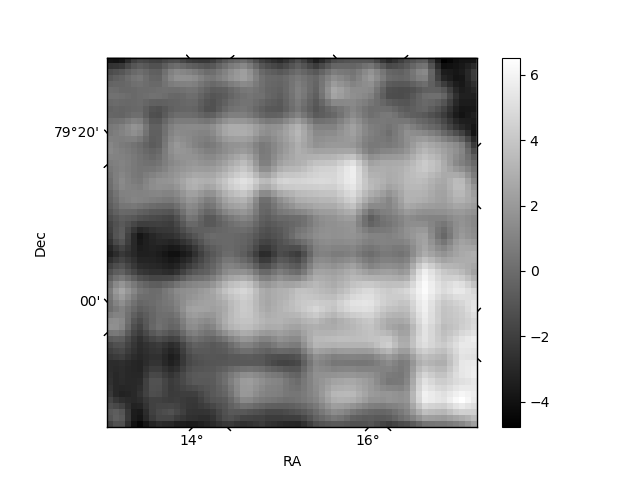
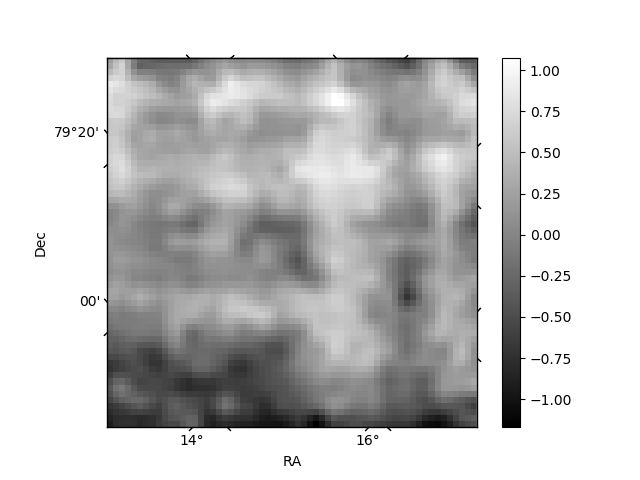
Histogram calculated using DETX and DETY for each event in the final _common_clean file
| Quadrant A | 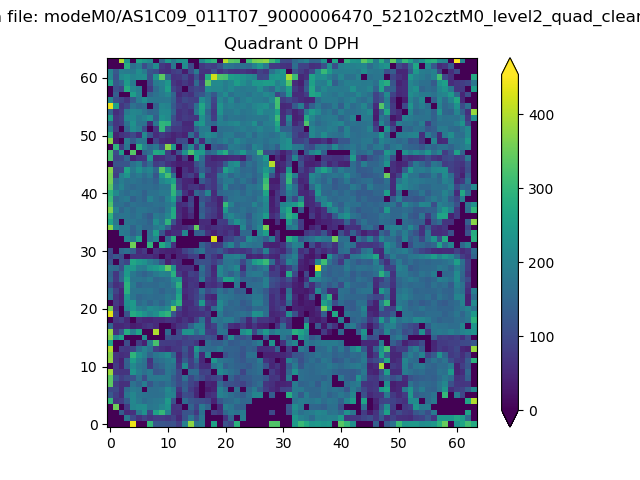 |
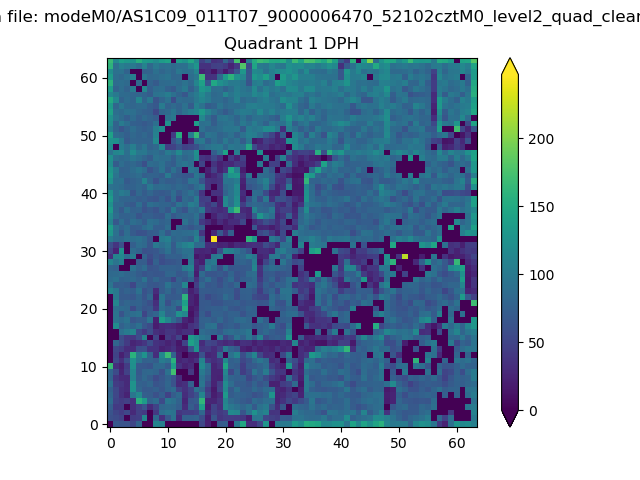 |
Quadrant B |
|---|---|---|---|
| Quadrant D | 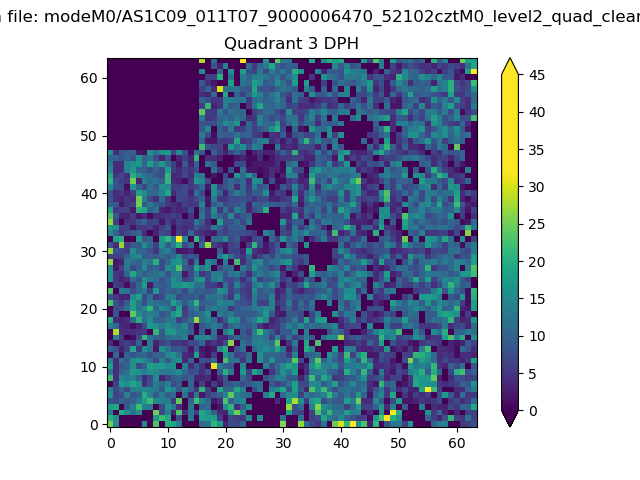 |
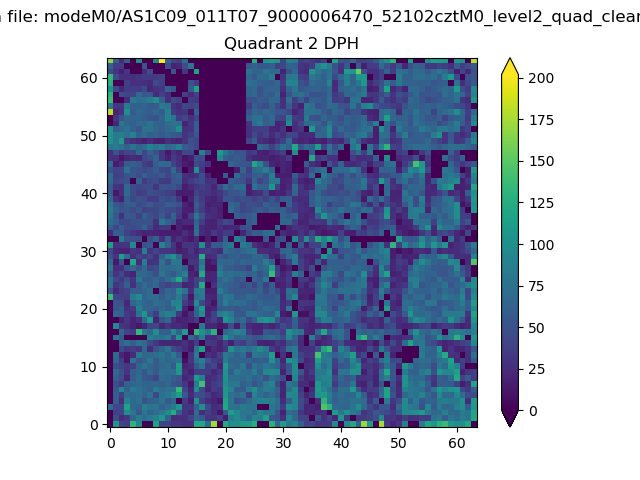 |
Quadrant C |
| Plot type | Count rate plots | Images |
|---|---|---|
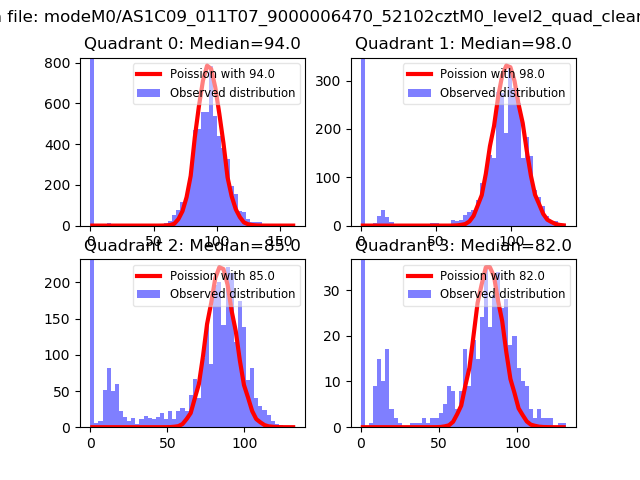
| Comparison with Poisson distribution Blue bars denote a histogram of data divided into 1 sec bins. Red curve is a Poisson curve with rate = median count rate of data. |
 |
 |
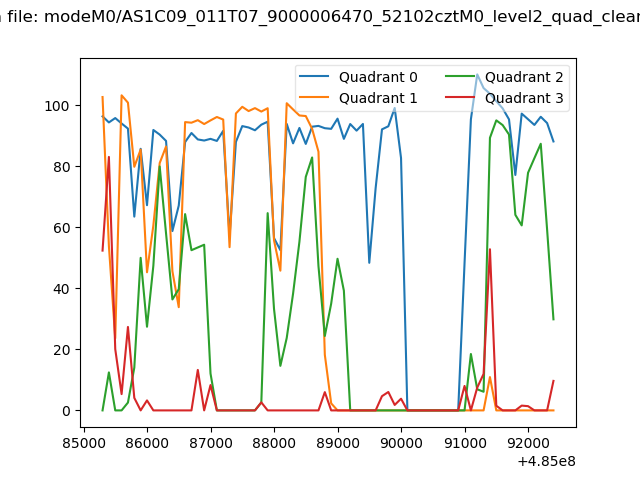
| Quadrant-wise count rates Data is divided into 100 sec bins |
 |
|
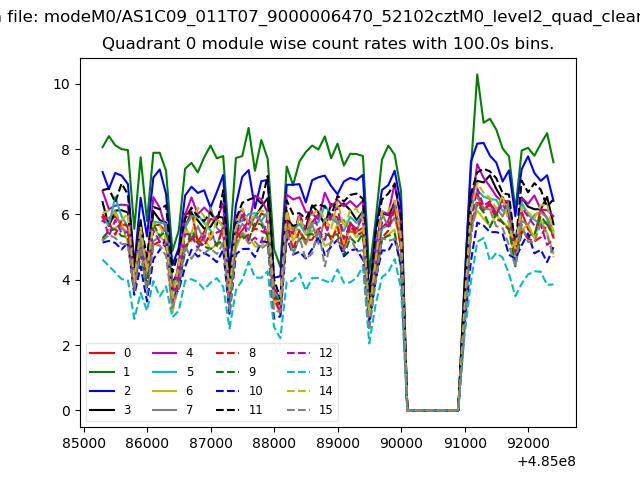
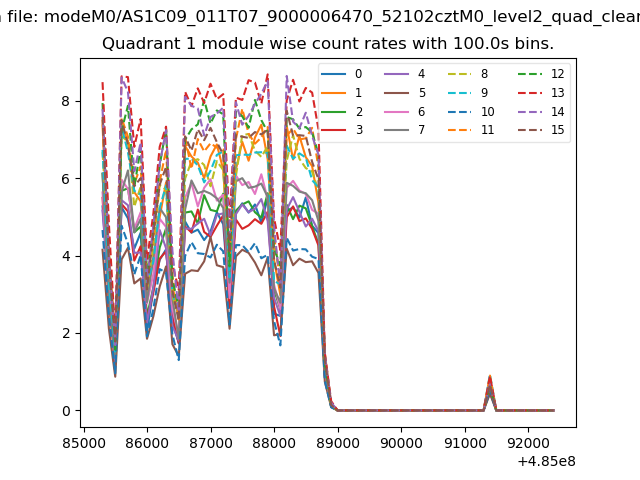
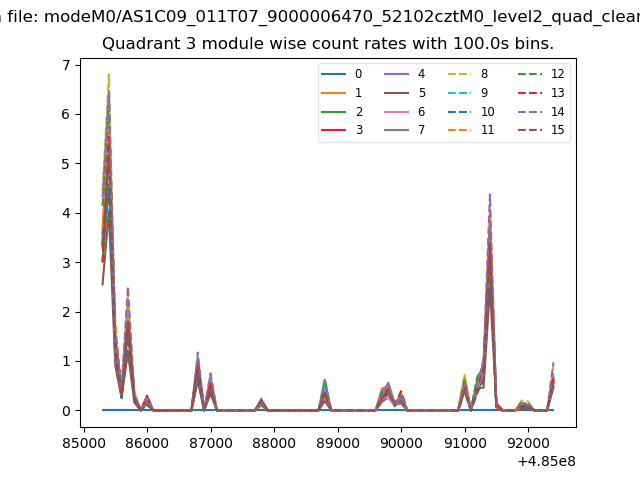
| Module-wise count rates for Quadrant A Data is divided into 100 sec bins |
 |
 |
| Module-wise count rates for Quadrant B Data is divided into 100 sec bins |
 |
 |
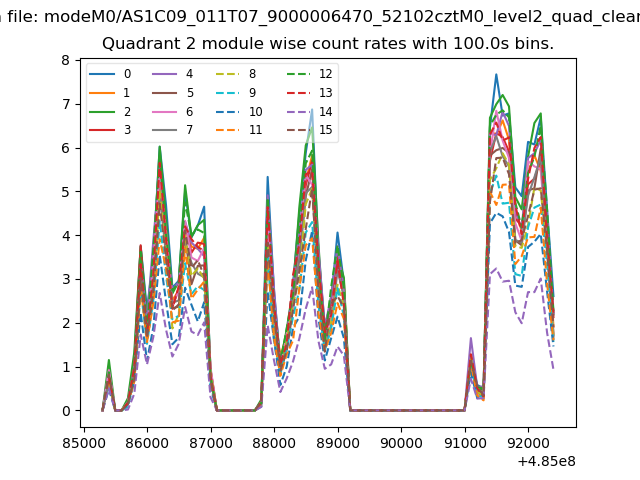
| Module-wise count rates for Quadrant C Data is divided into 100 sec bins |
 |
 |
| Module-wise count rates for Quadrant D Data is divided into 100 sec bins |
 |
 |
| Parameter | Plot |
|---|---|
| CZT HV Monitor | 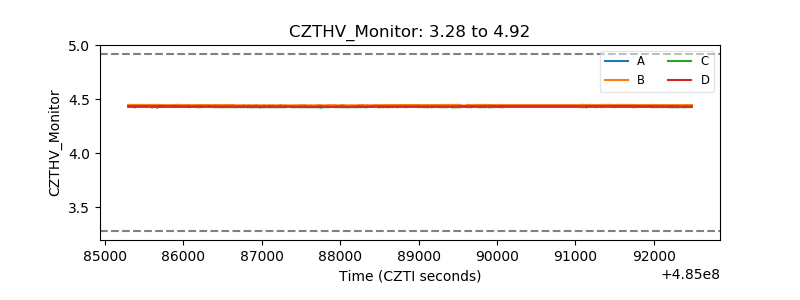 |
| D_VDD | 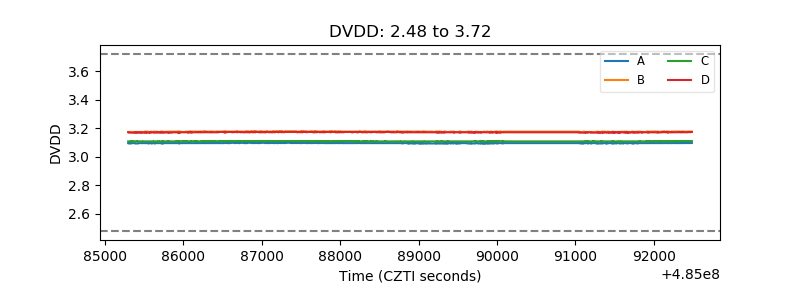 |
| Temperature 1 | 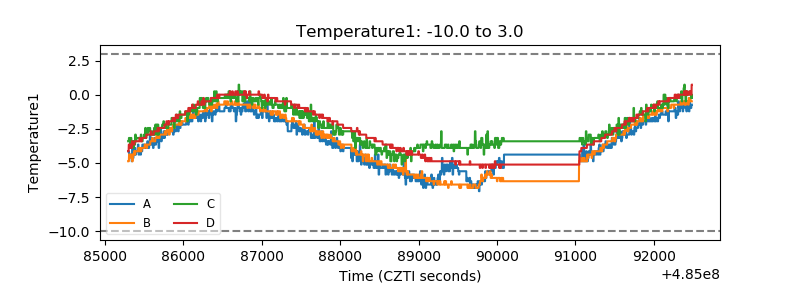 |
| Veto HV Monitor | 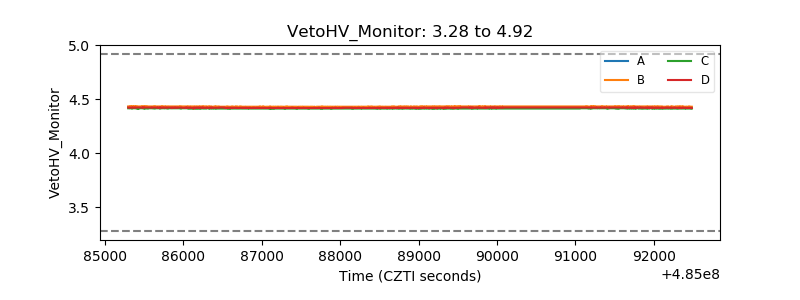 |
| Veto LLD | 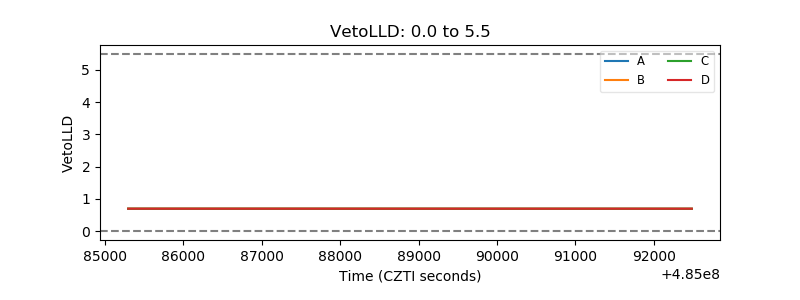 |
| Alpha Counter | 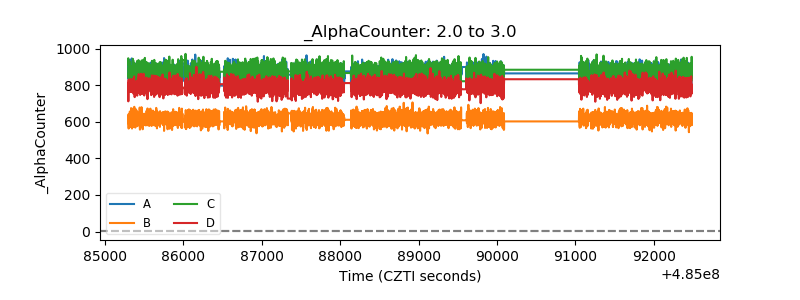 |
| _CPM_Rate | 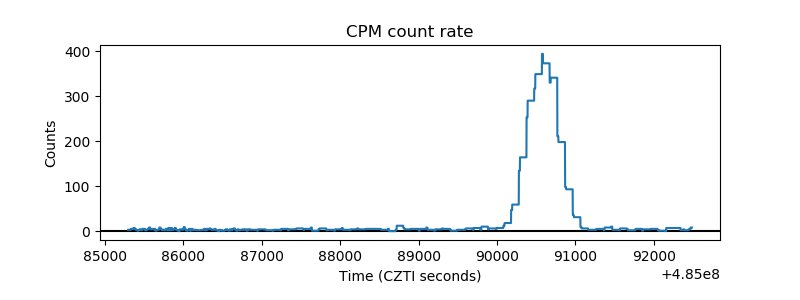 |
| CZT Counter | 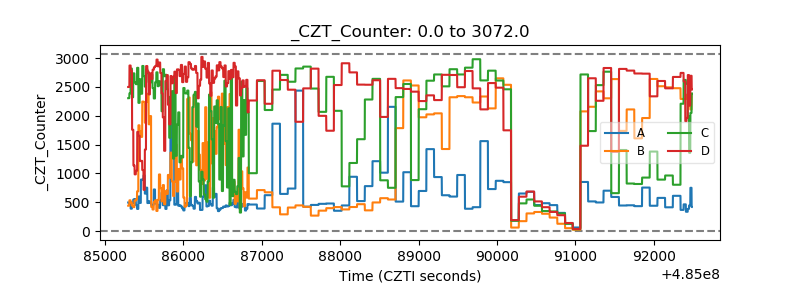 |
| +2.5 Volts monitor |  |
| +5 Volts monitor |  |
| _ROLL_ROT | 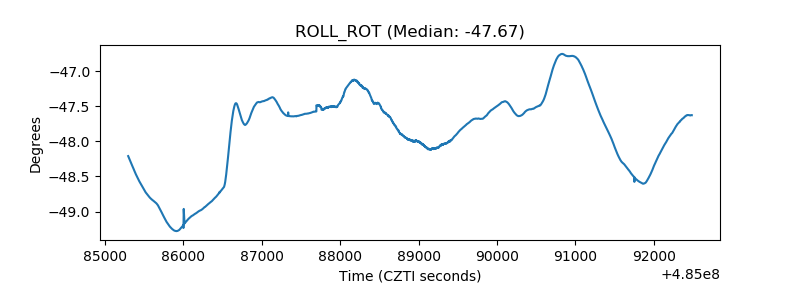 |
| _Roll_DEC | 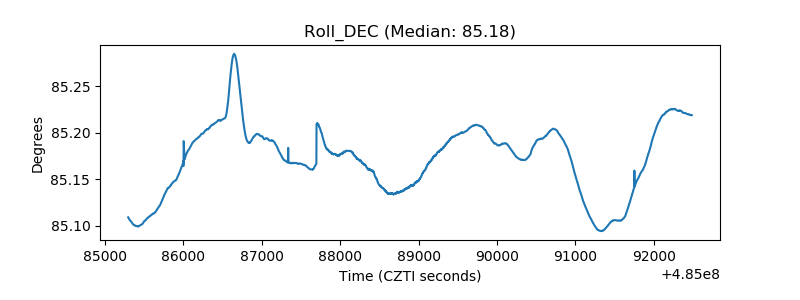 |
| _Roll_RA | 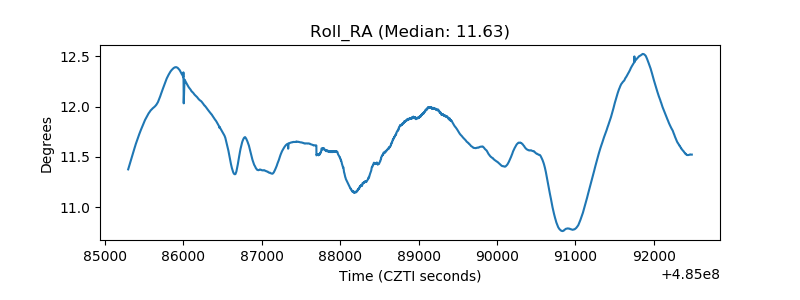 |
| Veto Counter | 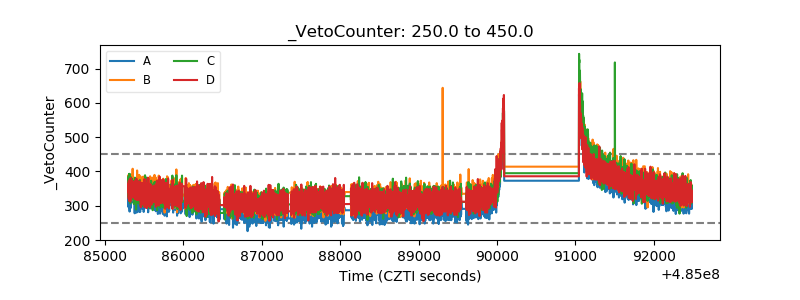 |