| Param | Original file | Final file |
|---|---|---|
| Filename | modeM0/AS1C09_011T07_9000006470_52103cztM0_level2.fits | modeM0/AS1C09_011T07_9000006470_52103cztM0_level2_quad_clean.evt |
| Size (bytes) | 1,195,372,800 | 51,963,840 |
| Size | 1.1 GB | 49.6 MB |
| Events in quadrant A | 3,497,365 | 627,693 |
| Events in quadrant B | 10,850,193 | 179,927 |
| Events in quadrant C | 12,618,073 | 282,525 |
| Events in quadrant D | 16,780,582 | 28,488 |
| Mode SS | |||
|---|---|---|---|
| Quadrant | BADHDUFLAG | Total packets | Discarded packets |
| A | 0 | 132 | 0 |
| B | 0 | 132 | 0 |
| C | 0 | 132 | 0 |
| D | 0 | 132 | 0 |
| Mode M9 | |||
|---|---|---|---|
| Quadrant | BADHDUFLAG | Total packets | Discarded packets |
| A | 0 | 11 | 0 |
| B | 0 | 11 | 0 |
| C | 0 | 11 | 0 |
| D | 0 | 11 | 0 |
| Mode M0 | |||
|---|---|---|---|
| Quadrant | BADHDUFLAG | Total packets | Discarded packets |
| A | 0 | 14739 | 1 |
| B | 0 | 36626 | 1 |
| C | 0 | 41992 | 1 |
| D | 0 | 54333 | 1 |
| Quadrant | Total seconds | Saturated seconds | Saturation percentage |
|---|---|---|---|
| A | 6514 | 91 | 1.396991% |
| B | 6515 | 4943 | 75.871067% |
| C | 6515 | 3725 | 57.175748% |
| D | 6515 | 6291 | 96.561781% |
Noise dominated data is calculated using 1-second bins in cleaned event files. If a bin has >2000 counts, and if more than 50% of those come from <1% of pixels, then it is considered to be noise-dominated and hence unusable.
| Quadrant | # 1 sec bins | Bins with >0 counts | Bins with >2000 counts | High rate bins dominated by noise | Noise dominated (total time) | Noise dominated (detector-on time) | Marked lightcurve |
|---|---|---|---|---|---|---|---|
| A | 7619 | 6515 | 53 | 53 | 0.70% | 0.81% | 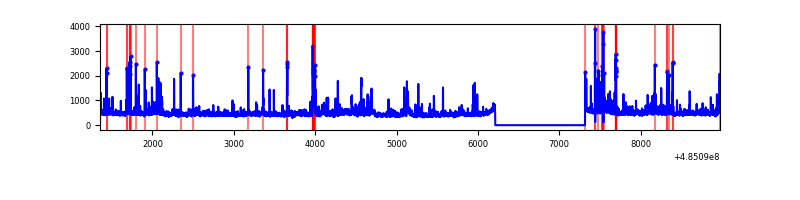 |
| B | 7620 | 6515 | 2408 | 2408 | 31.60% | 36.96% | 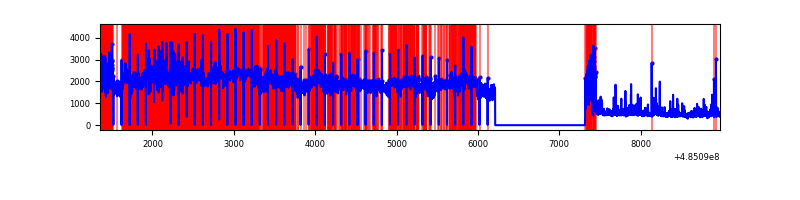 |
| C | 7620 | 6516 | 3208 | 3208 | 42.10% | 49.23% | 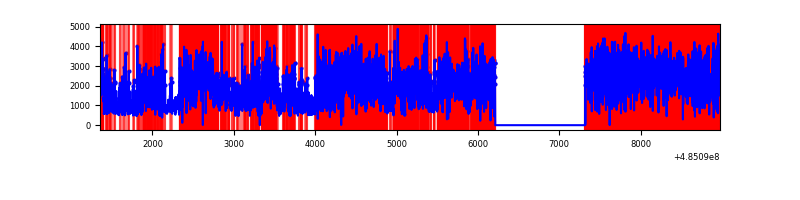 |
| D | 7620 | 6516 | 6023 | 6023 | 79.04% | 92.43% | 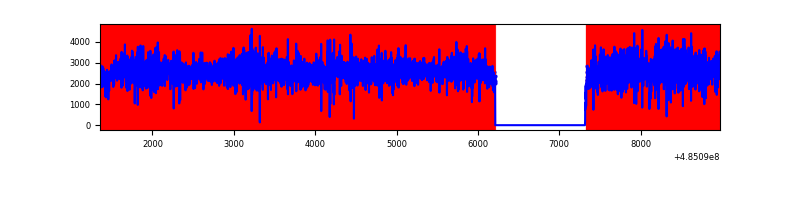 |
Top three noisy pixels from each quadrant. If the there are fewer than three noisy pixels in the level2.evt file, extra rows are filled as -1
| Pixel properties | Quadrant properties | ||||||
|---|---|---|---|---|---|---|---|
| Quadrant | DetID | PixID | Counts | Sigma | Mean | Median | Sigma |
| A | 5 | 240 | 143912 | 821.8 | 696 | 677 | 174.3 |
| A | 4 | 3 | 111872 | 637.97 | 696 | 677 | 174.3 |
| A | 8 | 246 | 78992 | 449.32 | 696 | 677 | 174.3 |
| B | 8 | 3 | 9569094 | 191918.63 | 228 | 221 | 49.9 |
| B | 10 | 44 | 109543 | 2192.62 | 228 | 221 | 49.9 |
| B | 8 | 128 | 35516 | 707.9 | 228 | 221 | 49.9 |
| C | 5 | 80 | 5459710 | 42017.02 | 463 | 458 | 129.9 |
| C | 15 | 224 | 3532814 | 27186.7 | 463 | 458 | 129.9 |
| C | 10 | 171 | 468060 | 3598.89 | 463 | 458 | 129.9 |
| D | 6 | 42 | 12828820 | 129261.92 | 338 | 321 | 99.2 |
| D | 15 | 94 | 1242039 | 12511.74 | 338 | 321 | 99.2 |
| D | 7 | 126 | 393494 | 3961.67 | 338 | 321 | 99.2 |
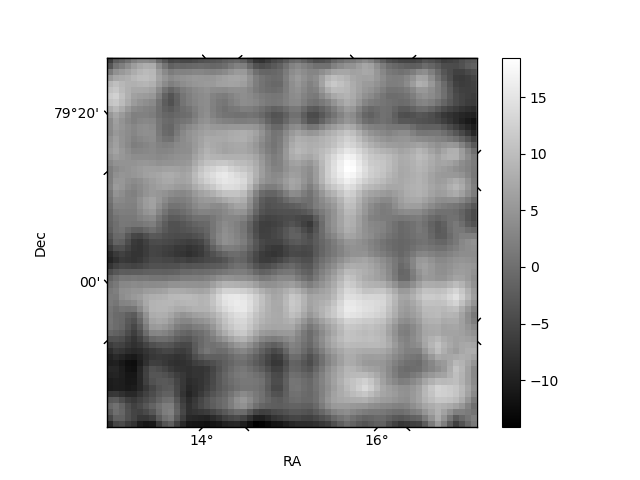
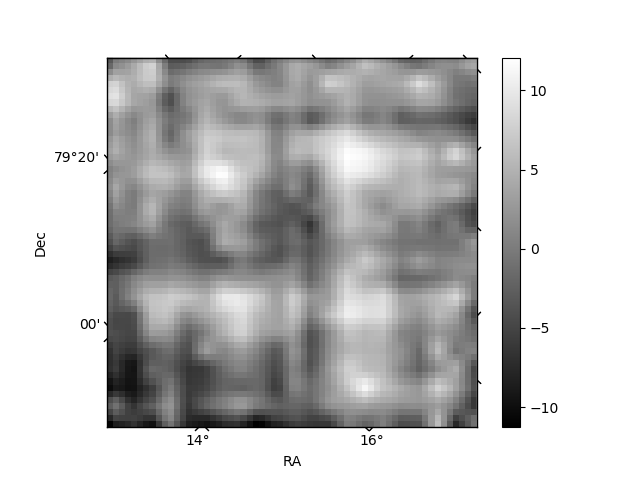
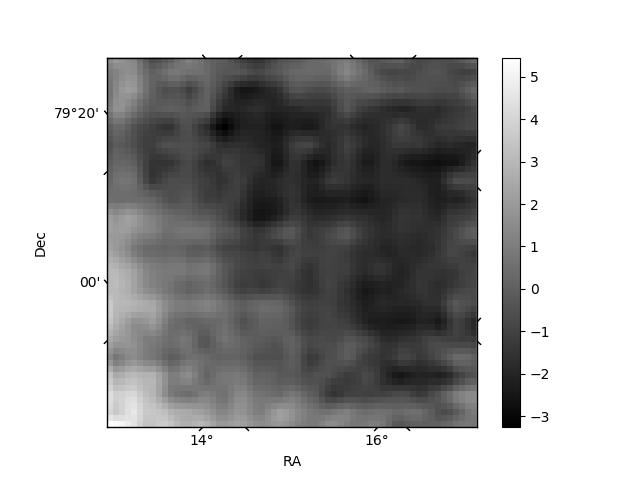
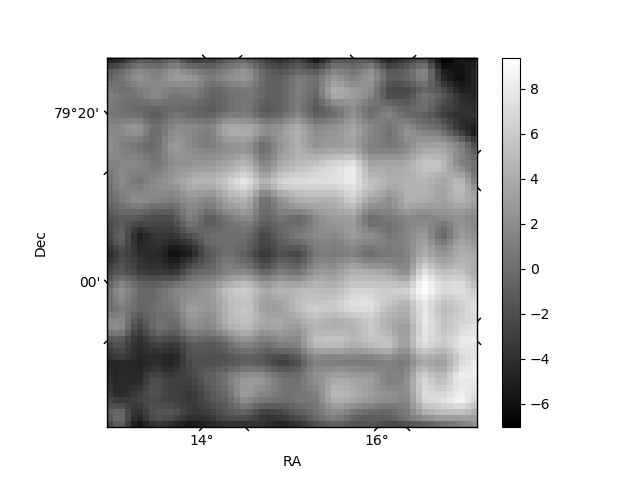
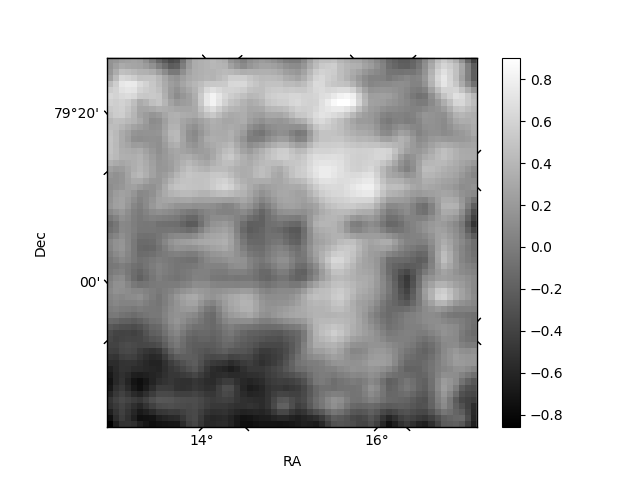
Histogram calculated using DETX and DETY for each event in the final _common_clean file
| Quadrant A | 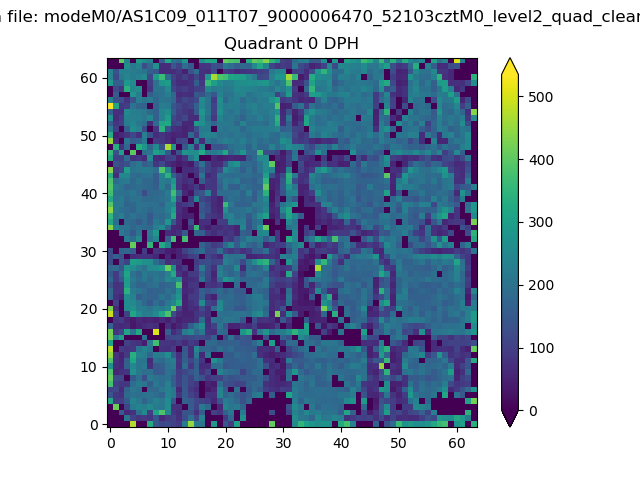 |
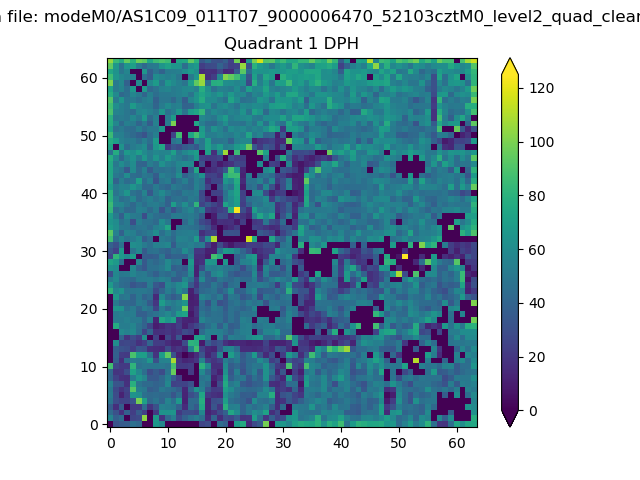 |
Quadrant B |
|---|---|---|---|
| Quadrant D | 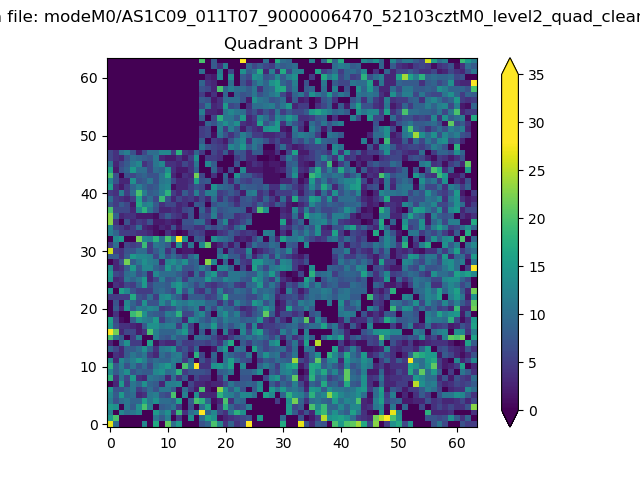 |
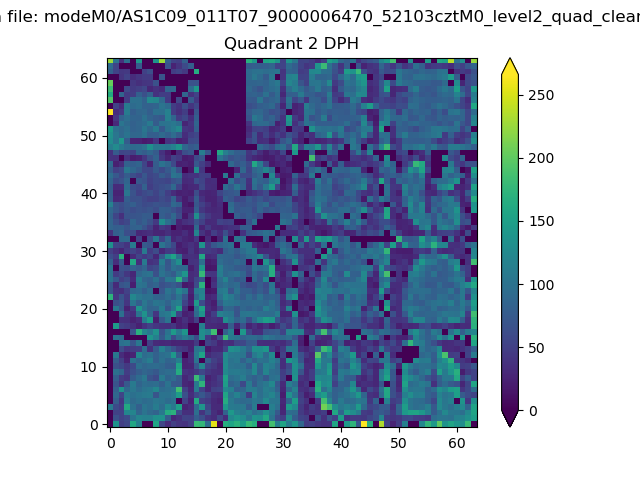 |
Quadrant C |
| Plot type | Count rate plots | Images |
|---|---|---|
| Comparison with Poisson distribution Blue bars denote a histogram of data divided into 1 sec bins. Red curve is a Poisson curve with rate = median count rate of data. |
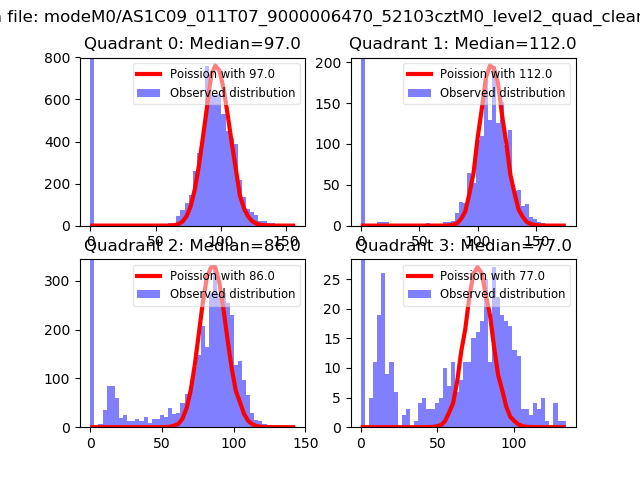 |
 |
| Quadrant-wise count rates Data is divided into 100 sec bins |
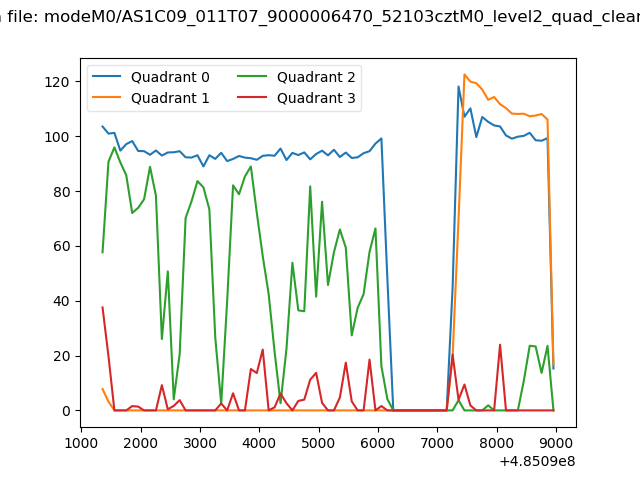 |
|
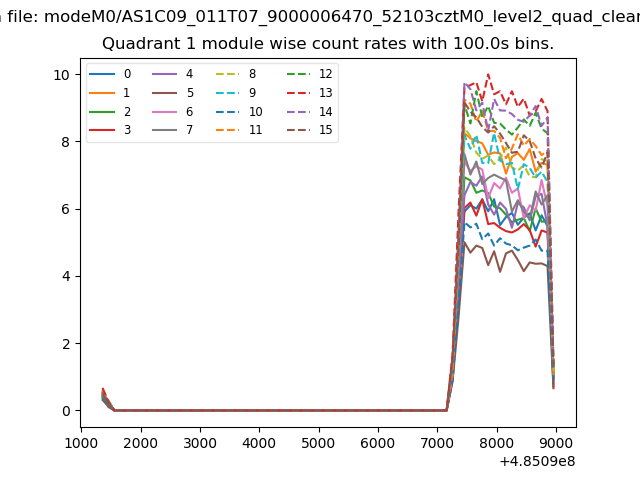
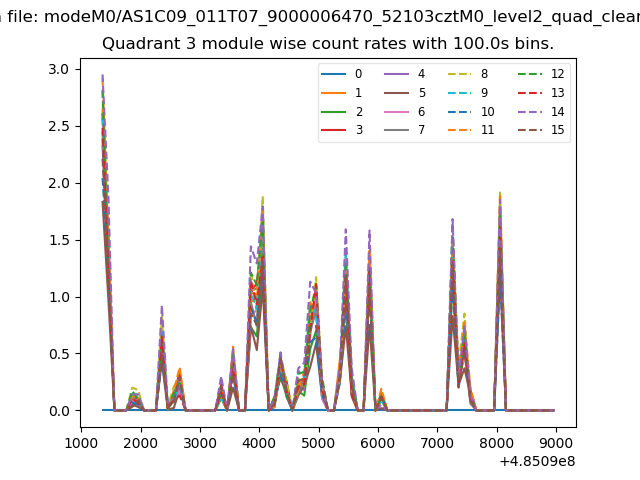
| Module-wise count rates for Quadrant A Data is divided into 100 sec bins |
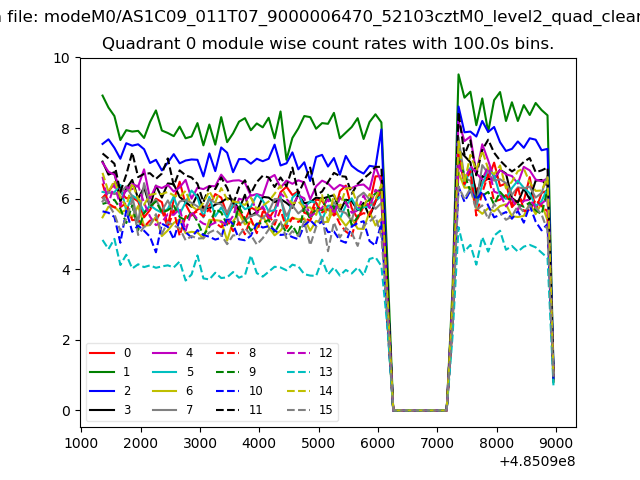 |
 |
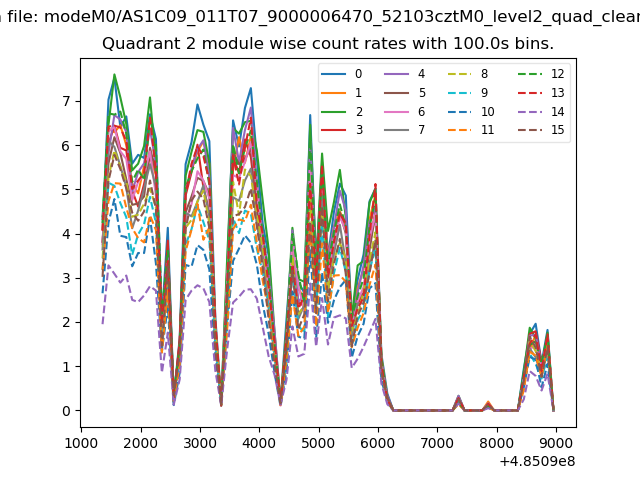
| Module-wise count rates for Quadrant B Data is divided into 100 sec bins |
 |
 |
| Module-wise count rates for Quadrant C Data is divided into 100 sec bins |
 |
 |
| Module-wise count rates for Quadrant D Data is divided into 100 sec bins |
 |
 |
| Parameter | Plot |
|---|---|
| CZT HV Monitor | 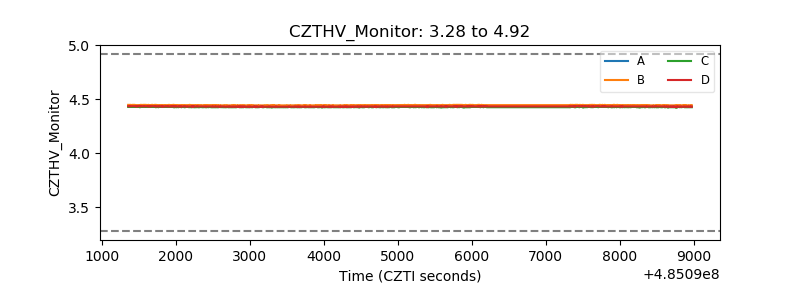 |
| D_VDD | 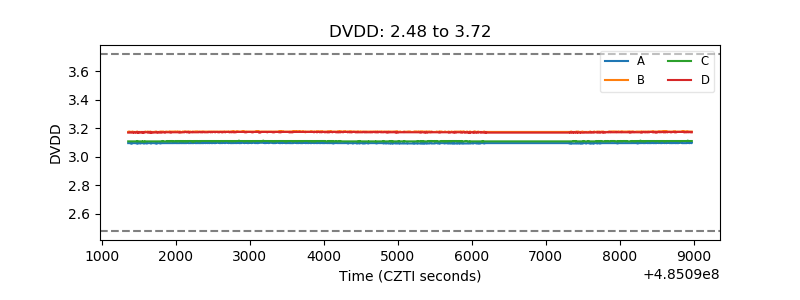 |
| Temperature 1 | 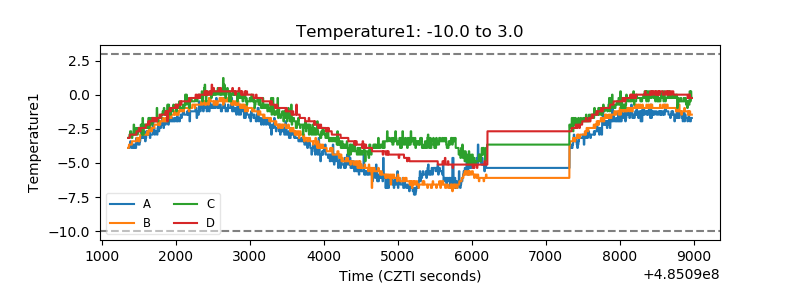 |
| Veto HV Monitor |  |
| Veto LLD | 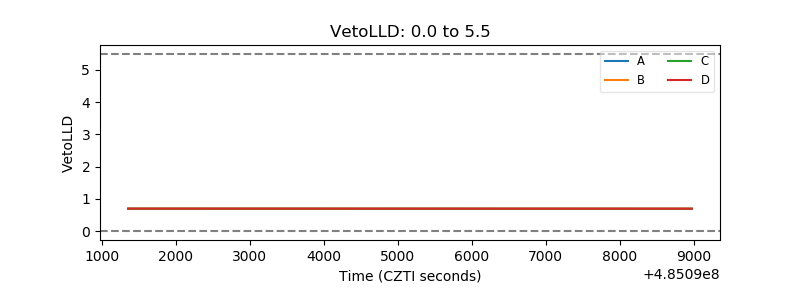 |
| Alpha Counter | 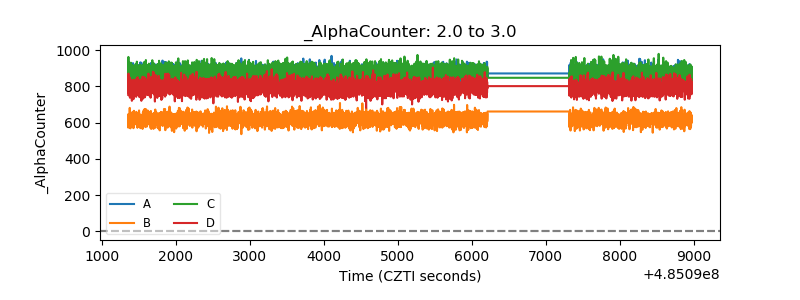 |
| _CPM_Rate | 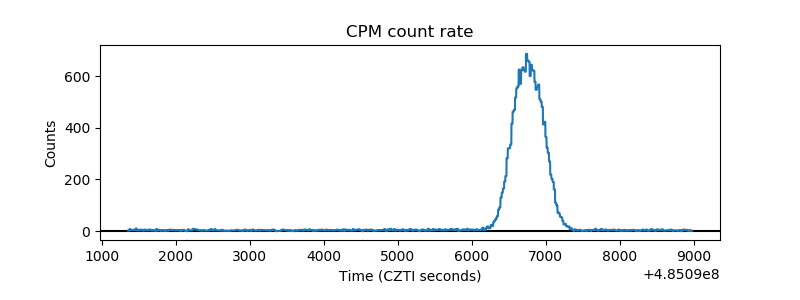 |
| CZT Counter | 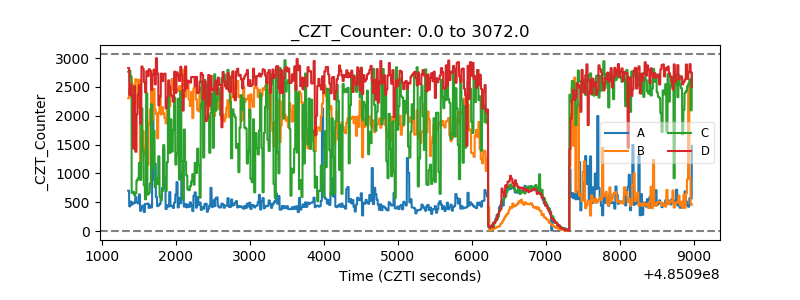 |
| +2.5 Volts monitor | 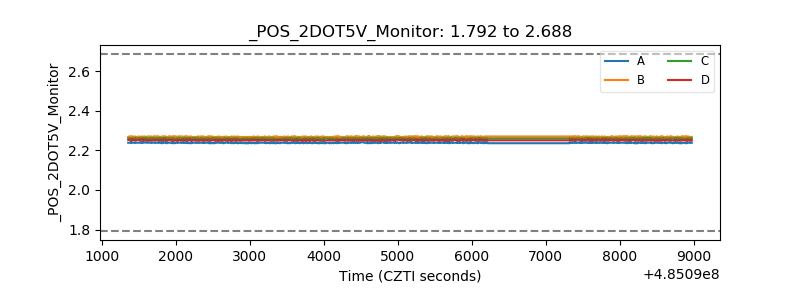 |
| +5 Volts monitor | 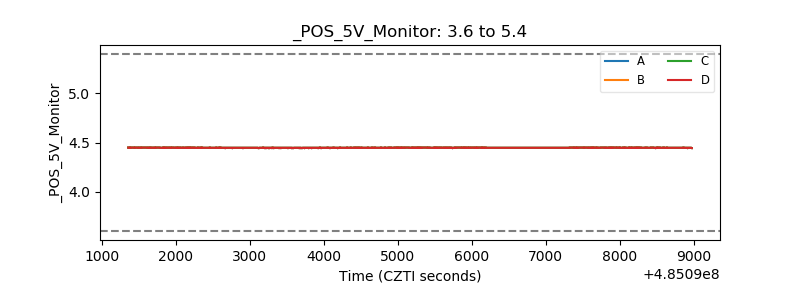 |
| _ROLL_ROT | 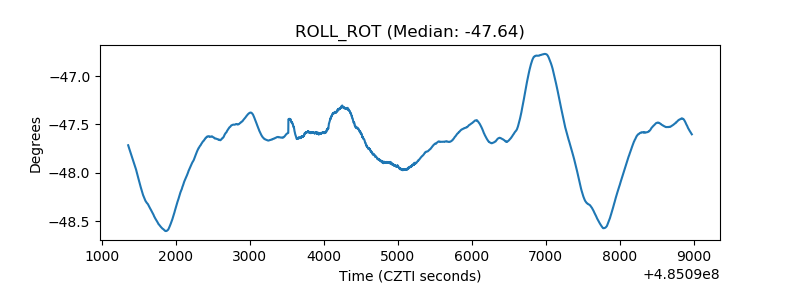 |
| _Roll_DEC | 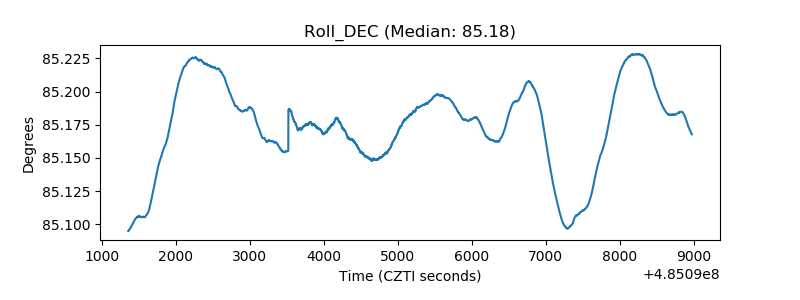 |
| _Roll_RA | 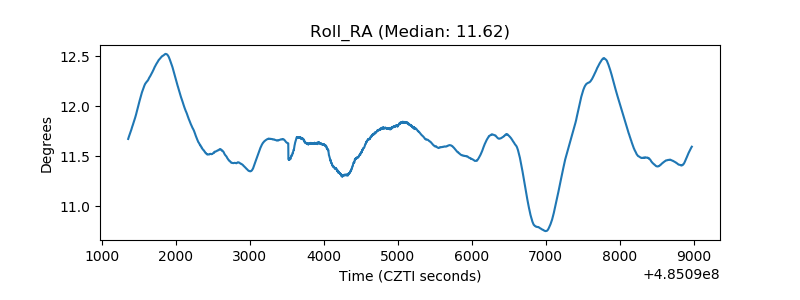 |
| Veto Counter | 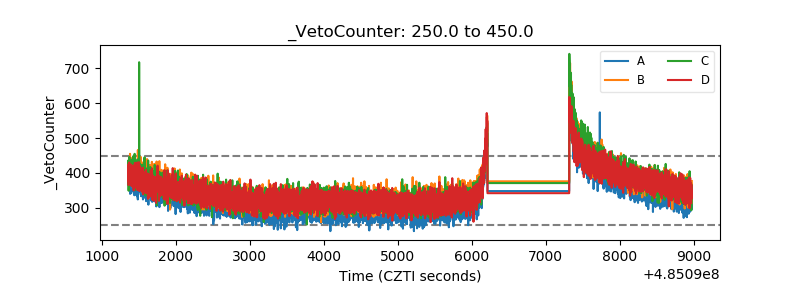 |