| Param | Original file | Final file |
|---|---|---|
| Filename | modeM0/AS1C09_011T08_9000006472cztM0_level2.fits | modeM0/AS1C09_011T08_9000006472cztM0_level2_quad_clean.evt |
| Size (bytes) | 886,135,680 | 490,864,320 |
| Size | 845.1 MB | 468.1 MB |
| Events in quadrant A | 5,757,690 | 2,051,524 |
| Events in quadrant B | 5,334,274 | 2,112,487 |
| Events in quadrant C | 4,634,740 | 1,433,401 |
| Events in quadrant D | 2,622,356 | 838,198 |
| Mode M0 | |||
|---|---|---|---|
| Quadrant | BADHDUFLAG | Total packets | Discarded packets |
| A | 0 | 342089 | 0 |
| B | 0 | 407588 | 0 |
| C | 0 | 578592 | 0 |
| D | 0 | 769228 | 0 |
| Mode M9 | |||
|---|---|---|---|
| Quadrant | BADHDUFLAG | Total packets | Discarded packets |
| A | 0 | 135 | 0 |
| B | 0 | 135 | 0 |
| C | 0 | 135 | 0 |
| D | 0 | 135 | 0 |
| Mode SS | |||
|---|---|---|---|
| Quadrant | BADHDUFLAG | Total packets | Discarded packets |
| A | 0 | 2500 | 0 |
| B | 0 | 2500 | 0 |
| C | 0 | 2502 | 0 |
| D | 0 | 2499 | 0 |
| Quadrant | Total seconds | Saturated seconds | Saturation percentage |
|---|---|---|---|
| A | 122894 | 5877 | 4.782170% |
| B | 122812 | 13248 | 10.787219% |
| C | 122885 | 39062 | 31.787444% |
| D | 122807 | 79449 | 64.694195% |
Noise dominated data is calculated using 1-second bins in cleaned event files. If a bin has >2000 counts, and if more than 50% of those come from <1% of pixels, then it is considered to be noise-dominated and hence unusable.
| Quadrant | # 1 sec bins | Bins with >0 counts | Bins with >2000 counts | High rate bins dominated by noise | Noise dominated (total time) | Noise dominated (detector-on time) | Marked lightcurve |
|---|---|---|---|---|---|---|---|
| A | 456466 | 122774 | 0 | 0 | 0.00% | 0.00% | 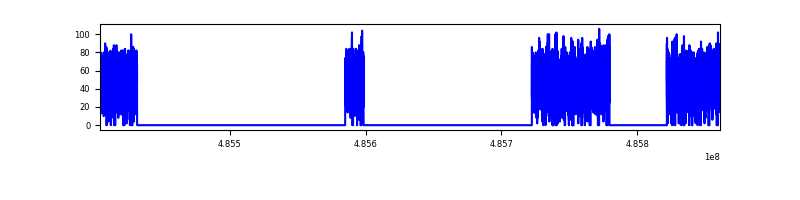 |
| B | 456464 | 122615 | 0 | 0 | 0.00% | 0.00% |  |
| C | 456465 | 120764 | 0 | 0 | 0.00% | 0.00% | 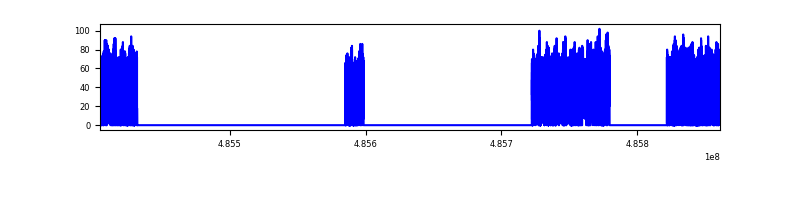 |
| D | 456465 | 104517 | 0 | 0 | 0.00% | 0.00% | 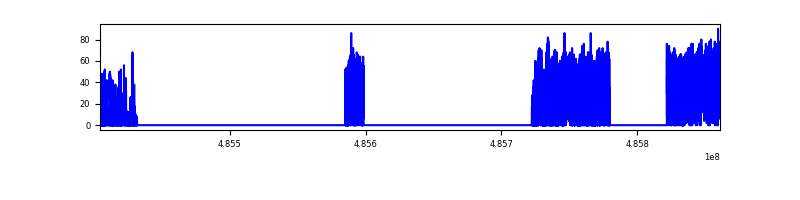 |
Top three noisy pixels from each quadrant. If the there are fewer than three noisy pixels in the level2.evt file, extra rows are filled as -1
| Pixel properties | Quadrant properties | ||||||
|---|---|---|---|---|---|---|---|
| Quadrant | DetID | PixID | Counts | Sigma | Mean | Median | Sigma |
| A | 14 | 188 | 6446 | 9.97 | 1530 | 1419 | 504.1 |
| A | 9 | 255 | 6054 | 9.19 | 1530 | 1419 | 504.1 |
| A | 14 | 204 | 5264 | 7.63 | 1530 | 1419 | 504.1 |
| B | 2 | 9 | 6033 | 14.23 | 1416 | 1342 | 329.6 |
| B | 2 | 8 | 5628 | 13.0 | 1416 | 1342 | 329.6 |
| B | 9 | 173 | 4504 | 9.59 | 1416 | 1342 | 329.6 |
| C | 2 | 31 | 3882 | 6.47 | 1248 | 1139 | 423.8 |
| C | 3 | 202 | 3643 | 5.91 | 1248 | 1139 | 423.8 |
| C | 7 | 221 | 3642 | 5.91 | 1248 | 1139 | 423.8 |
| D | 6 | 218 | 3351 | 10.58 | 754 | 671 | 253.2 |
| D | 15 | 11 | 2557 | 7.45 | 754 | 671 | 253.2 |
| D | 3 | 30 | 2469 | 7.1 | 754 | 671 | 253.2 |
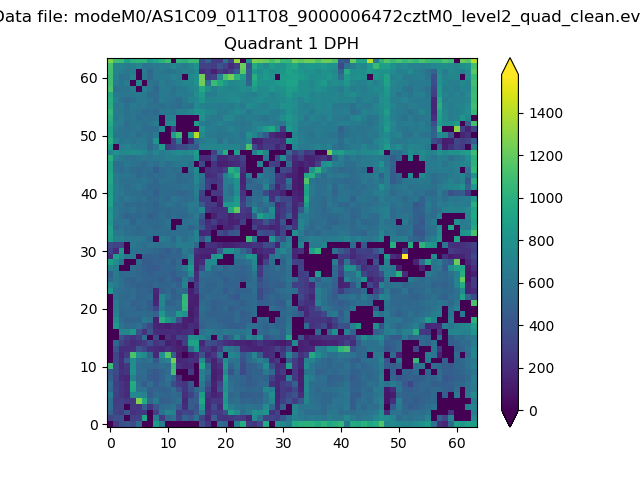
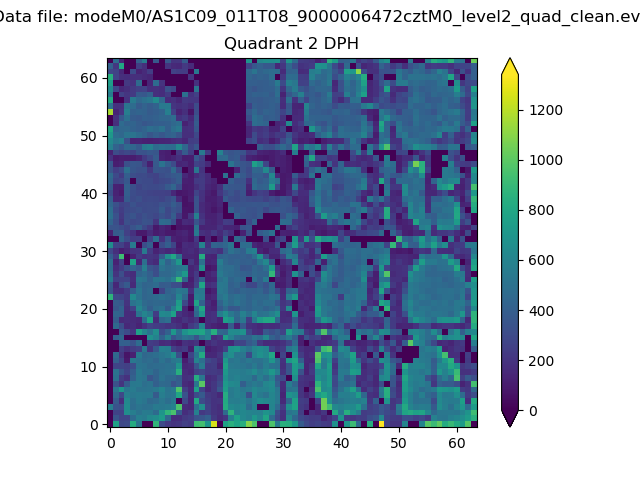
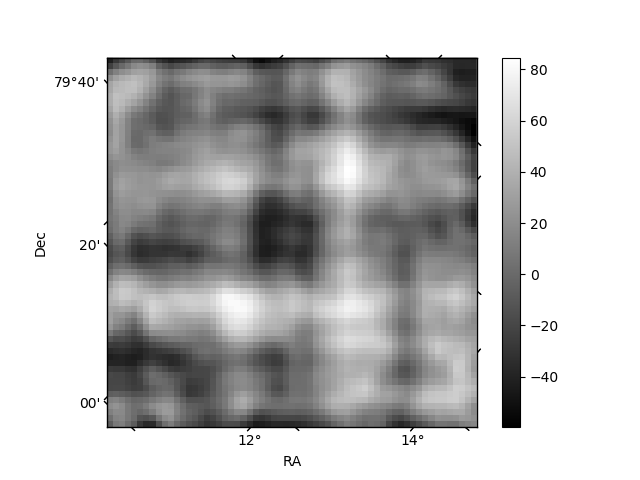
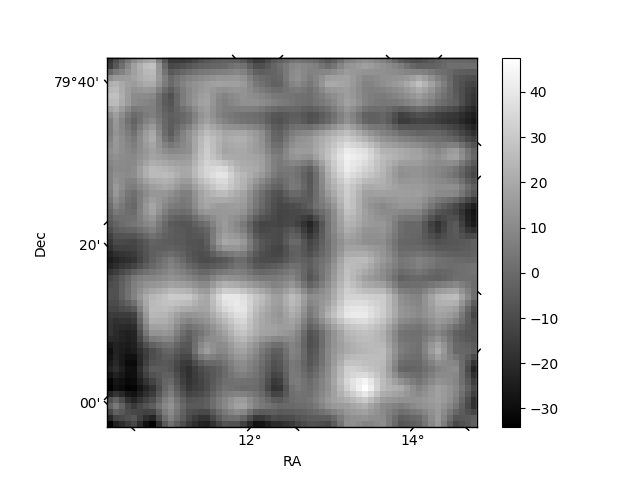
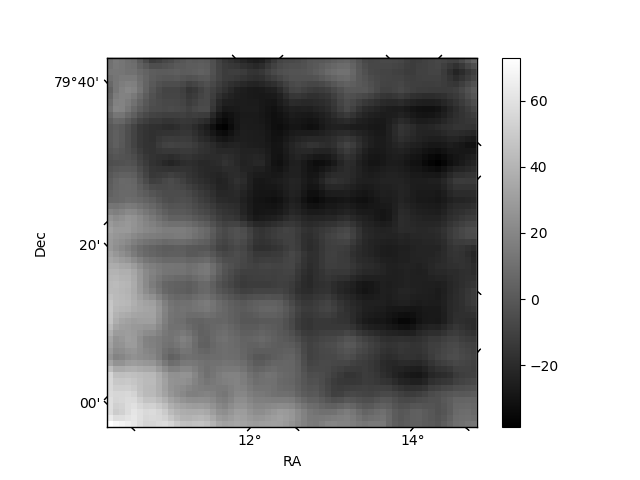
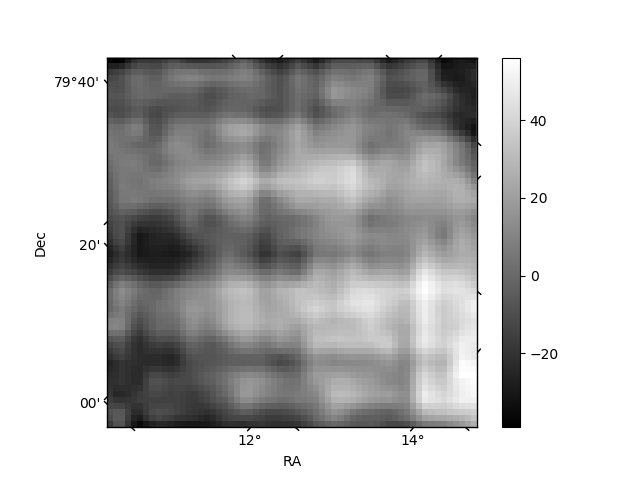
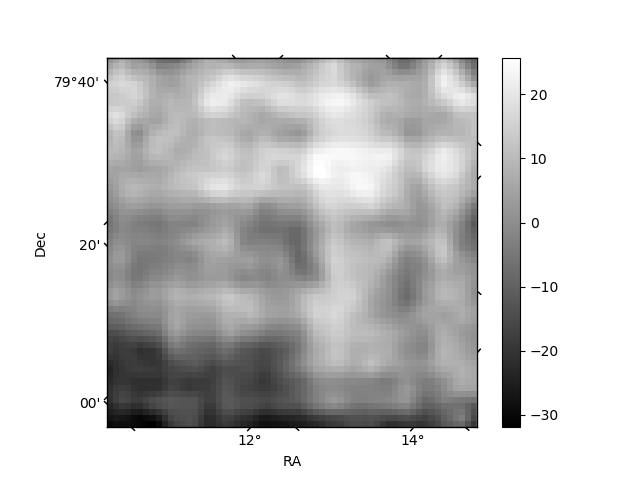
Histogram calculated using DETX and DETY for each event in the final _common_clean file
| Quadrant A | 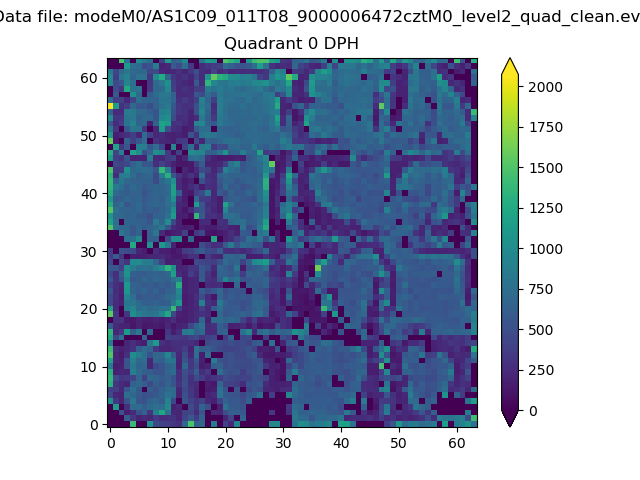 |
 |
Quadrant B |
|---|---|---|---|
| Quadrant D | 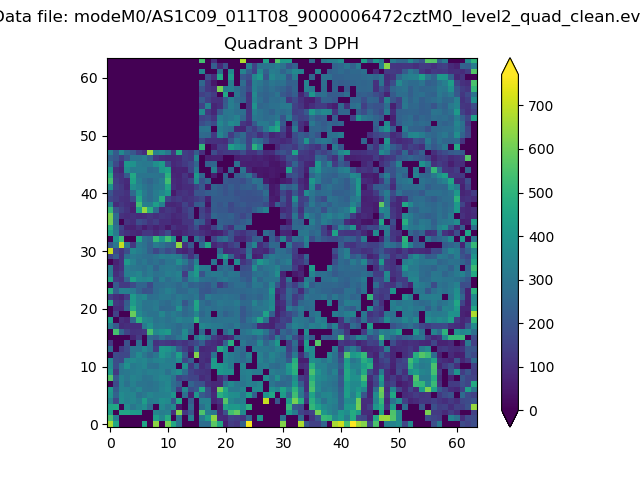 |
 |
Quadrant C |
| Plot type | Count rate plots | Images |
|---|---|---|
| Comparison with Poisson distribution Blue bars denote a histogram of data divided into 1 sec bins. Red curve is a Poisson curve with rate = median count rate of data. |
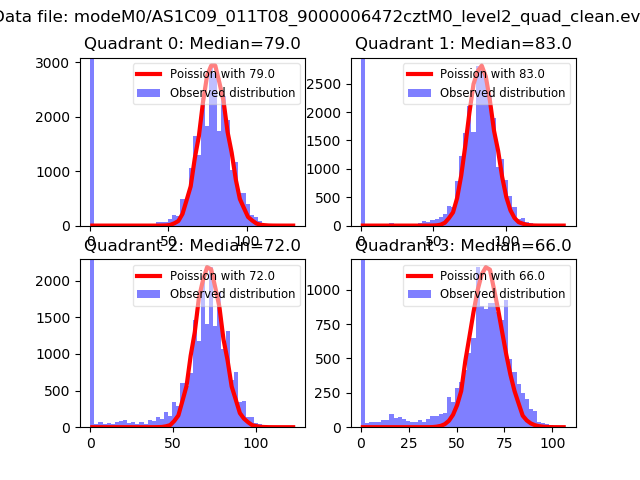 |
 |
| Quadrant-wise count rates Data is divided into 100 sec bins |
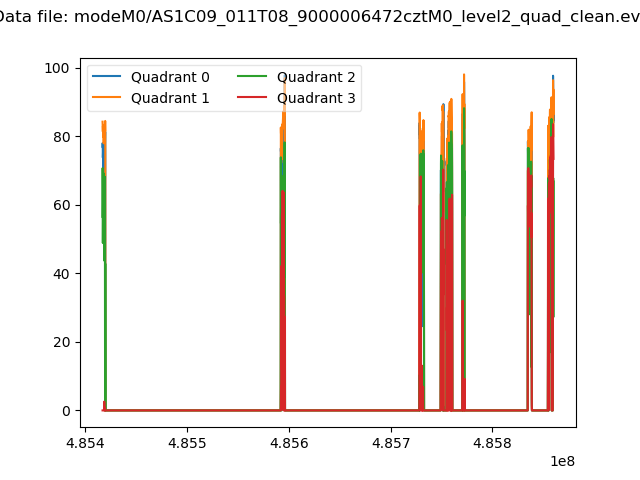 |
|
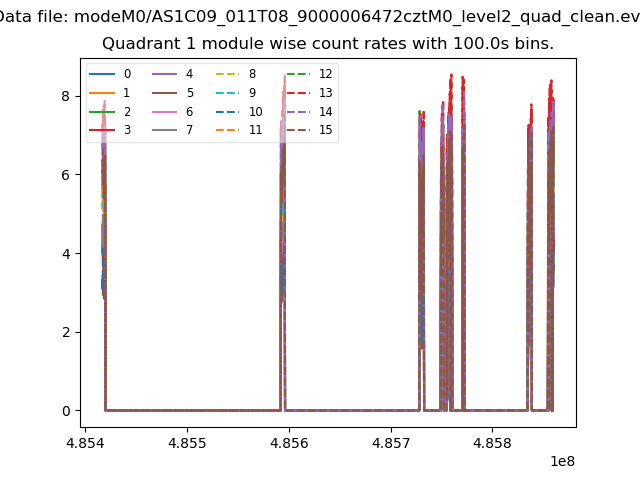
| Module-wise count rates for Quadrant A Data is divided into 100 sec bins |
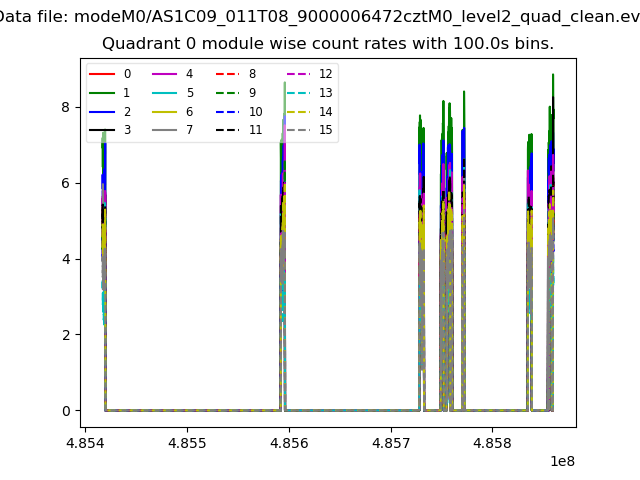 |
 |
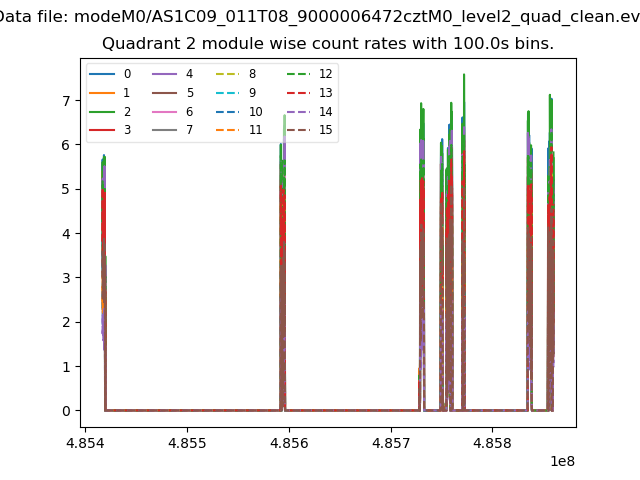
| Module-wise count rates for Quadrant B Data is divided into 100 sec bins |
 |
 |
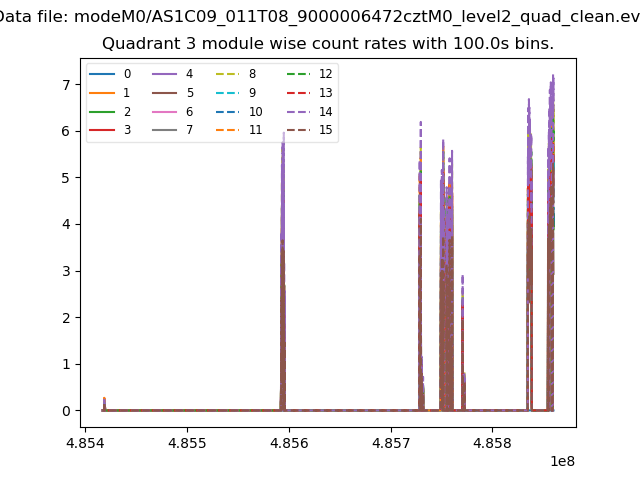
| Module-wise count rates for Quadrant C Data is divided into 100 sec bins |
 |
 |
| Module-wise count rates for Quadrant D Data is divided into 100 sec bins |
 |
 |
| Parameter | Plot |
|---|---|
| CZT HV Monitor | 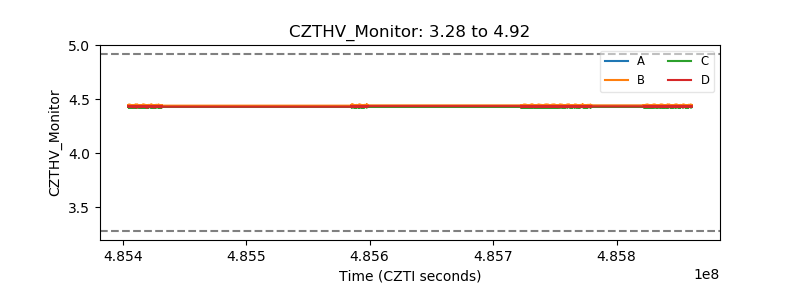 |
| D_VDD | 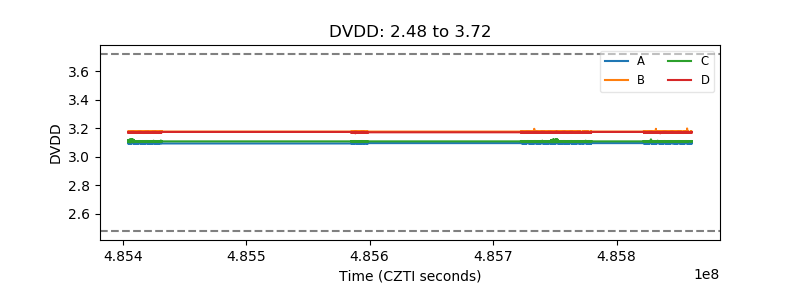 |
| Temperature 1 | 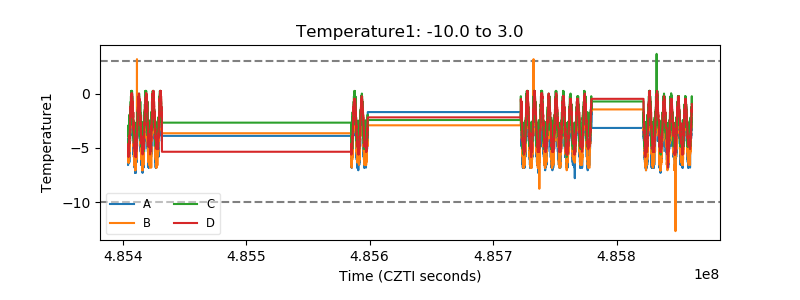 |
| Veto HV Monitor | 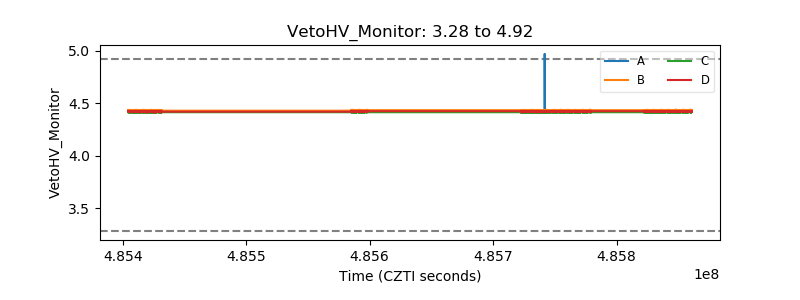 |
| Veto LLD | 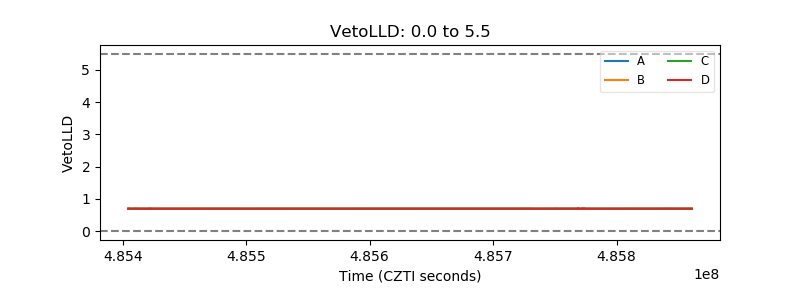 |
| Alpha Counter | 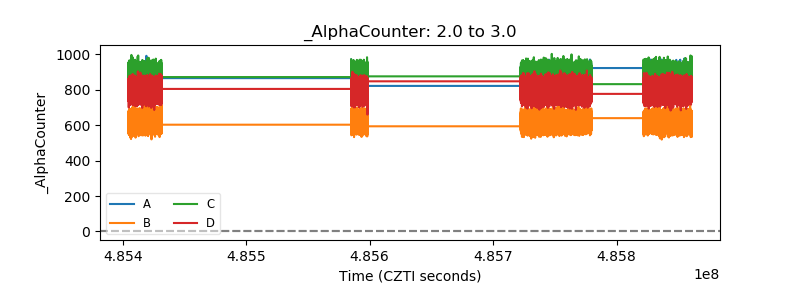 |
| _CPM_Rate | 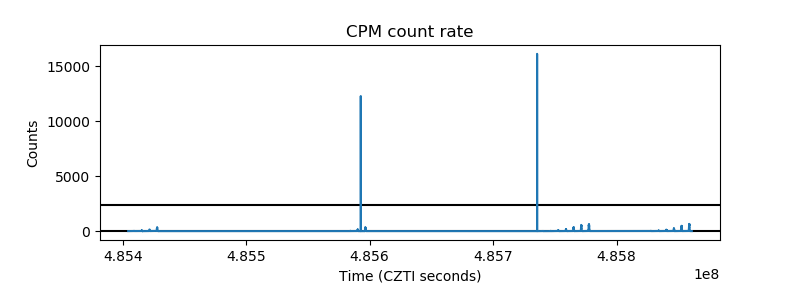 |
| CZT Counter | 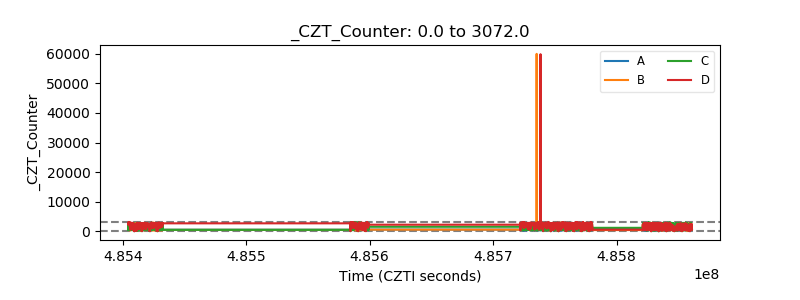 |
| +2.5 Volts monitor | 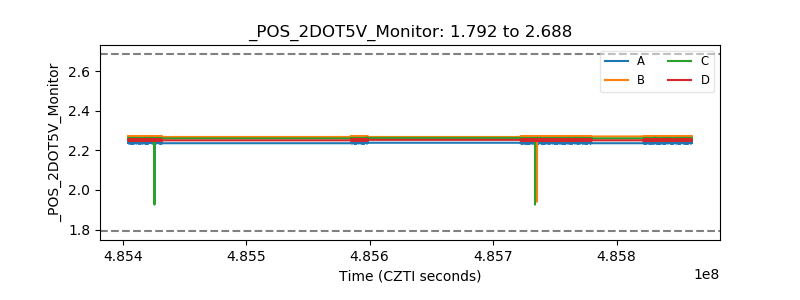 |
| +5 Volts monitor | 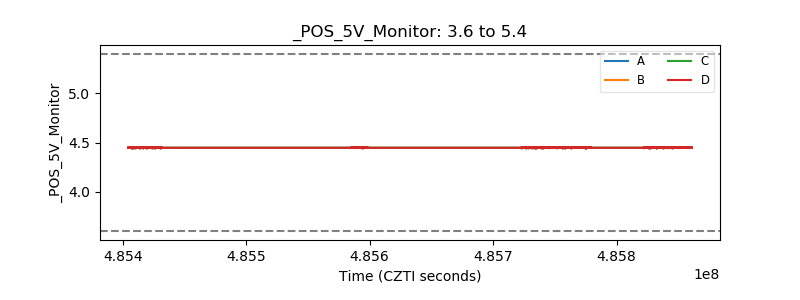 |
| _ROLL_ROT | 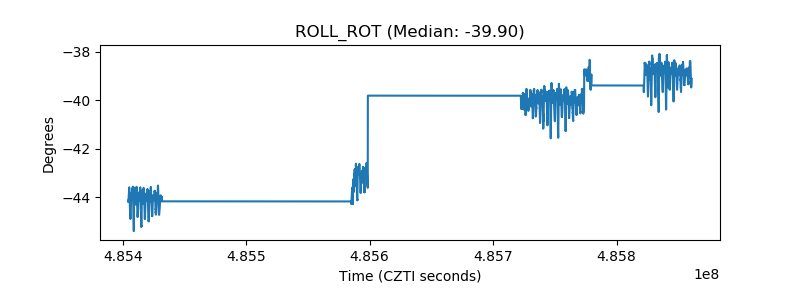 |
| _Roll_DEC | 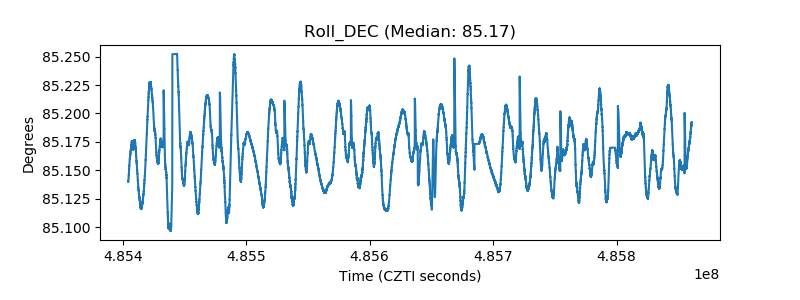 |
| _Roll_RA | 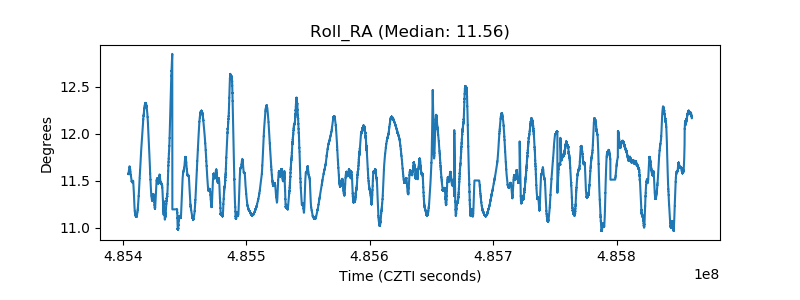 |
| Veto Counter | 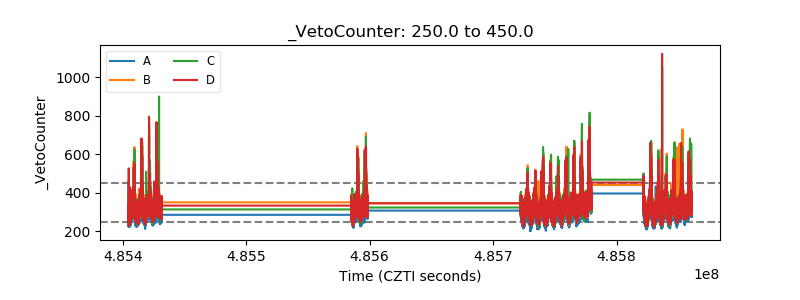 |