| Param | Original file | Final file |
|---|---|---|
| Filename | modeM0/AS1C09_011T08_9000006472_52234cztM0_level2.fits | modeM0/AS1C09_011T08_9000006472_52234cztM0_level2_quad_clean.evt |
| Size (bytes) | 1,566,878,400 | 207,120,960 |
| Size | 1.5 GB | 197.5 MB |
| Events in quadrant A | 10,733,051 | 1,405,886 |
| Events in quadrant B | 11,903,714 | 1,512,340 |
| Events in quadrant C | 21,254,342 | 991,713 |
| Events in quadrant D | 12,887,730 | 1,267,182 |
| Mode M0 | |||
|---|---|---|---|
| Quadrant | BADHDUFLAG | Total packets | Discarded packets |
| A | 0 | 43111 | 3 |
| B | 0 | 46297 | 11 |
| C | 0 | 74090 | 3 |
| D | 0 | 49315 | 3 |
| Mode M9 | |||
|---|---|---|---|
| Quadrant | BADHDUFLAG | Total packets | Discarded packets |
| A | 0 | 29 | 0 |
| B | 0 | 29 | 0 |
| C | 0 | 29 | 0 |
| D | 0 | 29 | 0 |
| Mode SS | |||
|---|---|---|---|
| Quadrant | BADHDUFLAG | Total packets | Discarded packets |
| A | 0 | 324 | 0 |
| B | 0 | 324 | 0 |
| C | 0 | 324 | 0 |
| D | 0 | 324 | 0 |
| Quadrant | Total seconds | Saturated seconds | Saturation percentage |
|---|---|---|---|
| A | 15839 | 791 | 4.994002% |
| B | 15838 | 948 | 5.985604% |
| C | 15839 | 4943 | 31.207778% |
| D | 15839 | 881 | 5.562220% |
Noise dominated data is calculated using 1-second bins in cleaned event files. If a bin has >2000 counts, and if more than 50% of those come from <1% of pixels, then it is considered to be noise-dominated and hence unusable.
| Quadrant | # 1 sec bins | Bins with >0 counts | Bins with >2000 counts | High rate bins dominated by noise | Noise dominated (total time) | Noise dominated (detector-on time) | Marked lightcurve |
|---|---|---|---|---|---|---|---|
| A | 18764 | 15840 | 682 | 682 | 3.63% | 4.31% | 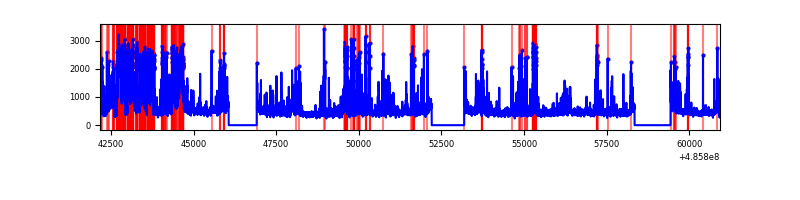 |
| B | 18764 | 15839 | 630 | 630 | 3.36% | 3.98% | 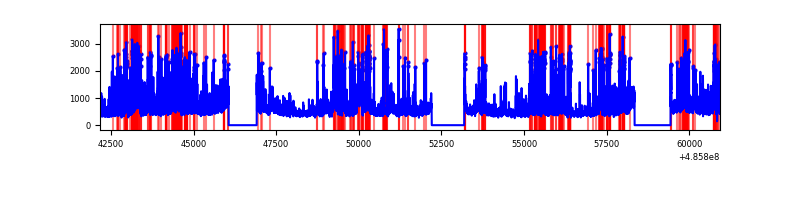 |
| C | 18764 | 15841 | 4600 | 4600 | 24.52% | 29.04% | 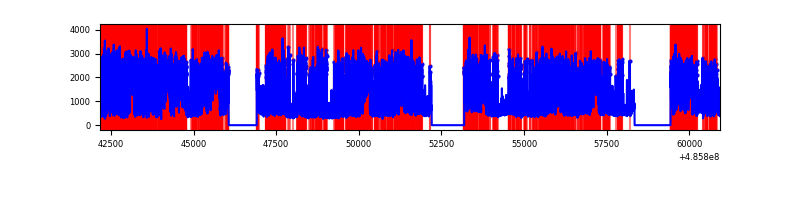 |
| D | 18764 | 15841 | 863 | 863 | 4.60% | 5.45% | 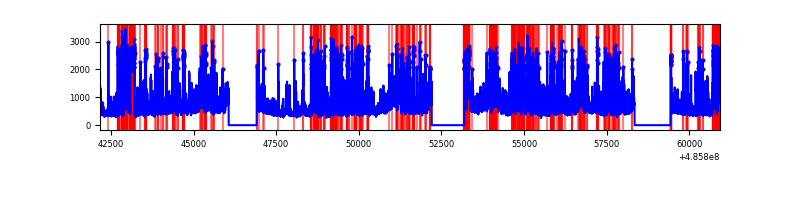 |
Top three noisy pixels from each quadrant. If the there are fewer than three noisy pixels in the level2.evt file, extra rows are filled as -1
| Pixel properties | Quadrant properties | ||||||
|---|---|---|---|---|---|---|---|
| Quadrant | DetID | PixID | Counts | Sigma | Mean | Median | Sigma |
| A | 4 | 249 | 969203 | 2395.12 | 1633 | 1595 | 404.0 |
| A | 12 | 3 | 921304 | 2276.55 | 1633 | 1595 | 404.0 |
| A | 3 | 22 | 779842 | 1926.39 | 1633 | 1595 | 404.0 |
| B | 5 | 32 | 2570420 | 7601.69 | 1597 | 1546 | 337.9 |
| B | 10 | 254 | 750775 | 2217.08 | 1597 | 1546 | 337.9 |
| B | 0 | 213 | 469893 | 1385.91 | 1597 | 1546 | 337.9 |
| C | 15 | 224 | 11479787 | 30938.73 | 1347 | 1336 | 371.0 |
| C | 9 | 38 | 1404259 | 3781.4 | 1347 | 1336 | 371.0 |
| C | 15 | 231 | 1030584 | 2774.21 | 1347 | 1336 | 371.0 |
| D | 12 | 2 | 1523472 | 3427.76 | 1561 | 1493 | 444.0 |
| D | 12 | 17 | 1407304 | 3166.13 | 1561 | 1493 | 444.0 |
| D | 8 | 176 | 1270217 | 2857.39 | 1561 | 1493 | 444.0 |
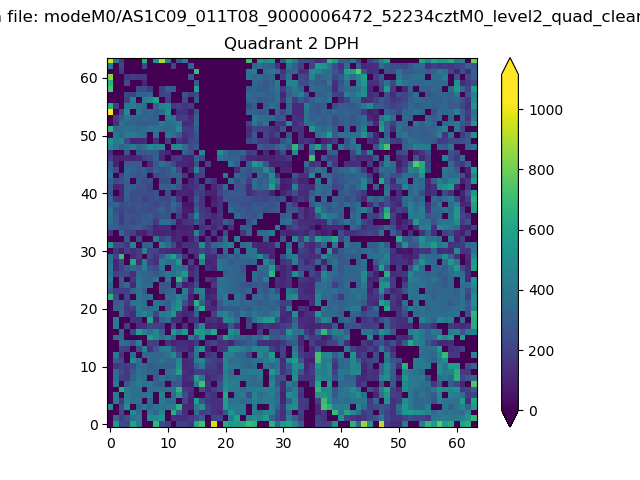
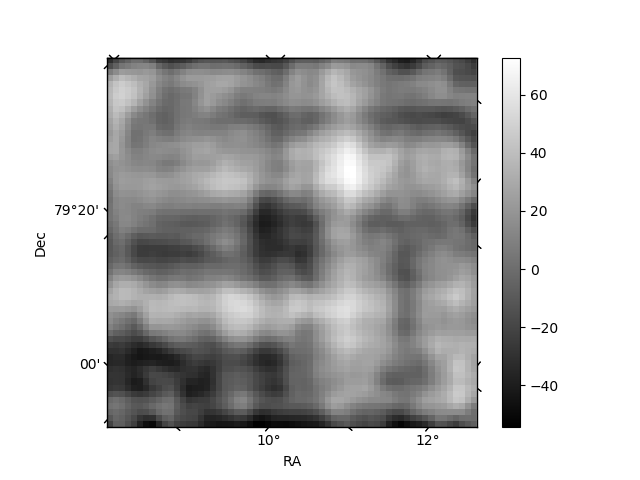
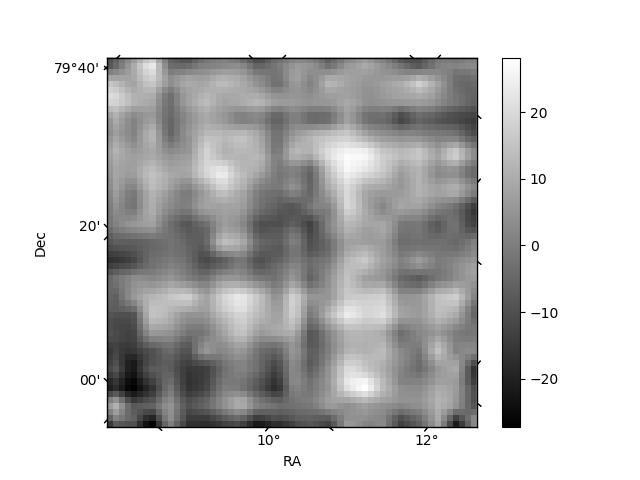
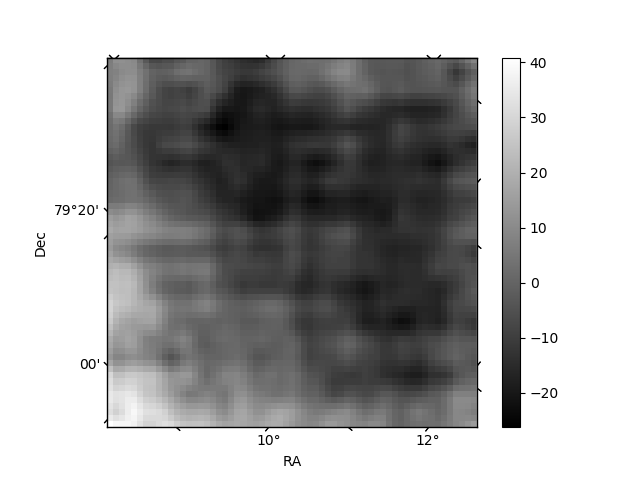
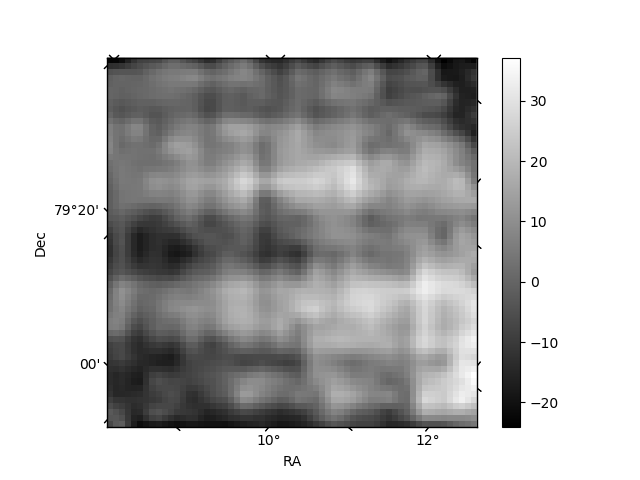
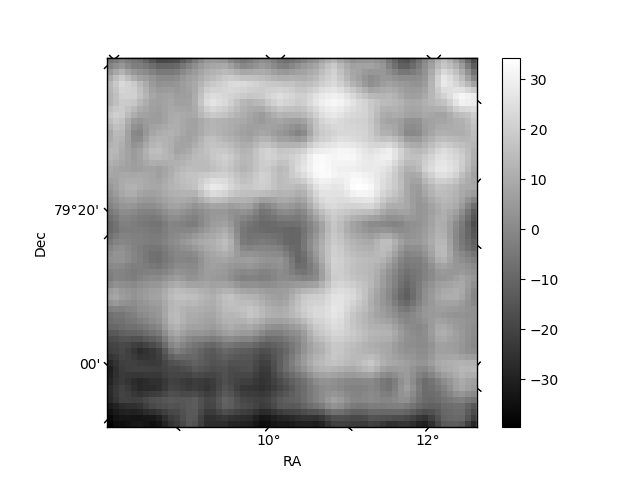
Histogram calculated using DETX and DETY for each event in the final _common_clean file
| Quadrant A | 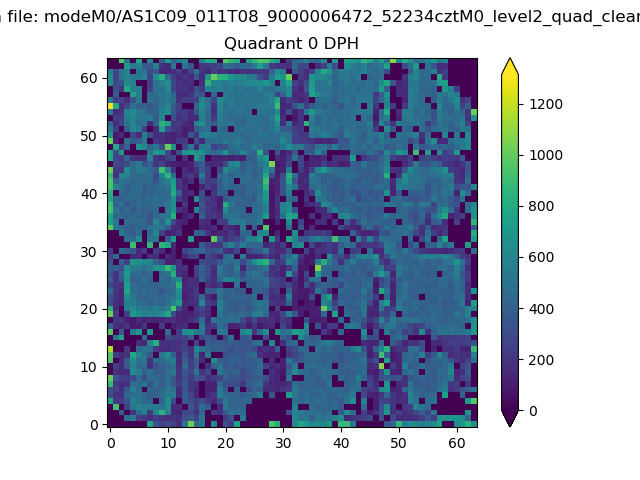 |
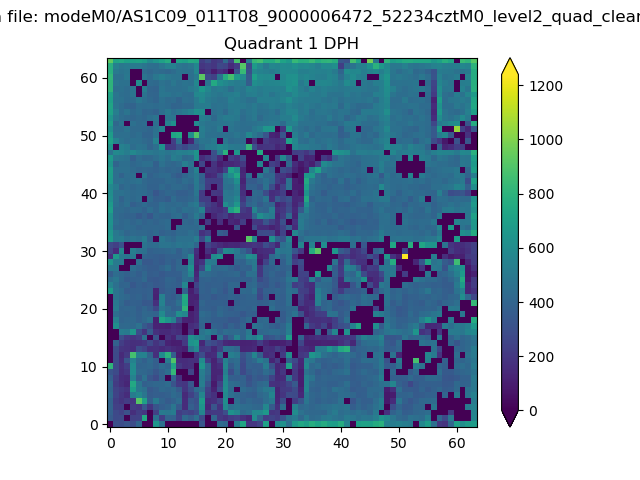 |
Quadrant B |
|---|---|---|---|
| Quadrant D | 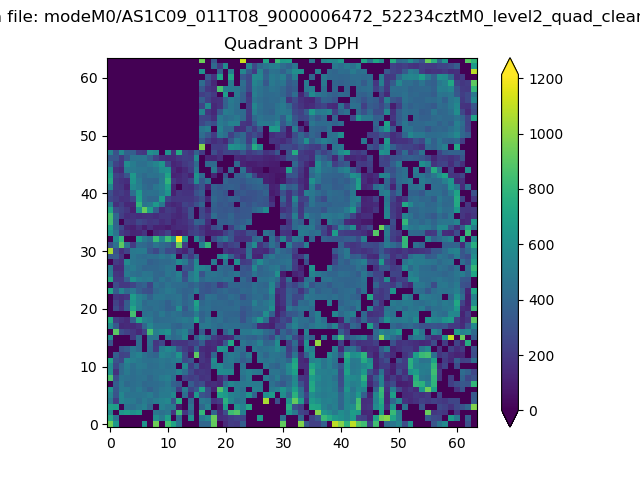 |
 |
Quadrant C |
| Plot type | Count rate plots | Images |
|---|---|---|
| Comparison with Poisson distribution Blue bars denote a histogram of data divided into 1 sec bins. Red curve is a Poisson curve with rate = median count rate of data. |
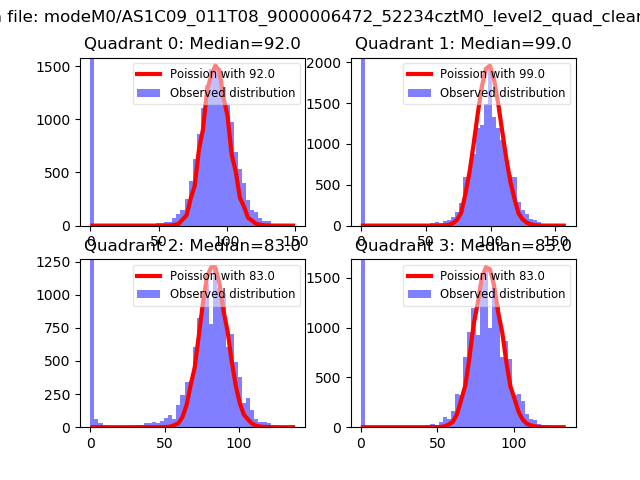 |
 |
| Quadrant-wise count rates Data is divided into 100 sec bins |
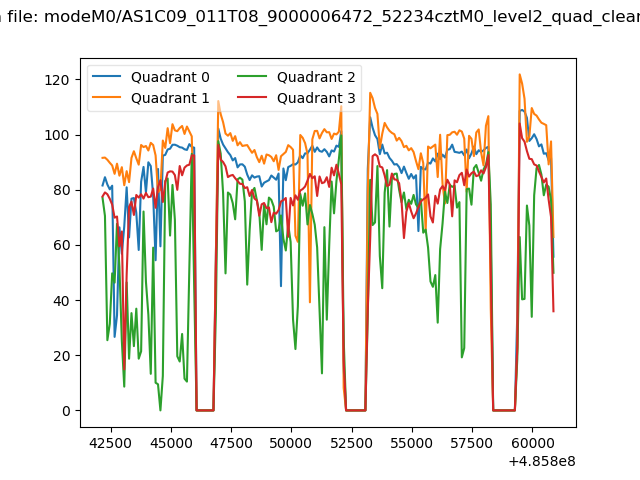 |
|
| Module-wise count rates for Quadrant A Data is divided into 100 sec bins |
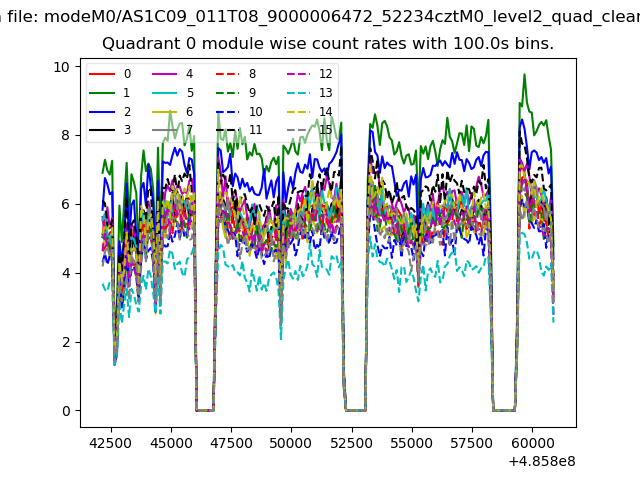 |
 |
| Module-wise count rates for Quadrant B Data is divided into 100 sec bins |
 |
 |
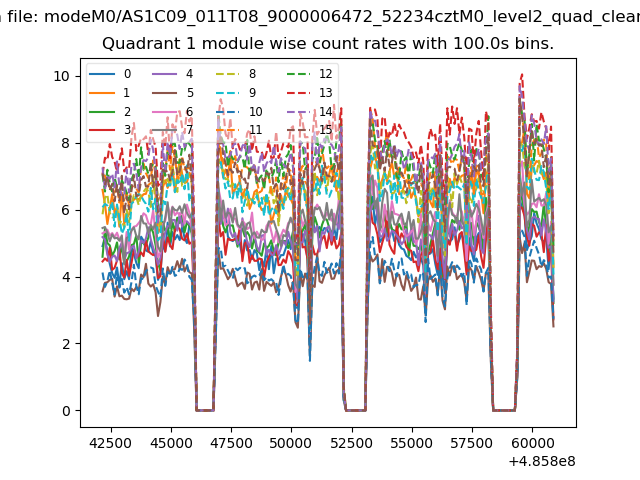
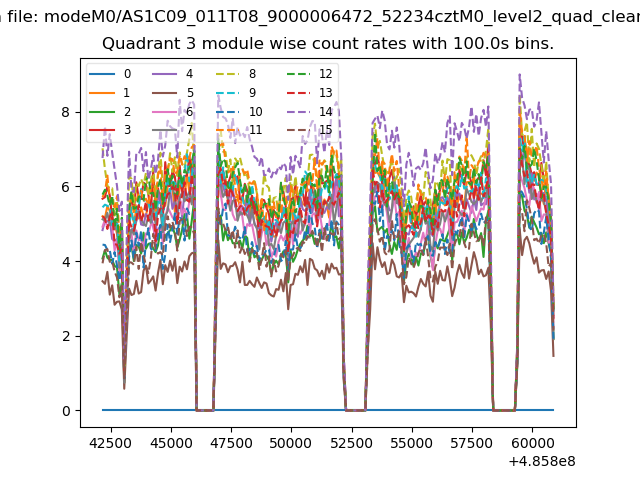
| Module-wise count rates for Quadrant C Data is divided into 100 sec bins |
 |
 |
| Module-wise count rates for Quadrant D Data is divided into 100 sec bins |
 |
 |
| Parameter | Plot |
|---|---|
| CZT HV Monitor |  |
| D_VDD | 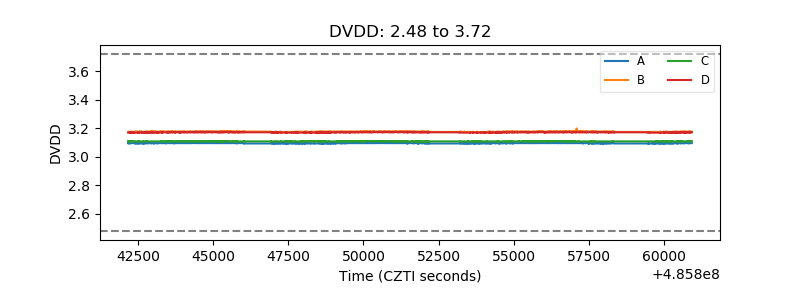 |
| Temperature 1 | 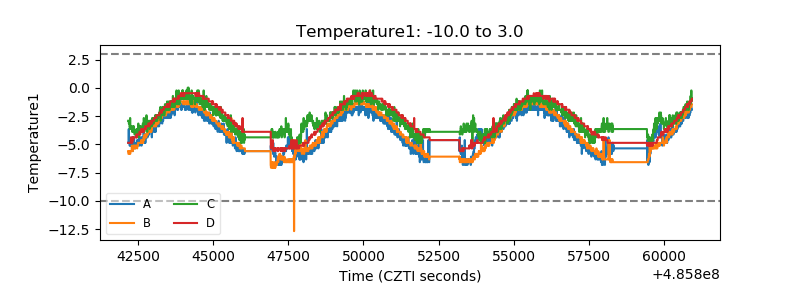 |
| Veto HV Monitor | 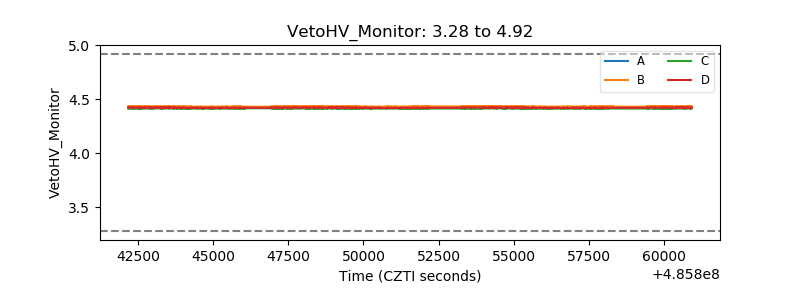 |
| Veto LLD | 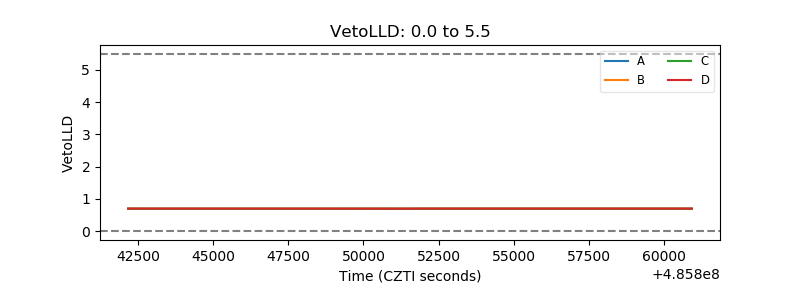 |
| Alpha Counter | 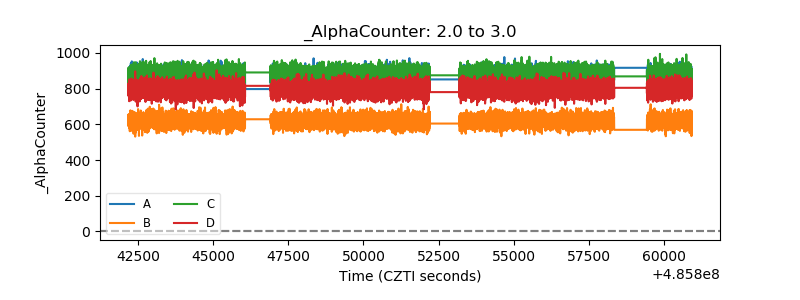 |
| _CPM_Rate | 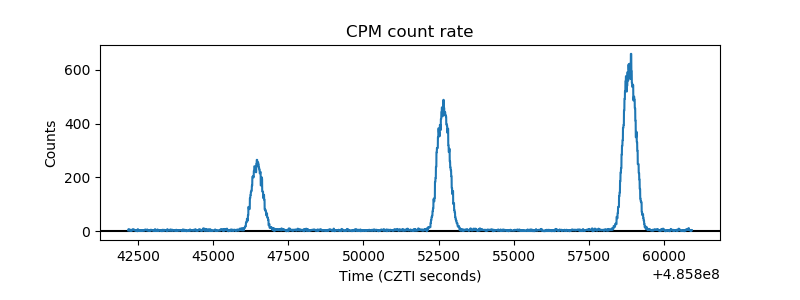 |
| CZT Counter | 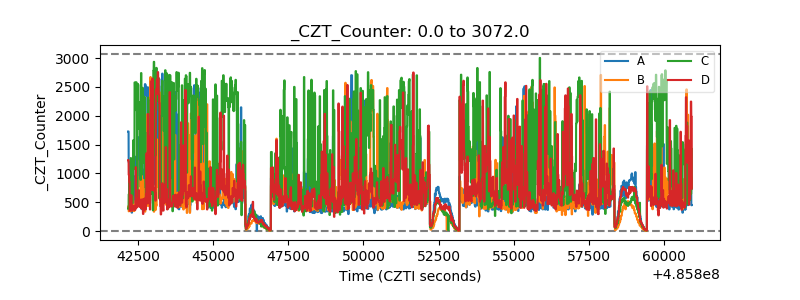 |
| +2.5 Volts monitor |  |
| +5 Volts monitor |  |
| _ROLL_ROT | 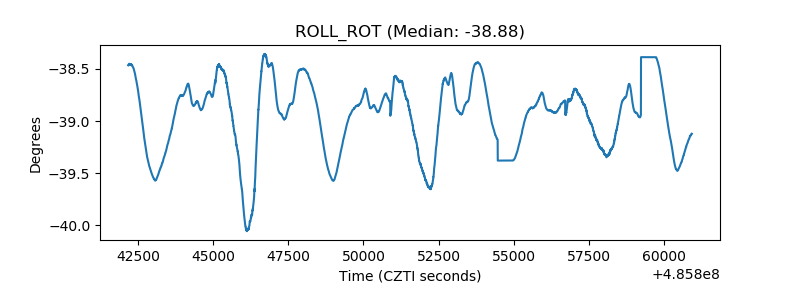 |
| _Roll_DEC | 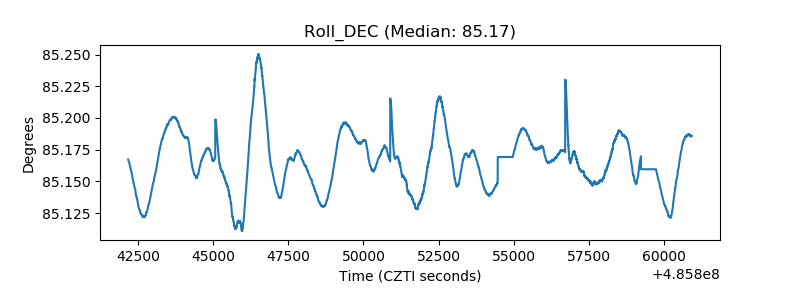 |
| _Roll_RA | 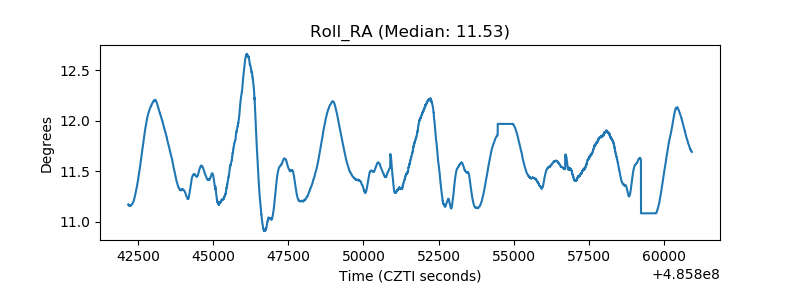 |
| Veto Counter | 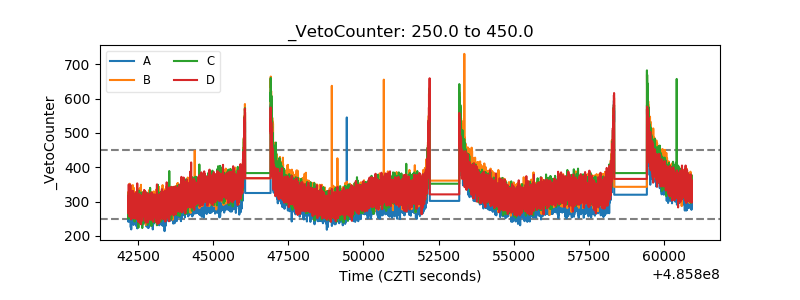 |