| Param | Original file | Final file |
|---|---|---|
| Filename | modeM0/AS1C09_011T08_9000006472_52244cztM0_level2.fits | modeM0/AS1C09_011T08_9000006472_52244cztM0_level2_quad_clean.evt |
| Size (bytes) | 2,498,777,280 | 218,983,680 |
| Size | 2.3 GB | 208.8 MB |
| Events in quadrant A | 17,218,149 | 1,448,472 |
| Events in quadrant B | 20,250,021 | 1,601,803 |
| Events in quadrant C | 26,830,784 | 1,149,432 |
| Events in quadrant D | 26,761,315 | 1,138,420 |
| Mode M0 | |||
|---|---|---|---|
| Quadrant | BADHDUFLAG | Total packets | Discarded packets |
| A | 0 | 64261 | 227 |
| B | 0 | 73336 | 171 |
| C | 0 | 93250 | 436 |
| D | 0 | 92864 | 416 |
| Mode M9 | |||
|---|---|---|---|
| Quadrant | BADHDUFLAG | Total packets | Discarded packets |
| A | 0 | 10 | 0 |
| B | 0 | 10 | 0 |
| C | 0 | 10 | 0 |
| D | 0 | 10 | 0 |
| Mode SS | |||
|---|---|---|---|
| Quadrant | BADHDUFLAG | Total packets | Discarded packets |
| A | 0 | 382 | 0 |
| B | 0 | 381 | 1 |
| C | 0 | 381 | 1 |
| D | 0 | 382 | 0 |
| Quadrant | Total seconds | Saturated seconds | Saturation percentage |
|---|---|---|---|
| A | 18721 | 2587 | 13.818706% |
| B | 18720 | 2928 | 15.641026% |
| C | 18699 | 6259 | 33.472378% |
| D | 18695 | 4943 | 26.440225% |
Noise dominated data is calculated using 1-second bins in cleaned event files. If a bin has >2000 counts, and if more than 50% of those come from <1% of pixels, then it is considered to be noise-dominated and hence unusable.
| Quadrant | # 1 sec bins | Bins with >0 counts | Bins with >2000 counts | High rate bins dominated by noise | Noise dominated (total time) | Noise dominated (detector-on time) | Marked lightcurve |
|---|---|---|---|---|---|---|---|
| A | 19902 | 18773 | 2304 | 2304 | 11.58% | 12.27% | 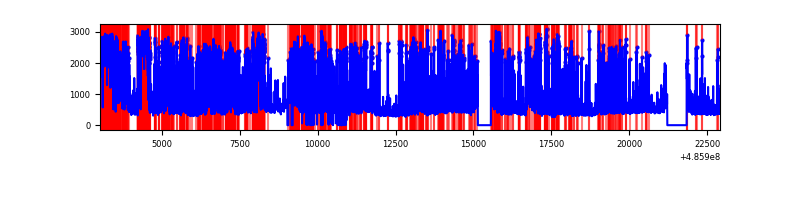 |
| B | 19901 | 18762 | 2034 | 2034 | 10.22% | 10.84% | 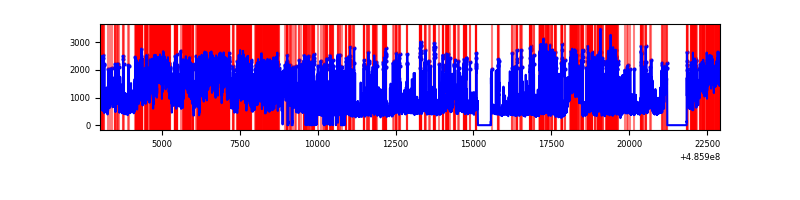 |
| C | 19902 | 18766 | 5651 | 5651 | 28.39% | 30.11% | 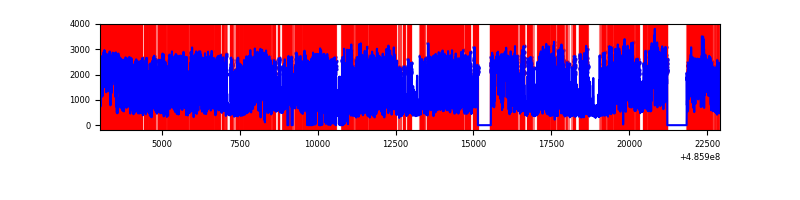 |
| D | 19902 | 18754 | 5241 | 5241 | 26.33% | 27.95% | 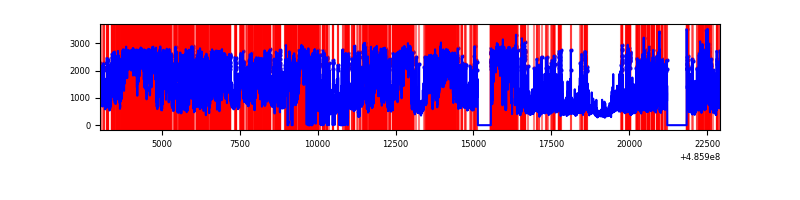 |
Top three noisy pixels from each quadrant. If the there are fewer than three noisy pixels in the level2.evt file, extra rows are filled as -1
| Pixel properties | Quadrant properties | ||||||
|---|---|---|---|---|---|---|---|
| Quadrant | DetID | PixID | Counts | Sigma | Mean | Median | Sigma |
| A | 3 | 79 | 4594906 | 10049.02 | 1827 | 1782 | 457.1 |
| A | 6 | 162 | 2011835 | 4397.67 | 1827 | 1782 | 457.1 |
| A | 15 | 174 | 983594 | 2148.05 | 1827 | 1782 | 457.1 |
| B | 10 | 254 | 3650993 | 9236.38 | 1858 | 1793 | 395.1 |
| B | 7 | 0 | 3525058 | 8917.63 | 1858 | 1793 | 395.1 |
| B | 4 | 206 | 1499285 | 3790.25 | 1858 | 1793 | 395.1 |
| C | 15 | 224 | 13663689 | 30666.08 | 1612 | 1597 | 445.5 |
| C | 9 | 38 | 2872233 | 6443.46 | 1612 | 1597 | 445.5 |
| C | 1 | 45 | 1432905 | 3212.73 | 1612 | 1597 | 445.5 |
| D | 6 | 42 | 11325959 | 23185.52 | 1715 | 1641 | 488.4 |
| D | 3 | 12 | 2689800 | 5503.76 | 1715 | 1641 | 488.4 |
| D | 8 | 176 | 1748211 | 3575.94 | 1715 | 1641 | 488.4 |
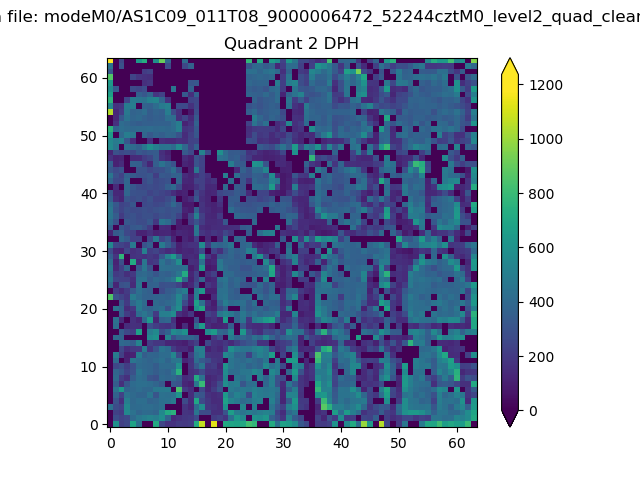
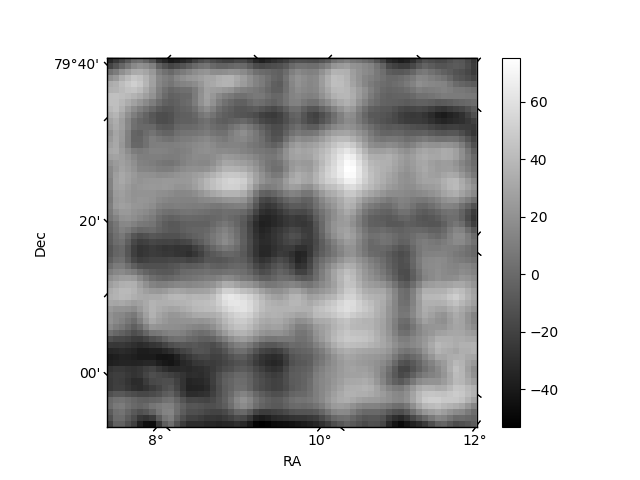
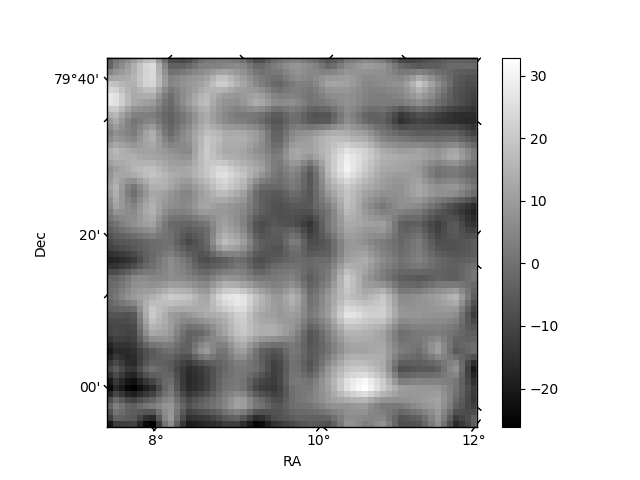
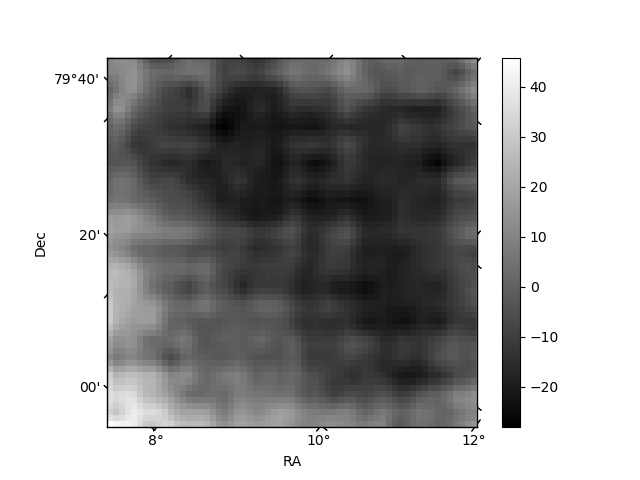
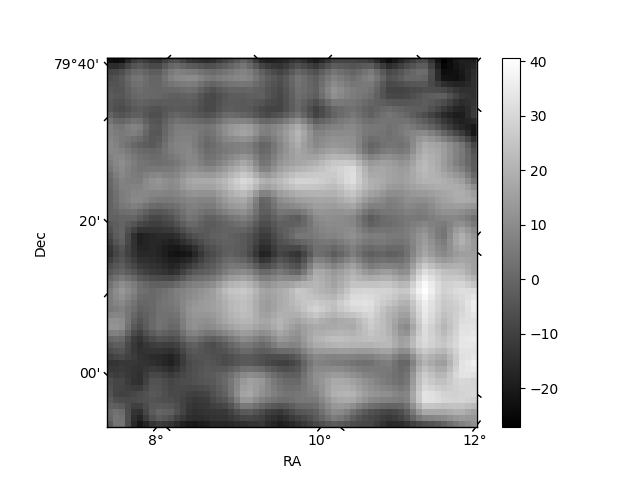
Histogram calculated using DETX and DETY for each event in the final _common_clean file
| Quadrant A | 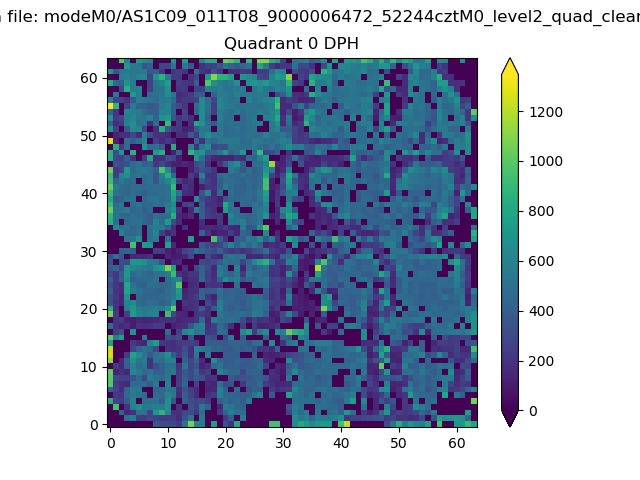 |
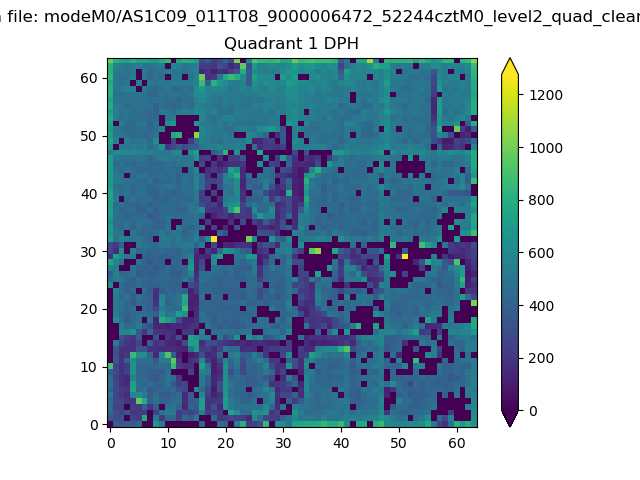 |
Quadrant B |
|---|---|---|---|
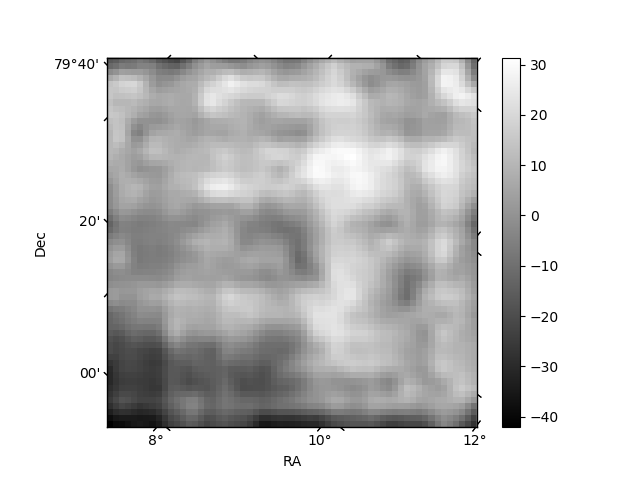
| Quadrant D | 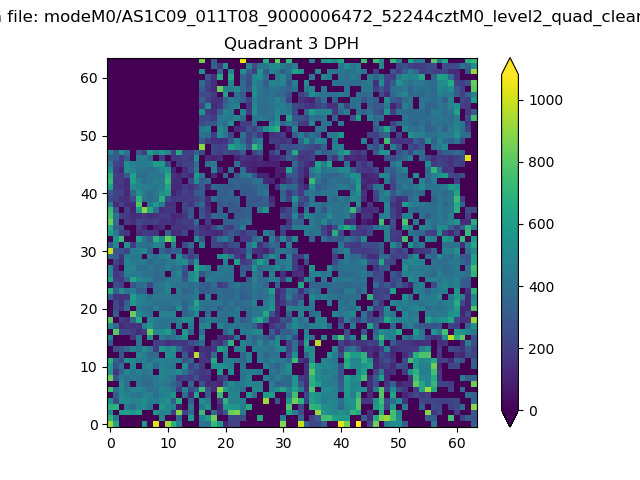 |
 |
Quadrant C |
| Plot type | Count rate plots | Images |
|---|---|---|
| Comparison with Poisson distribution Blue bars denote a histogram of data divided into 1 sec bins. Red curve is a Poisson curve with rate = median count rate of data. |
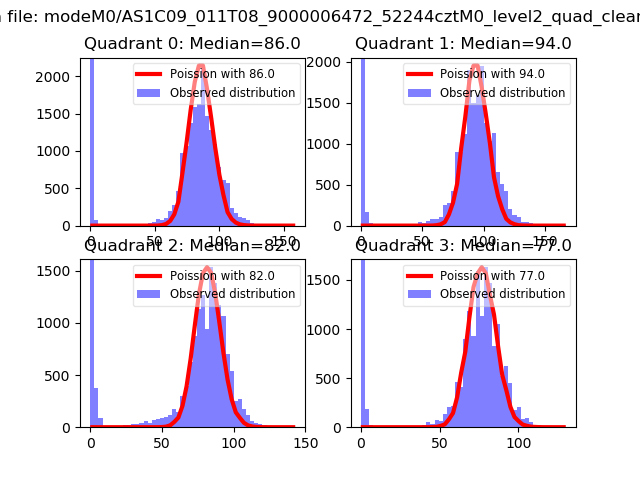 |
 |
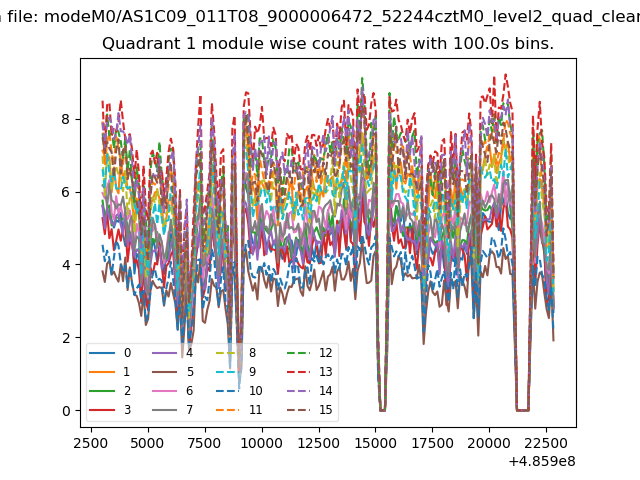
| Quadrant-wise count rates Data is divided into 100 sec bins |
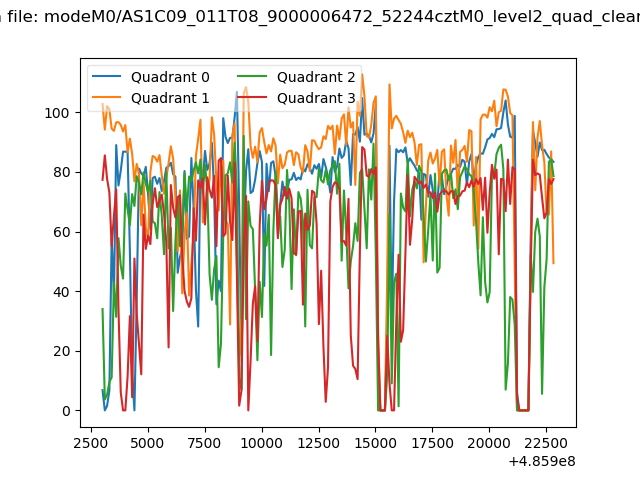 |
|
| Module-wise count rates for Quadrant A Data is divided into 100 sec bins |
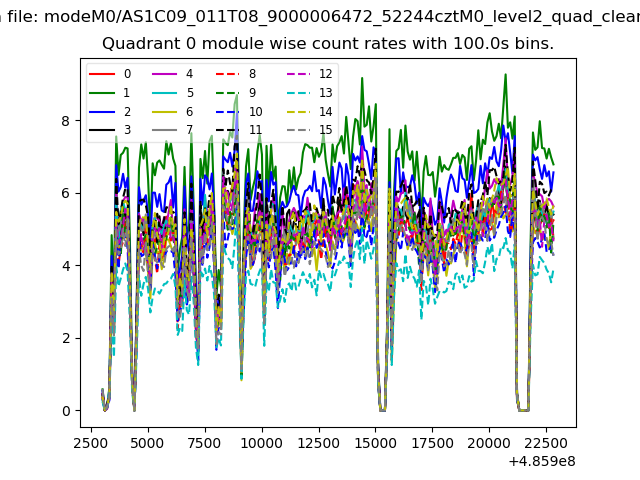 |
 |
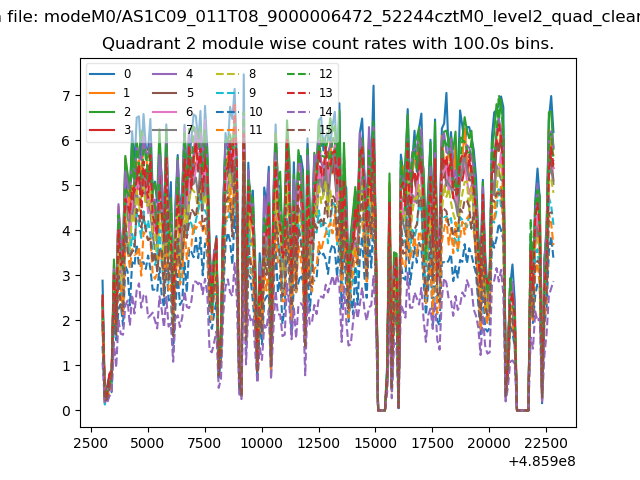
| Module-wise count rates for Quadrant B Data is divided into 100 sec bins |
 |
 |
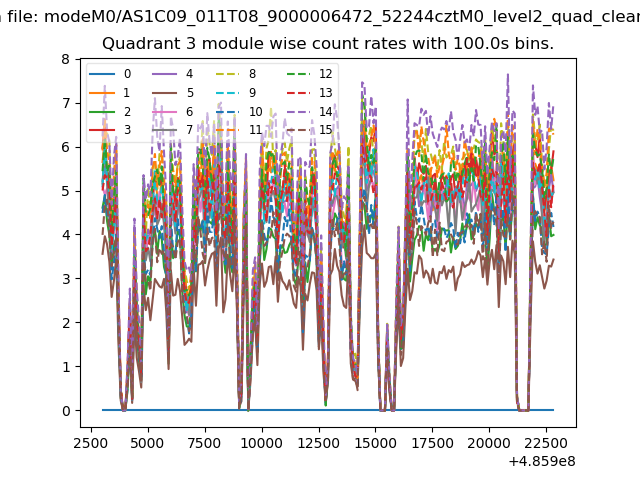
| Module-wise count rates for Quadrant C Data is divided into 100 sec bins |
 |
 |
| Module-wise count rates for Quadrant D Data is divided into 100 sec bins |
 |
 |
| Parameter | Plot |
|---|---|
| CZT HV Monitor | 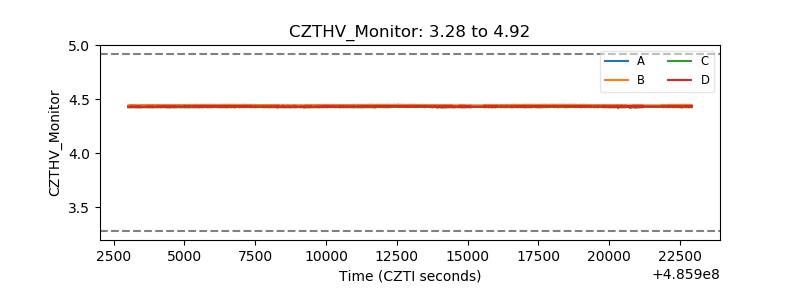 |
| D_VDD | 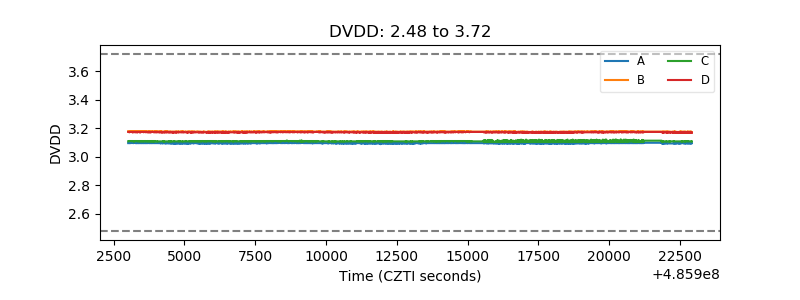 |
| Temperature 1 | 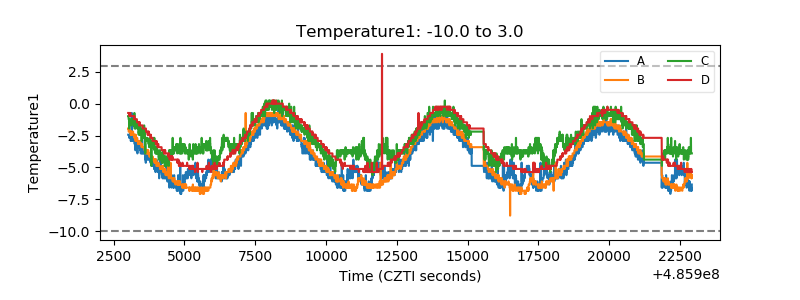 |
| Veto HV Monitor | 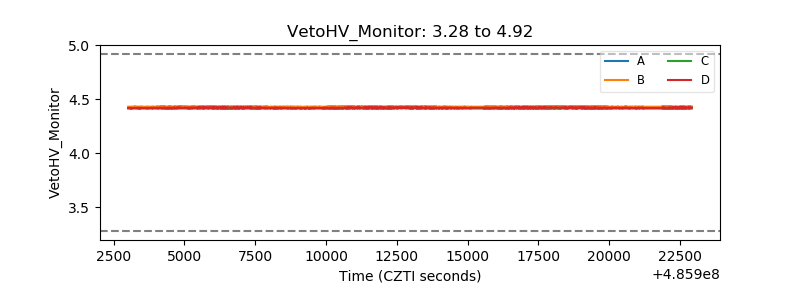 |
| Veto LLD | 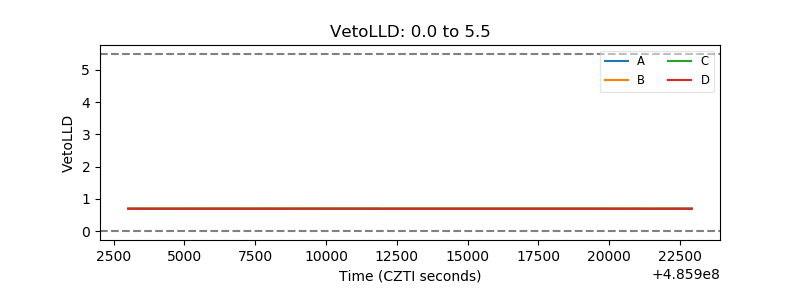 |
| Alpha Counter | 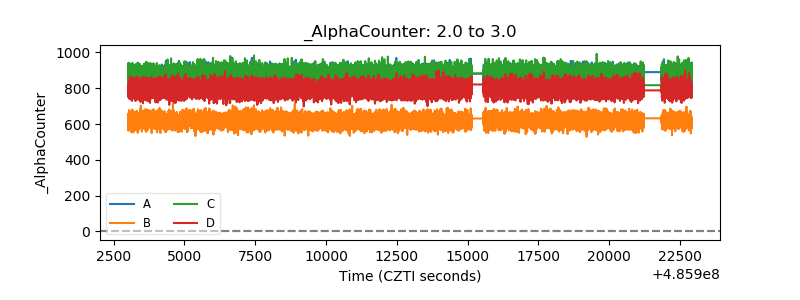 |
| _CPM_Rate | 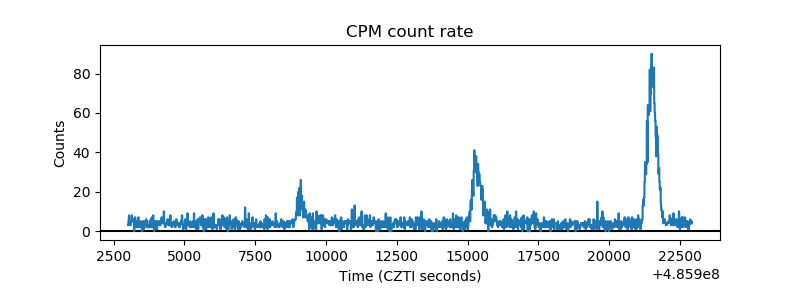 |
| CZT Counter | 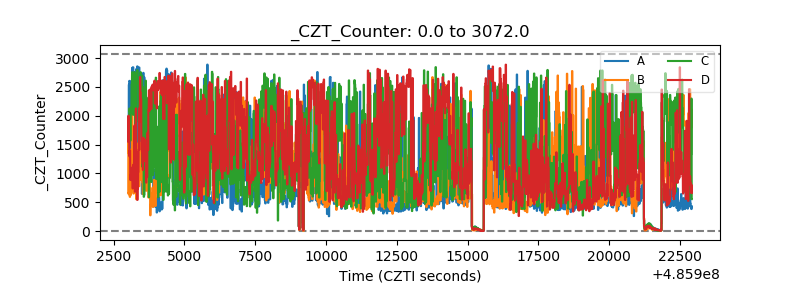 |
| +2.5 Volts monitor |  |
| +5 Volts monitor |  |
| _ROLL_ROT | 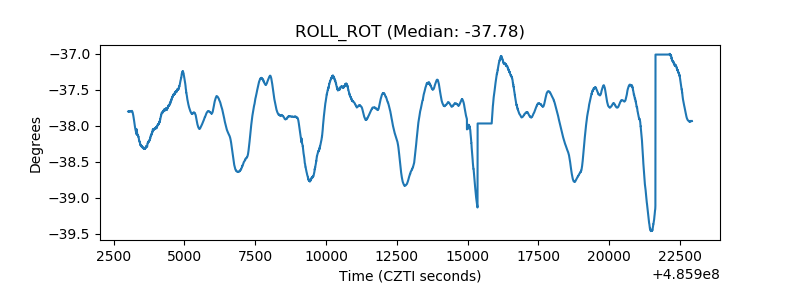 |
| _Roll_DEC | 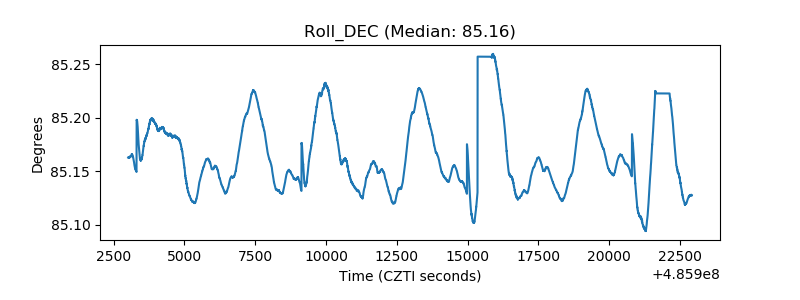 |
| _Roll_RA | 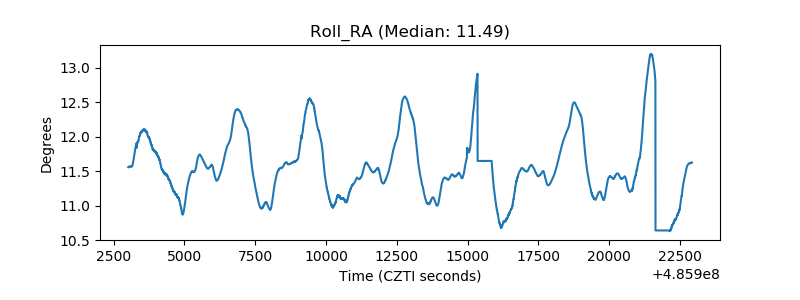 |
| Veto Counter | 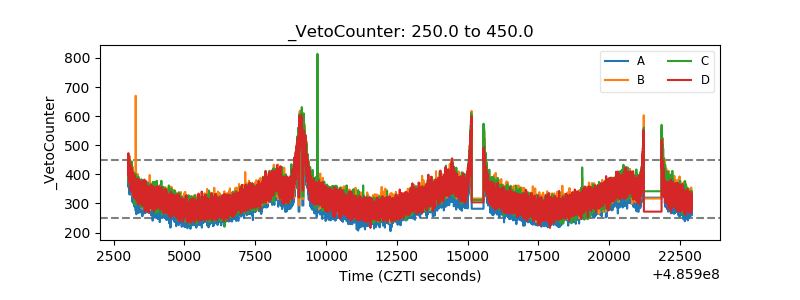 |