| Param | Original file | Final file |
|---|---|---|
| Filename | modeM0/AS1C09_011T08_9000006472_52245cztM0_level2.fits | modeM0/AS1C09_011T08_9000006472_52245cztM0_level2_quad_clean.evt |
| Size (bytes) | 852,736,320 | 84,329,280 |
| Size | 813.2 MB | 80.4 MB |
| Events in quadrant A | 3,770,194 | 605,313 |
| Events in quadrant B | 9,172,655 | 570,953 |
| Events in quadrant C | 8,280,550 | 492,056 |
| Events in quadrant D | 9,823,731 | 415,350 |
| Mode M0 | |||
|---|---|---|---|
| Quadrant | BADHDUFLAG | Total packets | Discarded packets |
| A | 0 | 15991 | 1 |
| B | 0 | 31965 | 4 |
| C | 0 | 29336 | 1 |
| D | 0 | 33879 | 1 |
| Mode M9 | |||
|---|---|---|---|
| Quadrant | BADHDUFLAG | Total packets | Discarded packets |
| A | 0 | 7 | 0 |
| B | 0 | 7 | 0 |
| C | 0 | 7 | 0 |
| D | 0 | 7 | 0 |
| Mode SS | |||
|---|---|---|---|
| Quadrant | BADHDUFLAG | Total packets | Discarded packets |
| A | 0 | 138 | 0 |
| B | 0 | 138 | 0 |
| C | 0 | 138 | 0 |
| D | 0 | 138 | 0 |
| Quadrant | Total seconds | Saturated seconds | Saturation percentage |
|---|---|---|---|
| A | 6721 | 166 | 2.469871% |
| B | 6721 | 1327 | 19.744086% |
| C | 6721 | 1492 | 22.199078% |
| D | 6721 | 1903 | 28.314239% |
Noise dominated data is calculated using 1-second bins in cleaned event files. If a bin has >2000 counts, and if more than 50% of those come from <1% of pixels, then it is considered to be noise-dominated and hence unusable.
| Quadrant | # 1 sec bins | Bins with >0 counts | Bins with >2000 counts | High rate bins dominated by noise | Noise dominated (total time) | Noise dominated (detector-on time) | Marked lightcurve |
|---|---|---|---|---|---|---|---|
| A | 7501 | 6722 | 105 | 105 | 1.40% | 1.56% | 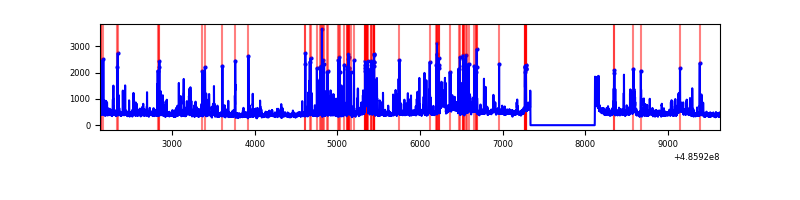 |
| B | 7501 | 6722 | 1026 | 1026 | 13.68% | 15.26% | 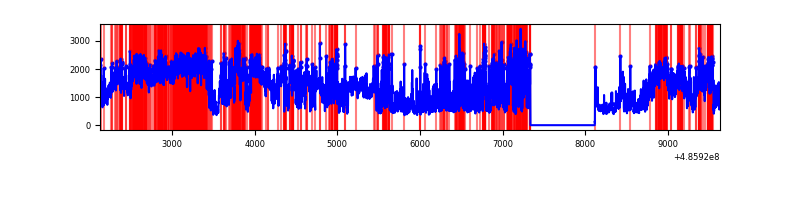 |
| C | 7501 | 6722 | 1339 | 1339 | 17.85% | 19.92% | 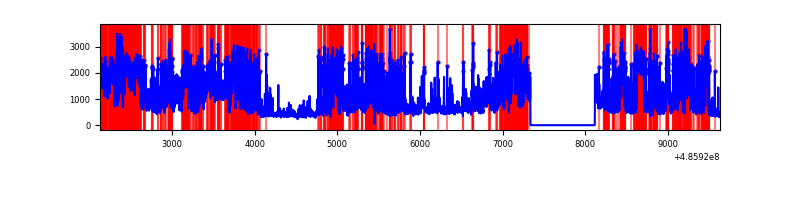 |
| D | 7501 | 6722 | 1949 | 1949 | 25.98% | 28.99% | 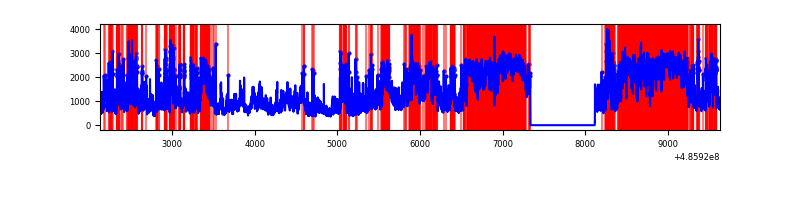 |
Top three noisy pixels from each quadrant. If the there are fewer than three noisy pixels in the level2.evt file, extra rows are filled as -1
| Pixel properties | Quadrant properties | ||||||
|---|---|---|---|---|---|---|---|
| Quadrant | DetID | PixID | Counts | Sigma | Mean | Median | Sigma |
| A | 3 | 79 | 406963 | 2398.61 | 684 | 669 | 169.4 |
| A | 6 | 162 | 162822 | 957.29 | 684 | 669 | 169.4 |
| A | 5 | 240 | 76969 | 450.45 | 684 | 669 | 169.4 |
| B | 10 | 254 | 4647298 | 33532.87 | 648 | 627 | 138.6 |
| B | 12 | 32 | 984788 | 7102.23 | 648 | 627 | 138.6 |
| B | 4 | 81 | 165124 | 1187.1 | 648 | 627 | 138.6 |
| C | 15 | 224 | 2201343 | 12992.67 | 610 | 604 | 169.4 |
| C | 9 | 38 | 1410704 | 8324.91 | 610 | 604 | 169.4 |
| C | 1 | 45 | 1254577 | 7403.17 | 610 | 604 | 169.4 |
| D | 6 | 42 | 5510525 | 32320.35 | 592 | 566 | 170.5 |
| D | 10 | 181 | 860872 | 5046.39 | 592 | 566 | 170.5 |
| D | 8 | 176 | 640866 | 3755.87 | 592 | 566 | 170.5 |
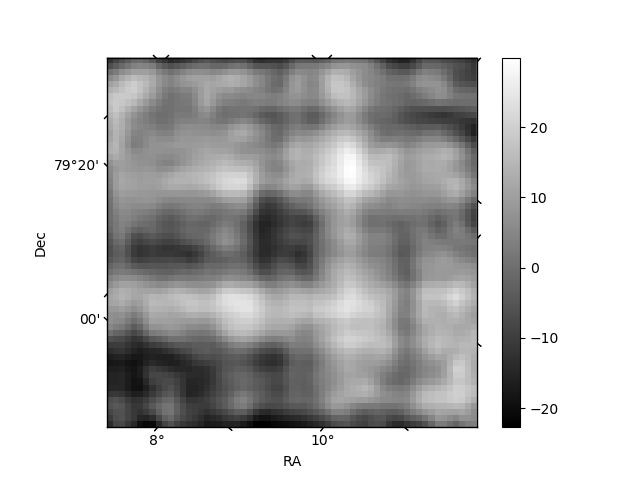
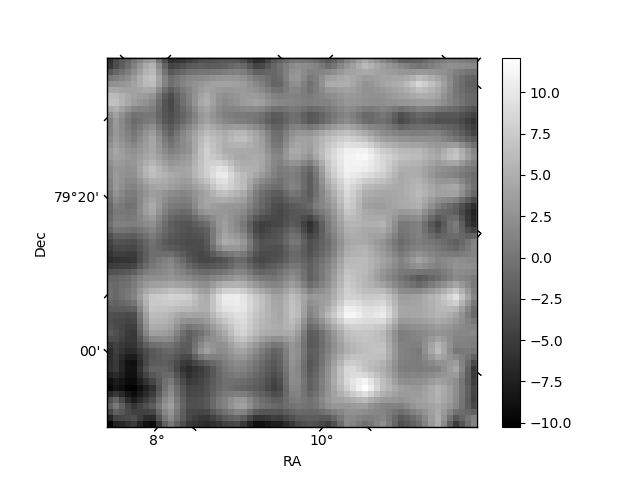
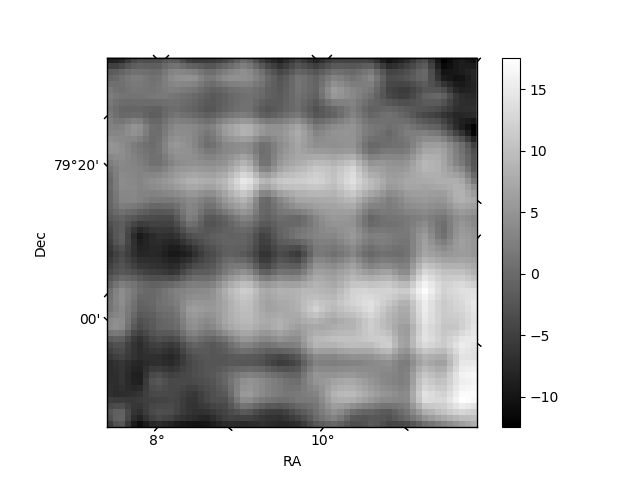
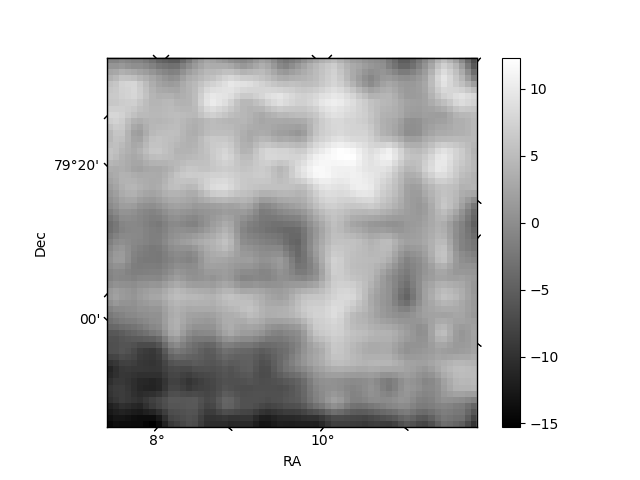
Histogram calculated using DETX and DETY for each event in the final _common_clean file
| Quadrant A | 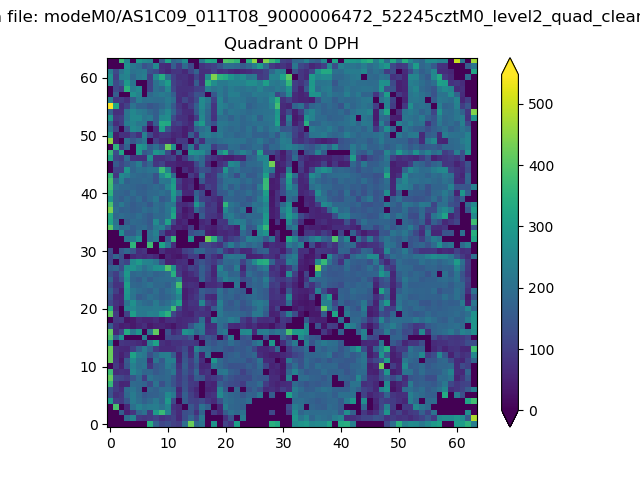 |
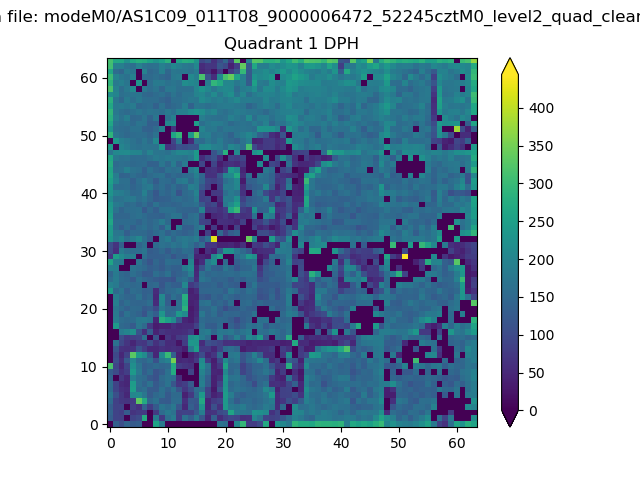 |
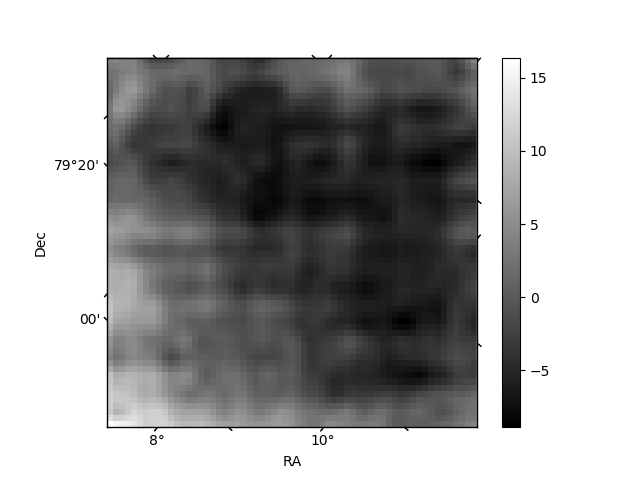
Quadrant B |
|---|---|---|---|
| Quadrant D | 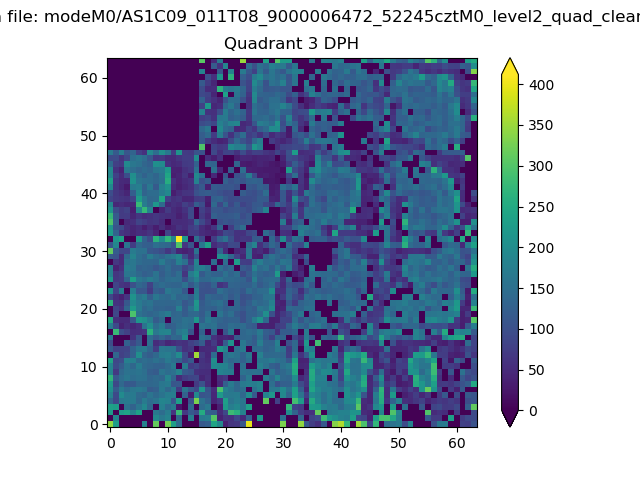 |
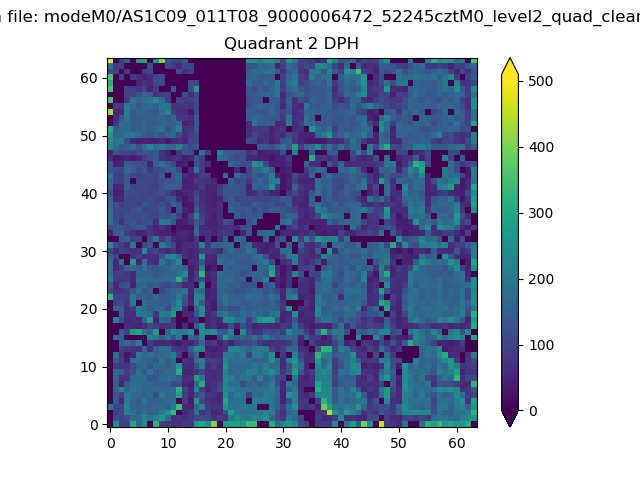 |
Quadrant C |
| Plot type | Count rate plots | Images |
|---|---|---|
| Comparison with Poisson distribution Blue bars denote a histogram of data divided into 1 sec bins. Red curve is a Poisson curve with rate = median count rate of data. |
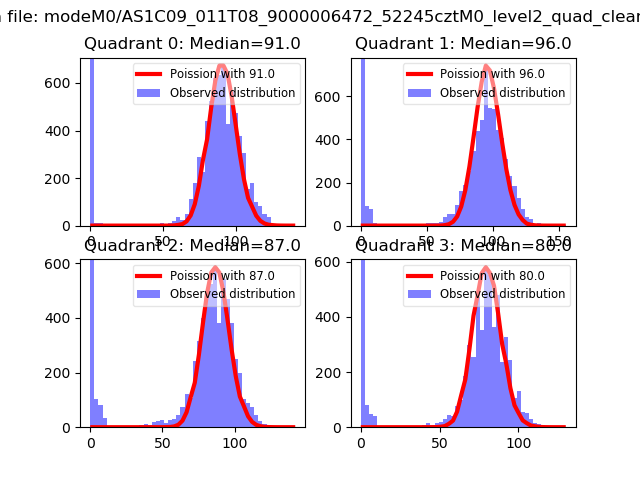 |
 |
| Quadrant-wise count rates Data is divided into 100 sec bins |
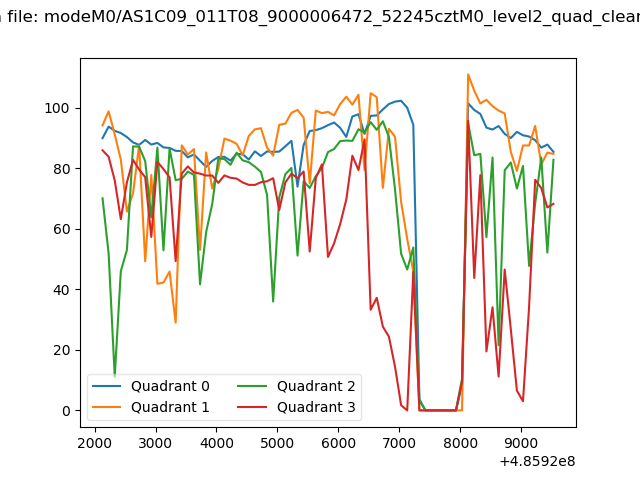 |
|
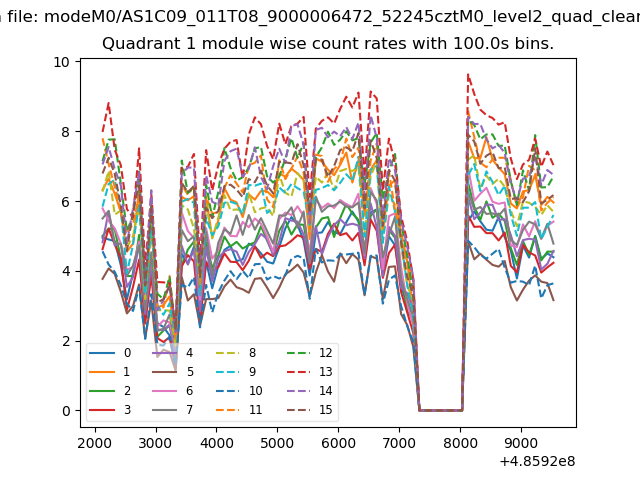
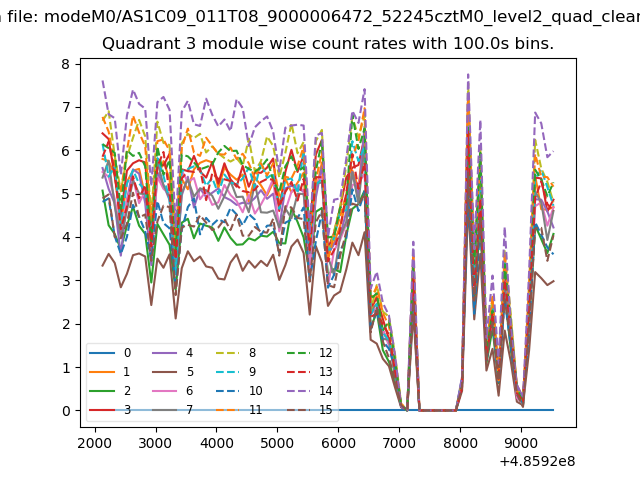
| Module-wise count rates for Quadrant A Data is divided into 100 sec bins |
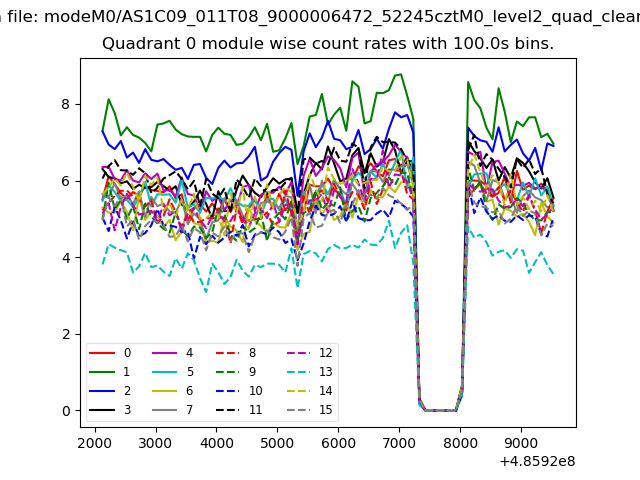 |
 |
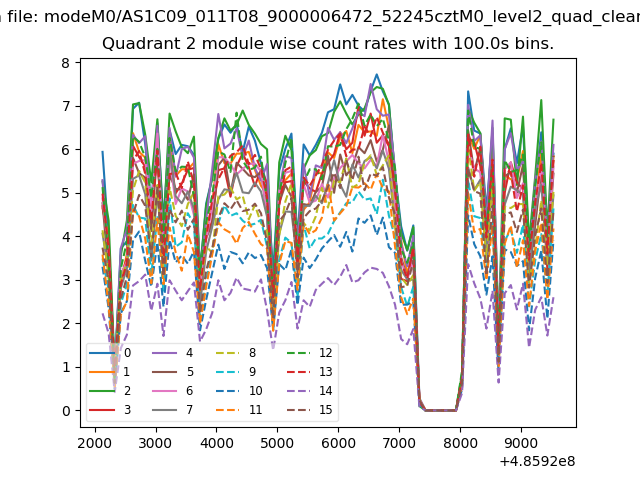
| Module-wise count rates for Quadrant B Data is divided into 100 sec bins |
 |
 |
| Module-wise count rates for Quadrant C Data is divided into 100 sec bins |
 |
 |
| Module-wise count rates for Quadrant D Data is divided into 100 sec bins |
 |
 |
| Parameter | Plot |
|---|---|
| CZT HV Monitor | 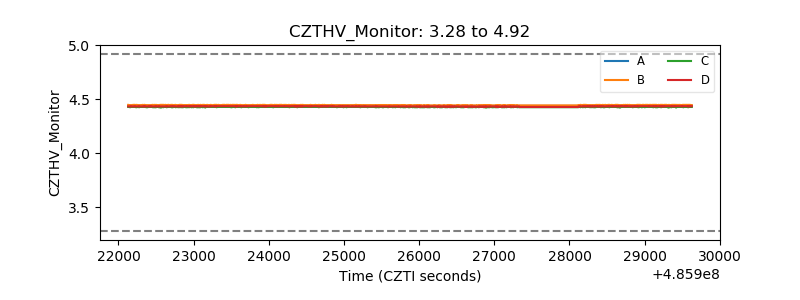 |
| D_VDD | 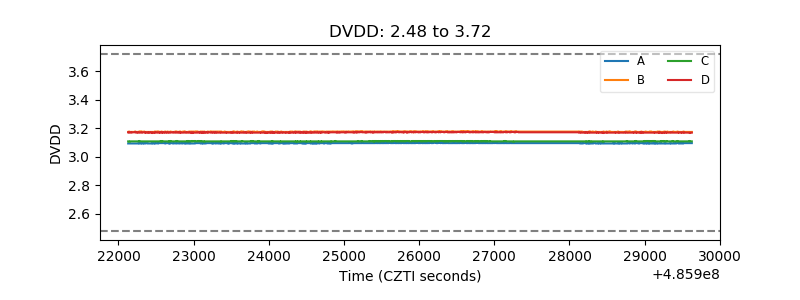 |
| Temperature 1 | 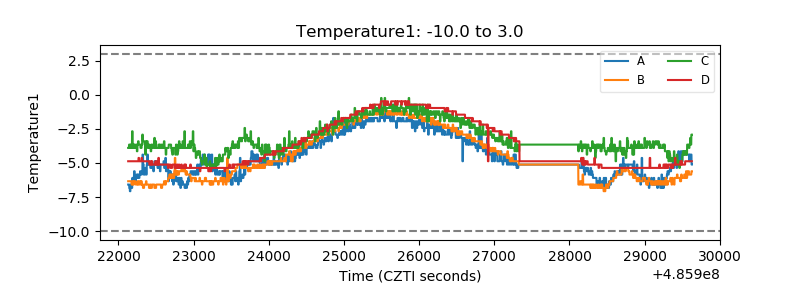 |
| Veto HV Monitor | 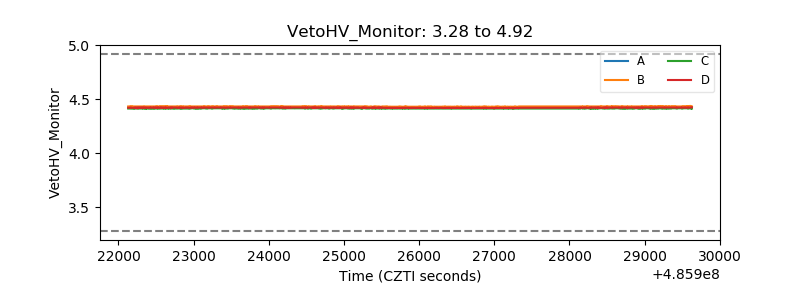 |
| Veto LLD | 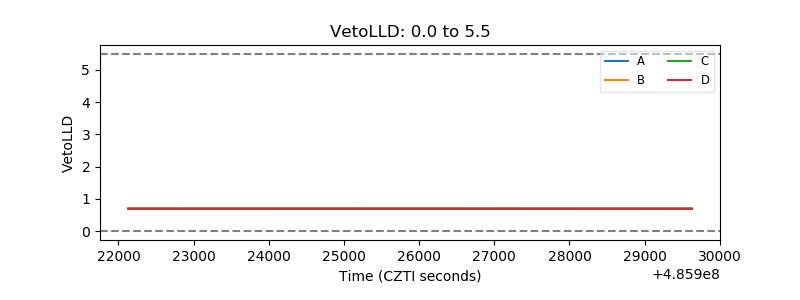 |
| Alpha Counter | 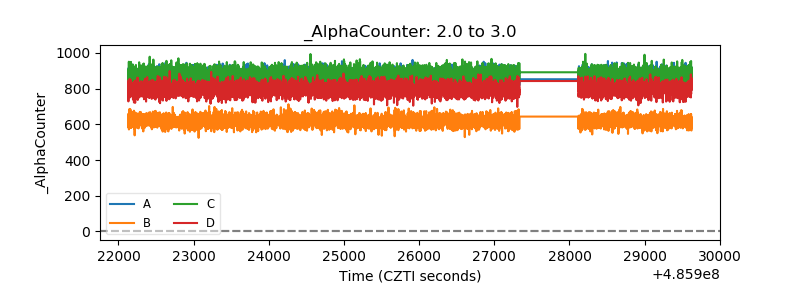 |
| _CPM_Rate | 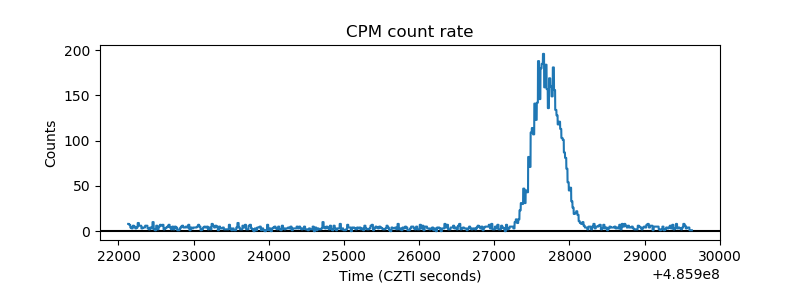 |
| CZT Counter | 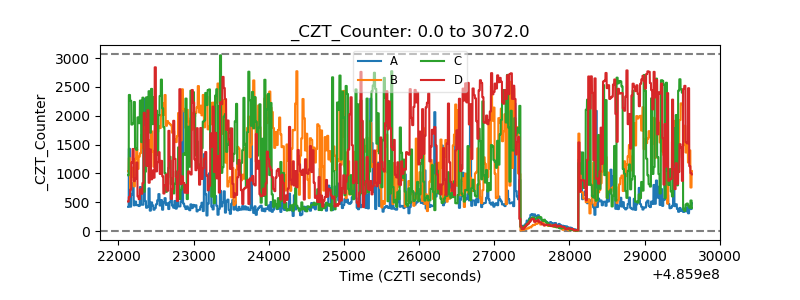 |
| +2.5 Volts monitor |  |
| +5 Volts monitor |  |
| _ROLL_ROT | 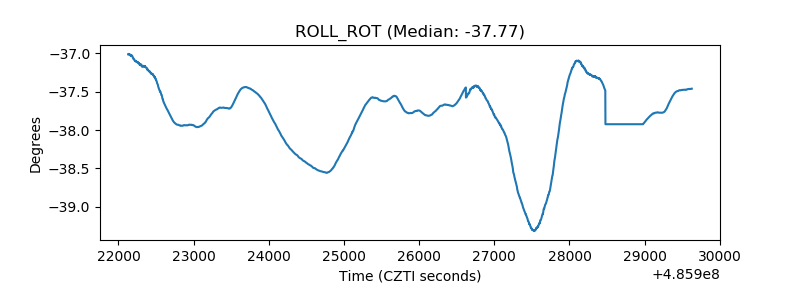 |
| _Roll_DEC | 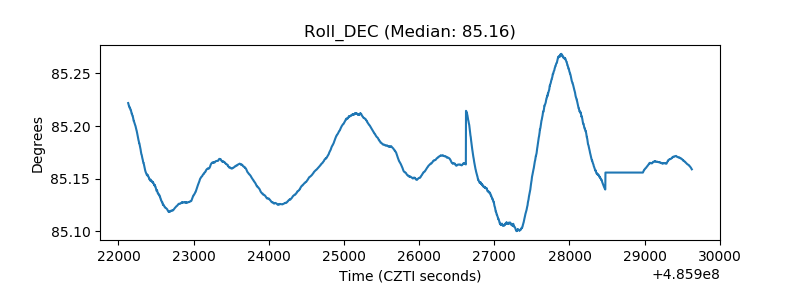 |
| _Roll_RA | 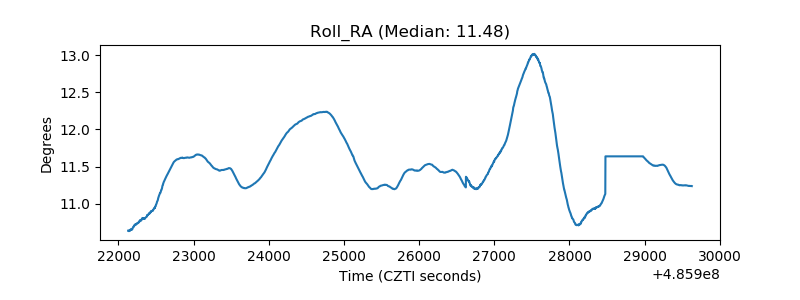 |
| Veto Counter | 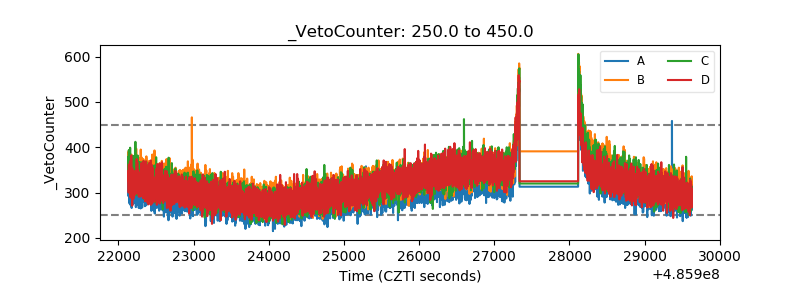 |