| Param | Original file | Final file |
|---|---|---|
| Filename | modeM0/AS1C09_011T08_9000006472_52246cztM0_level2.fits | modeM0/AS1C09_011T08_9000006472_52246cztM0_level2_quad_clean.evt |
| Size (bytes) | 699,744,960 | 75,908,160 |
| Size | 667.3 MB | 72.4 MB |
| Events in quadrant A | 3,353,451 | 541,720 |
| Events in quadrant B | 4,944,858 | 575,174 |
| Events in quadrant C | 7,813,778 | 397,136 |
| Events in quadrant D | 9,331,257 | 369,145 |
| Mode M0 | |||
|---|---|---|---|
| Quadrant | BADHDUFLAG | Total packets | Discarded packets |
| A | 0 | 14296 | 19 |
| B | 0 | 18836 | 53 |
| C | 0 | 27376 | 54 |
| D | 0 | 32091 | 254 |
| Mode M9 | |||
|---|---|---|---|
| Quadrant | BADHDUFLAG | Total packets | Discarded packets |
| A | 0 | 9 | 0 |
| B | 0 | 9 | 0 |
| C | 0 | 9 | 0 |
| D | 0 | 9 | 0 |
| Mode SS | |||
|---|---|---|---|
| Quadrant | BADHDUFLAG | Total packets | Discarded packets |
| A | 0 | 122 | 0 |
| B | 0 | 122 | 0 |
| C | 0 | 122 | 0 |
| D | 0 | 122 | 0 |
| Quadrant | Total seconds | Saturated seconds | Saturation percentage |
|---|---|---|---|
| A | 5943 | 141 | 2.372539% |
| B | 5938 | 299 | 5.035365% |
| C | 5938 | 1743 | 29.353318% |
| D | 5912 | 1831 | 30.970907% |
Noise dominated data is calculated using 1-second bins in cleaned event files. If a bin has >2000 counts, and if more than 50% of those come from <1% of pixels, then it is considered to be noise-dominated and hence unusable.
| Quadrant | # 1 sec bins | Bins with >0 counts | Bins with >2000 counts | High rate bins dominated by noise | Noise dominated (total time) | Noise dominated (detector-on time) | Marked lightcurve |
|---|---|---|---|---|---|---|---|
| A | 6870 | 5952 | 97 | 97 | 1.41% | 1.63% | 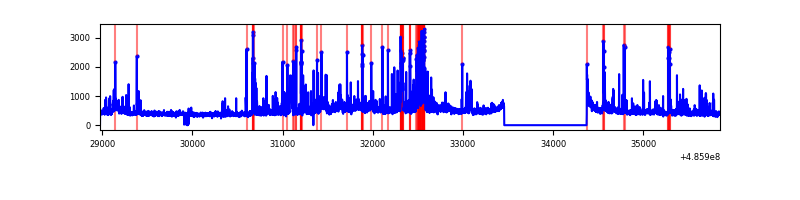 |
| B | 6871 | 5952 | 174 | 174 | 2.53% | 2.92% | 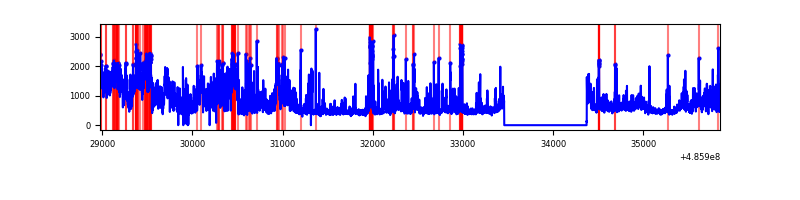 |
| C | 6871 | 5952 | 1522 | 1522 | 22.15% | 25.57% | 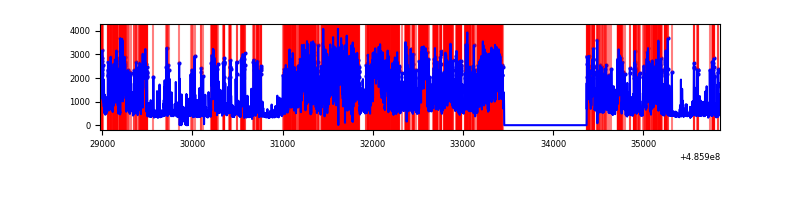 |
| D | 6871 | 5937 | 2105 | 2105 | 30.64% | 35.46% | 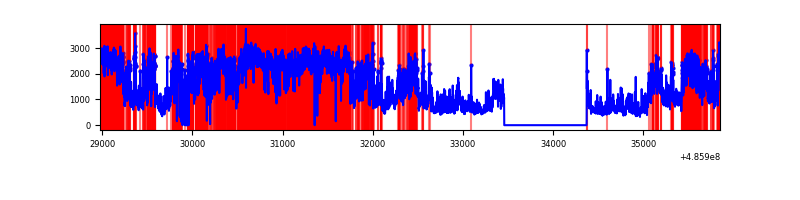 |
Top three noisy pixels from each quadrant. If the there are fewer than three noisy pixels in the level2.evt file, extra rows are filled as -1
| Pixel properties | Quadrant properties | ||||||
|---|---|---|---|---|---|---|---|
| Quadrant | DetID | PixID | Counts | Sigma | Mean | Median | Sigma |
| A | 3 | 79 | 266442 | 1755.0 | 607 | 591 | 151.5 |
| A | 7 | 160 | 187929 | 1236.7 | 607 | 591 | 151.5 |
| A | 5 | 240 | 142594 | 937.42 | 607 | 591 | 151.5 |
| B | 10 | 254 | 1564345 | 12338.2 | 596 | 576 | 126.7 |
| B | 5 | 32 | 211714 | 1665.89 | 596 | 576 | 126.7 |
| B | 12 | 32 | 181391 | 1426.64 | 596 | 576 | 126.7 |
| C | 15 | 224 | 4242039 | 30689.94 | 499 | 493 | 138.2 |
| C | 1 | 45 | 451148 | 3260.74 | 499 | 493 | 138.2 |
| C | 9 | 38 | 290808 | 2100.59 | 499 | 493 | 138.2 |
| D | 6 | 42 | 6061658 | 40258.49 | 523 | 498 | 150.6 |
| D | 10 | 181 | 632203 | 4195.81 | 523 | 498 | 150.6 |
| D | 8 | 176 | 383166 | 2541.7 | 523 | 498 | 150.6 |
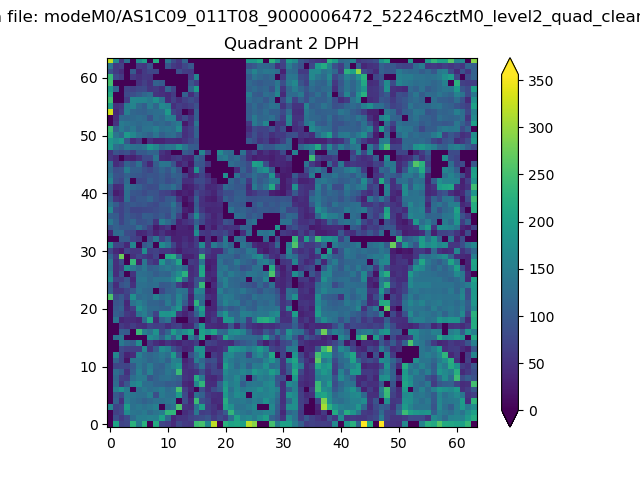
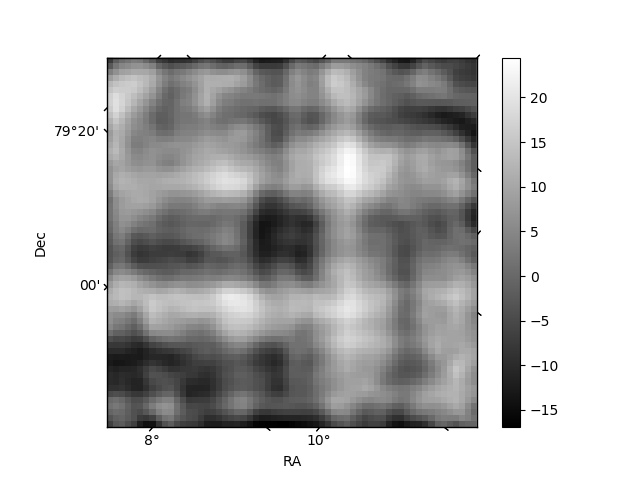
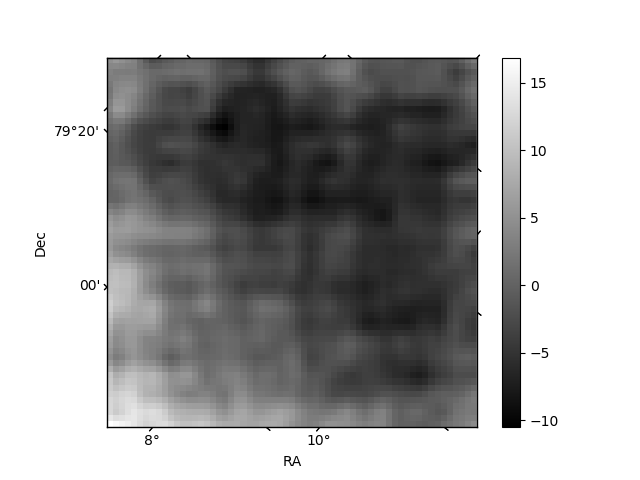
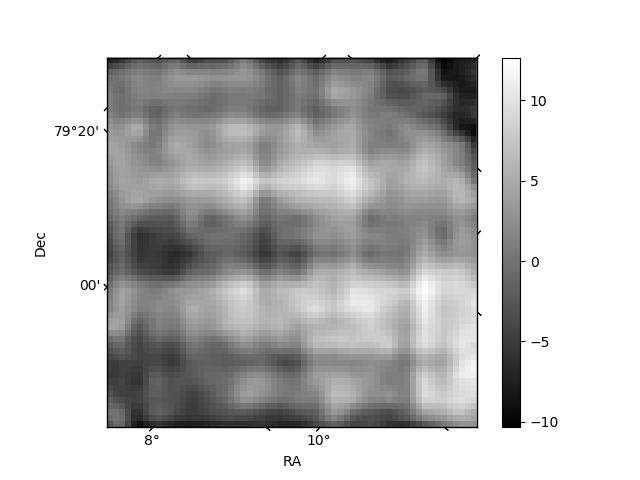
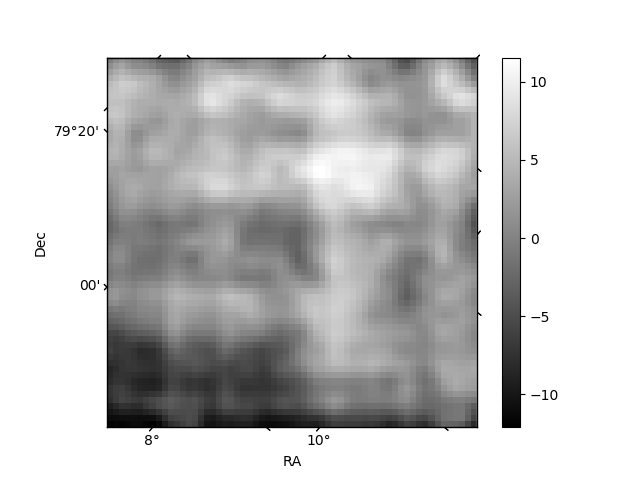
Histogram calculated using DETX and DETY for each event in the final _common_clean file
| Quadrant A | 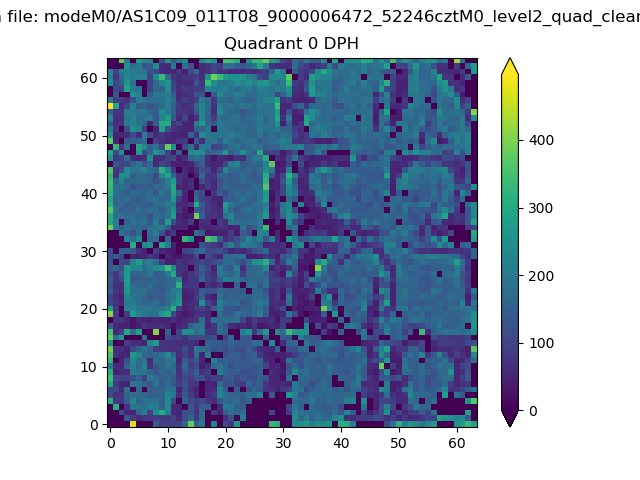 |
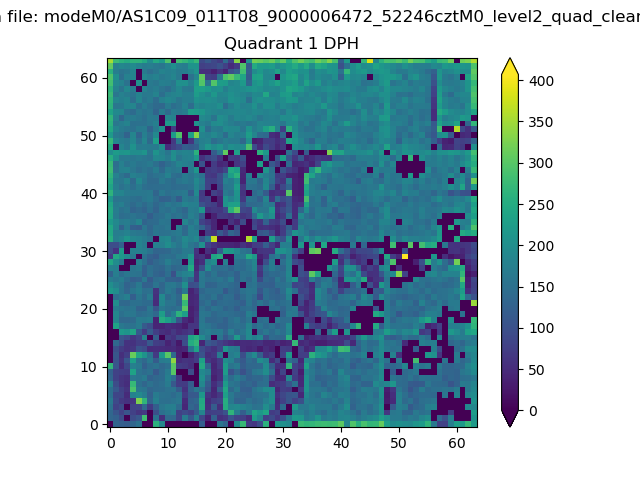 |
Quadrant B |
|---|---|---|---|
| Quadrant D | 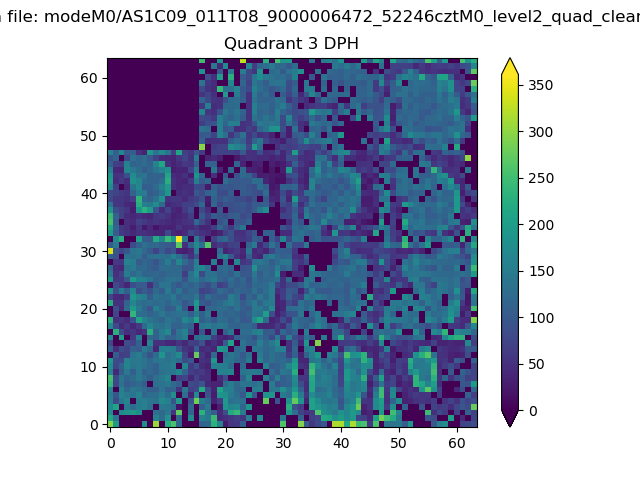 |
 |
Quadrant C |
| Plot type | Count rate plots | Images |
|---|---|---|
| Comparison with Poisson distribution Blue bars denote a histogram of data divided into 1 sec bins. Red curve is a Poisson curve with rate = median count rate of data. |
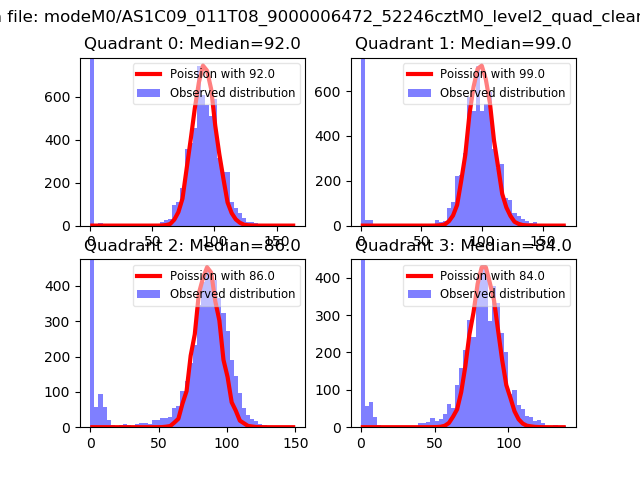 |
 |
| Quadrant-wise count rates Data is divided into 100 sec bins |
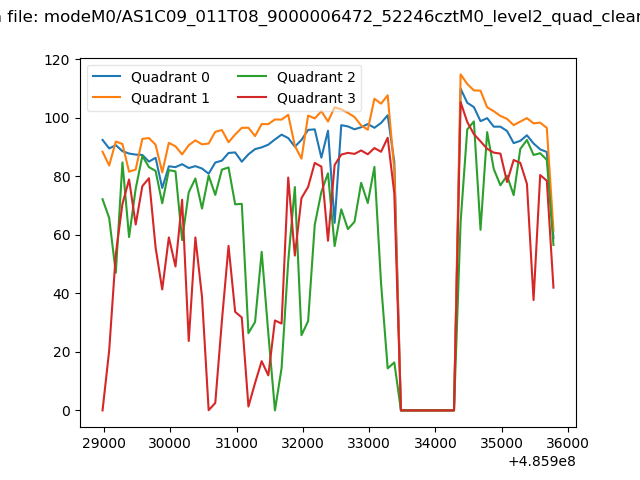 |
|
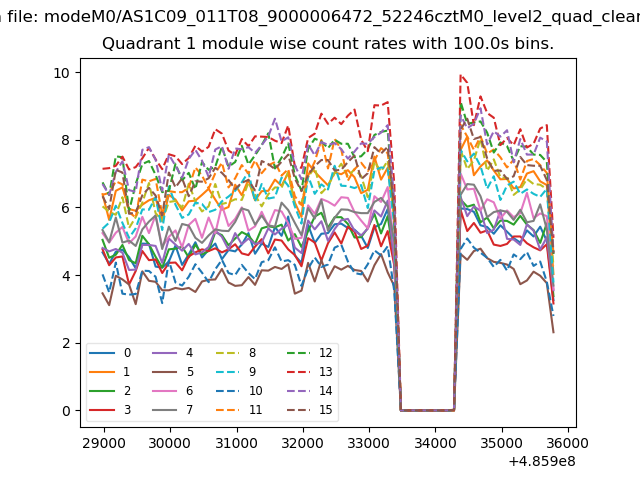
| Module-wise count rates for Quadrant A Data is divided into 100 sec bins |
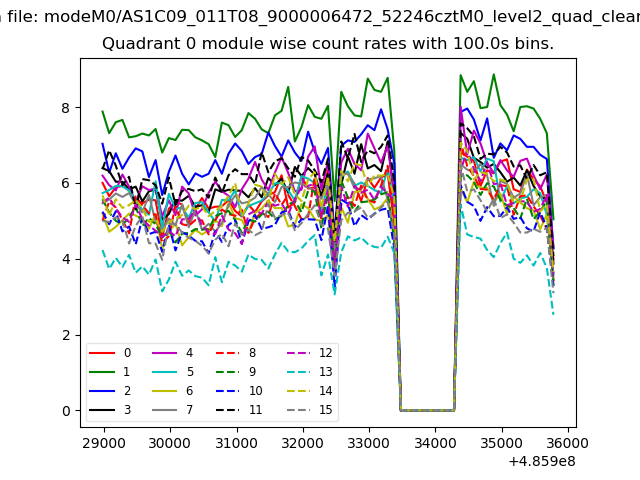 |
 |
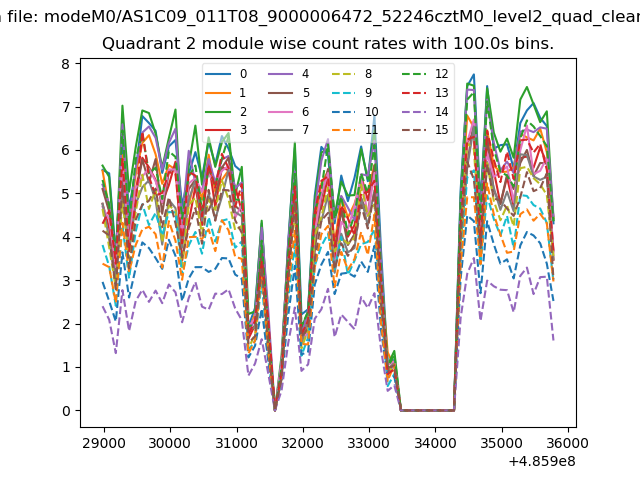
| Module-wise count rates for Quadrant B Data is divided into 100 sec bins |
 |
 |
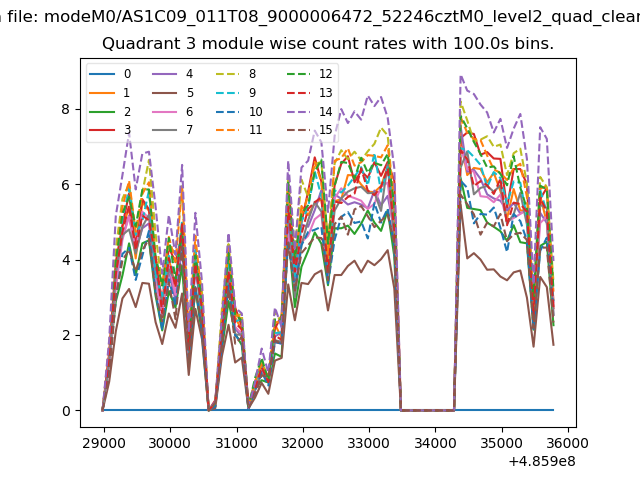
| Module-wise count rates for Quadrant C Data is divided into 100 sec bins |
 |
 |
| Module-wise count rates for Quadrant D Data is divided into 100 sec bins |
 |
 |
| Parameter | Plot |
|---|---|
| CZT HV Monitor | 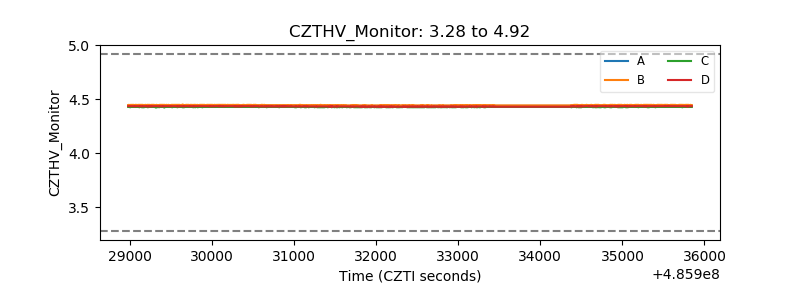 |
| D_VDD | 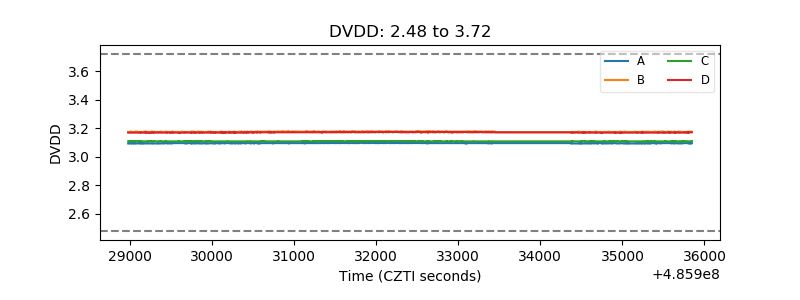 |
| Temperature 1 | 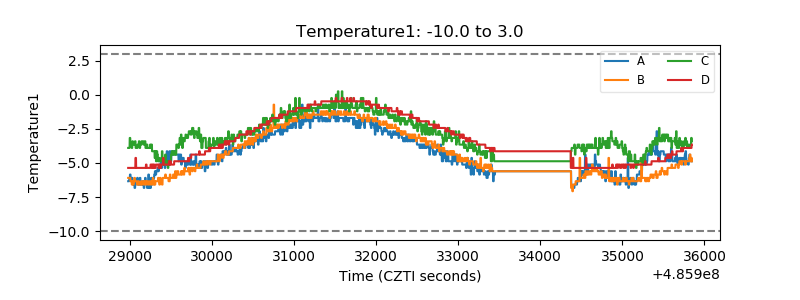 |
| Veto HV Monitor | 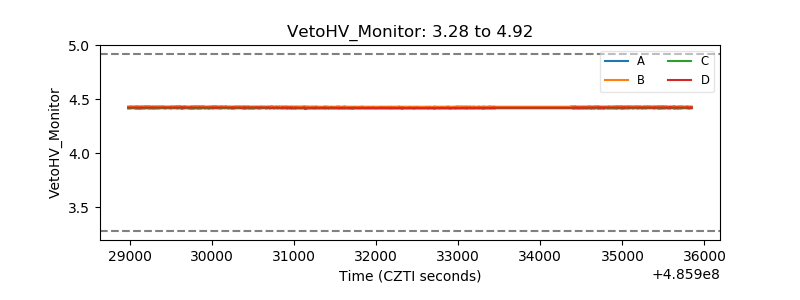 |
| Veto LLD | 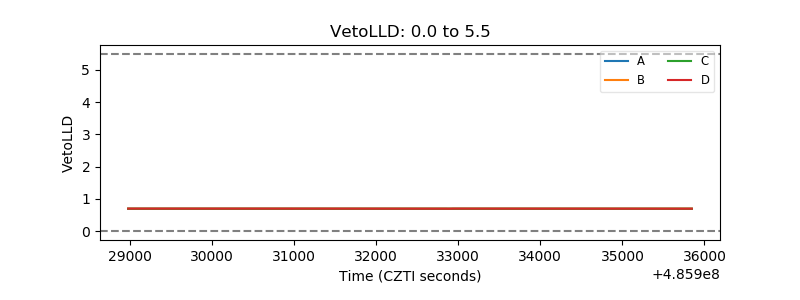 |
| Alpha Counter | 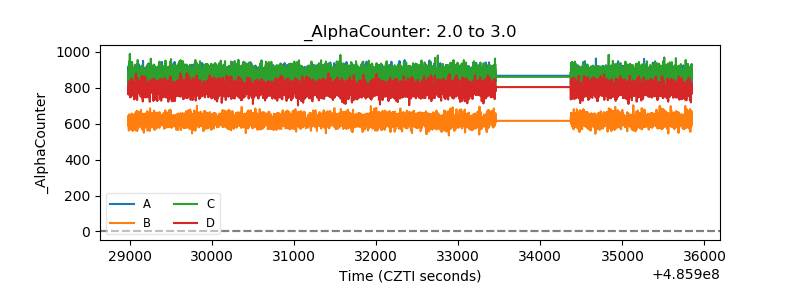 |
| _CPM_Rate | 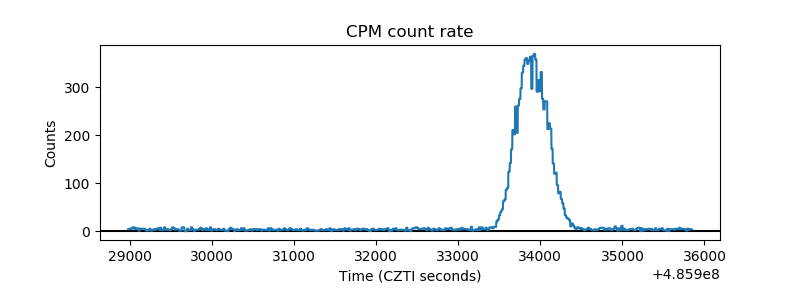 |
| CZT Counter | 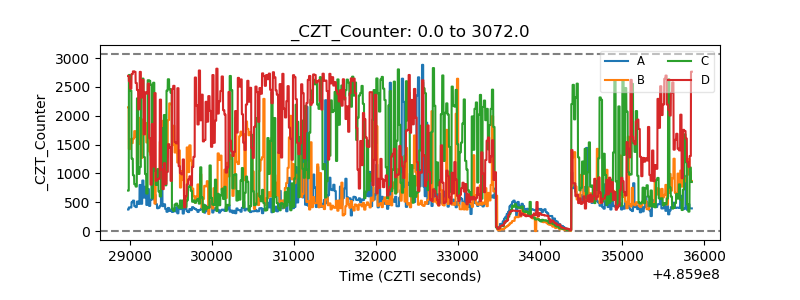 |
| +2.5 Volts monitor | 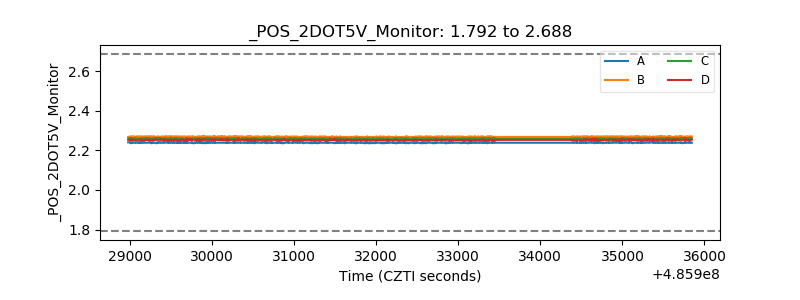 |
| +5 Volts monitor |  |
| _ROLL_ROT | 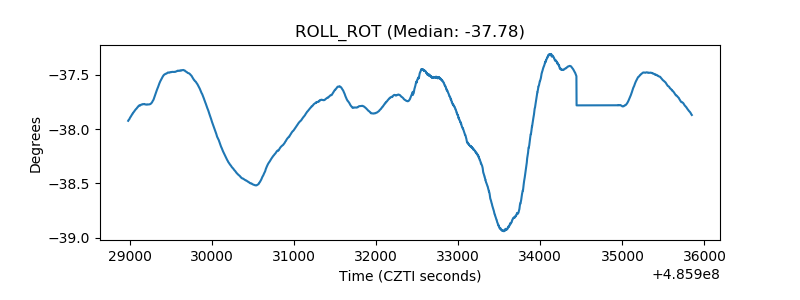 |
| _Roll_DEC |  |
| _Roll_RA | 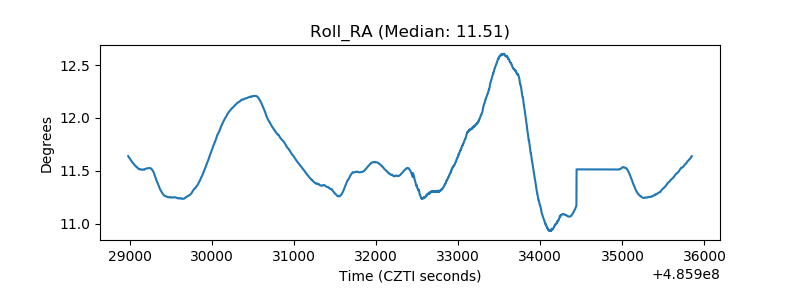 |
| Veto Counter | 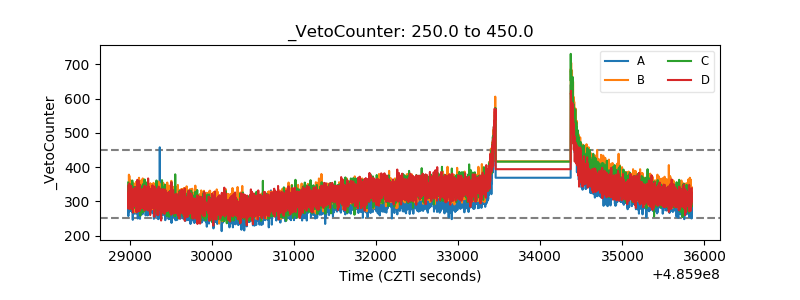 |