| Param | Original file | Final file |
|---|---|---|
| Filename | modeM0/AS1C09_011T08_9000006472_52251cztM0_level2.fits | modeM0/AS1C09_011T08_9000006472_52251cztM0_level2_quad_clean.evt |
| Size (bytes) | 687,096,000 | 91,998,720 |
| Size | 655.3 MB | 87.7 MB |
| Events in quadrant A | 4,624,674 | 634,862 |
| Events in quadrant B | 5,581,682 | 634,769 |
| Events in quadrant C | 8,635,766 | 511,732 |
| Events in quadrant D | 6,077,472 | 540,056 |
| Mode M0 | |||
|---|---|---|---|
| Quadrant | BADHDUFLAG | Total packets | Discarded packets |
| A | 0 | 18215 | 1 |
| B | 0 | 21191 | 1 |
| C | 0 | 30265 | 1 |
| D | 0 | 22653 | 1 |
| Mode M9 | |||
|---|---|---|---|
| Quadrant | BADHDUFLAG | Total packets | Discarded packets |
| A | 0 | 10 | 0 |
| B | 0 | 10 | 0 |
| C | 0 | 10 | 0 |
| D | 0 | 10 | 0 |
| Mode SS | |||
|---|---|---|---|
| Quadrant | BADHDUFLAG | Total packets | Discarded packets |
| A | 0 | 136 | 0 |
| B | 0 | 136 | 0 |
| C | 0 | 136 | 0 |
| D | 0 | 136 | 0 |
| Quadrant | Total seconds | Saturated seconds | Saturation percentage |
|---|---|---|---|
| A | 6649 | 243 | 3.654685% |
| B | 6650 | 760 | 11.428571% |
| C | 6650 | 1535 | 23.082707% |
| D | 6650 | 623 | 9.368421% |
Noise dominated data is calculated using 1-second bins in cleaned event files. If a bin has >2000 counts, and if more than 50% of those come from <1% of pixels, then it is considered to be noise-dominated and hence unusable.
| Quadrant | # 1 sec bins | Bins with >0 counts | Bins with >2000 counts | High rate bins dominated by noise | Noise dominated (total time) | Noise dominated (detector-on time) | Marked lightcurve |
|---|---|---|---|---|---|---|---|
| A | 7709 | 6650 | 122 | 122 | 1.58% | 1.83% | 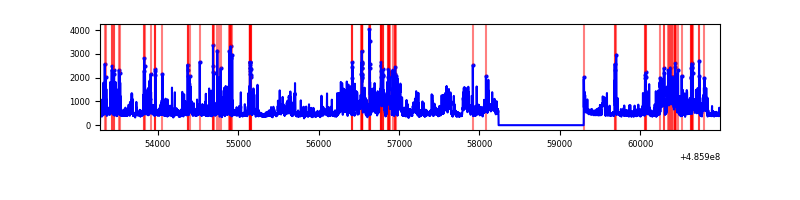 |
| B | 7710 | 6651 | 460 | 460 | 5.97% | 6.92% | 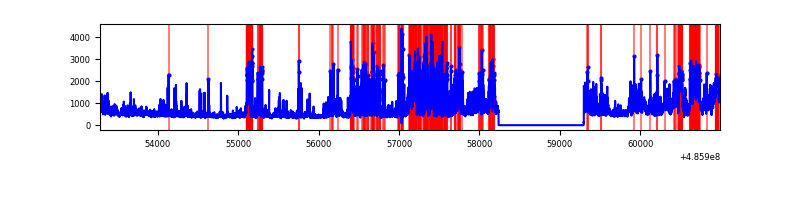 |
| C | 7710 | 6651 | 1302 | 1302 | 16.89% | 19.58% | 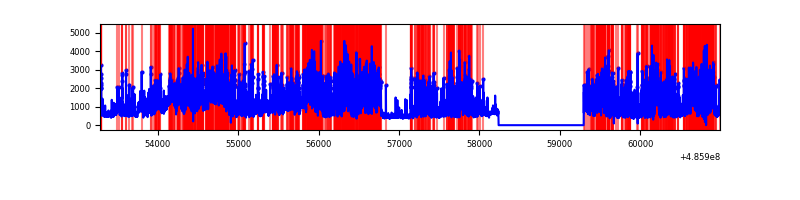 |
| D | 7710 | 6651 | 560 | 560 | 7.26% | 8.42% | 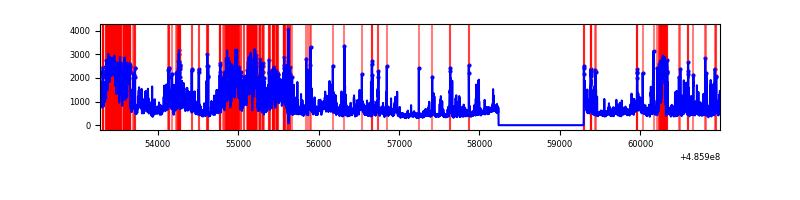 |
Top three noisy pixels from each quadrant. If the there are fewer than three noisy pixels in the level2.evt file, extra rows are filled as -1
| Pixel properties | Quadrant properties | ||||||
|---|---|---|---|---|---|---|---|
| Quadrant | DetID | PixID | Counts | Sigma | Mean | Median | Sigma |
| A | 12 | 3 | 686540 | 3950.59 | 702 | 686 | 173.6 |
| A | 5 | 240 | 194877 | 1118.56 | 702 | 686 | 173.6 |
| A | 15 | 174 | 186546 | 1070.57 | 702 | 686 | 173.6 |
| B | 12 | 32 | 1043376 | 7370.01 | 668 | 644 | 141.5 |
| B | 4 | 81 | 275475 | 1942.5 | 668 | 644 | 141.5 |
| B | 10 | 254 | 246556 | 1738.1 | 668 | 644 | 141.5 |
| C | 15 | 224 | 4421303 | 25709.49 | 625 | 618 | 171.9 |
| C | 9 | 38 | 721344 | 4191.54 | 625 | 618 | 171.9 |
| C | 15 | 189 | 186114 | 1078.79 | 625 | 618 | 171.9 |
| D | 6 | 42 | 2051161 | 10946.04 | 663 | 634 | 187.3 |
| D | 8 | 176 | 854531 | 4558.24 | 663 | 634 | 187.3 |
| D | 7 | 96 | 98634 | 523.14 | 663 | 634 | 187.3 |
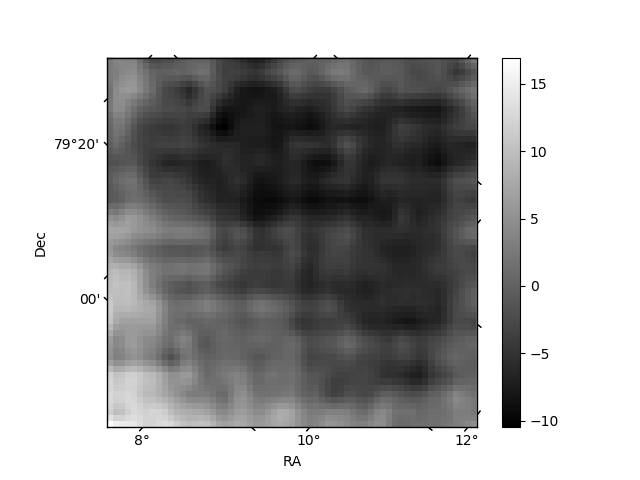
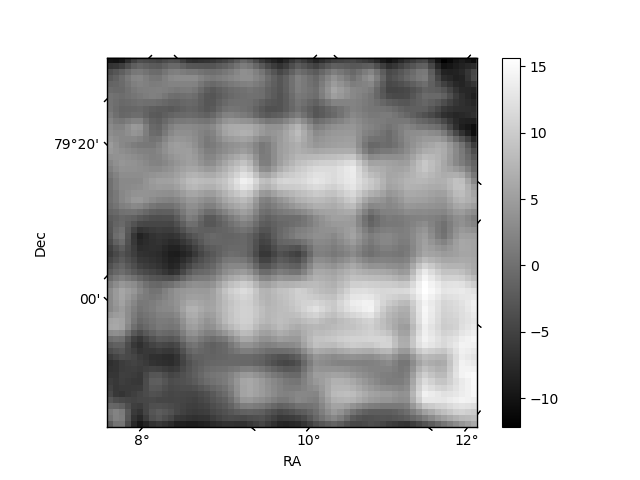
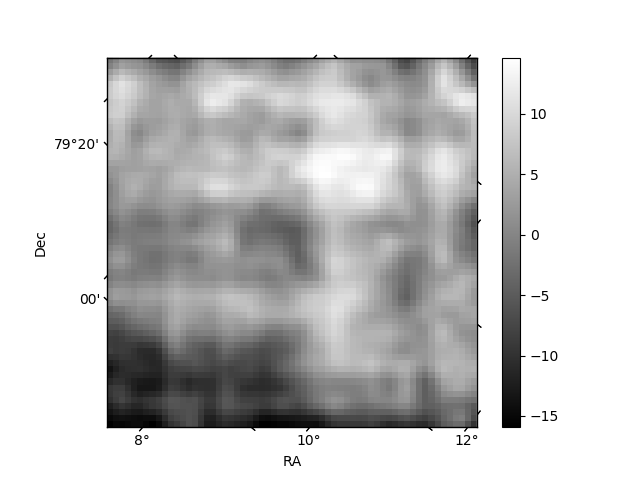
Histogram calculated using DETX and DETY for each event in the final _common_clean file
| Quadrant A | 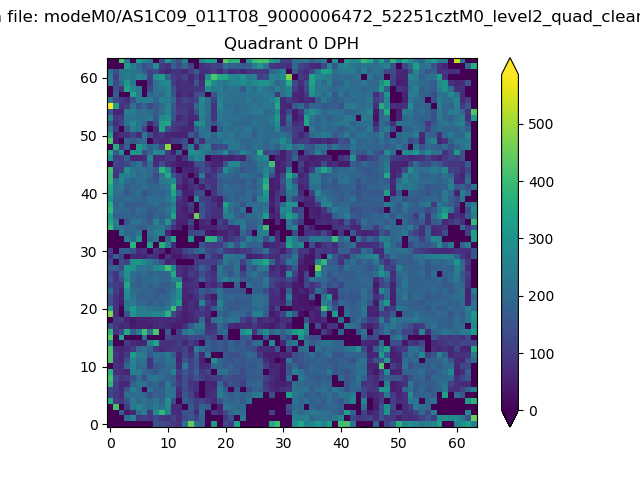 |
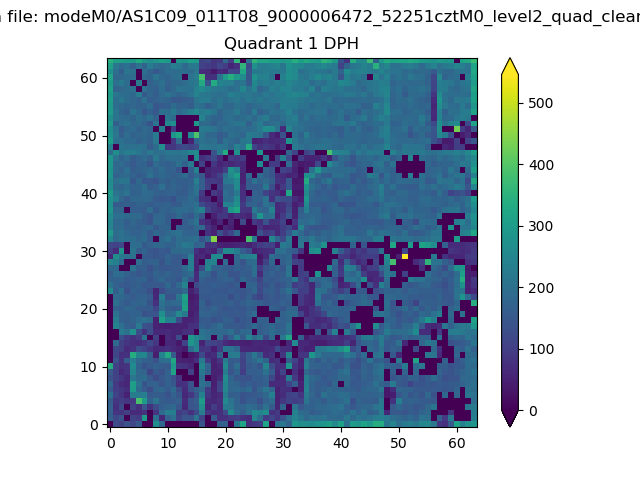 |
Quadrant B |
|---|---|---|---|
| Quadrant D | 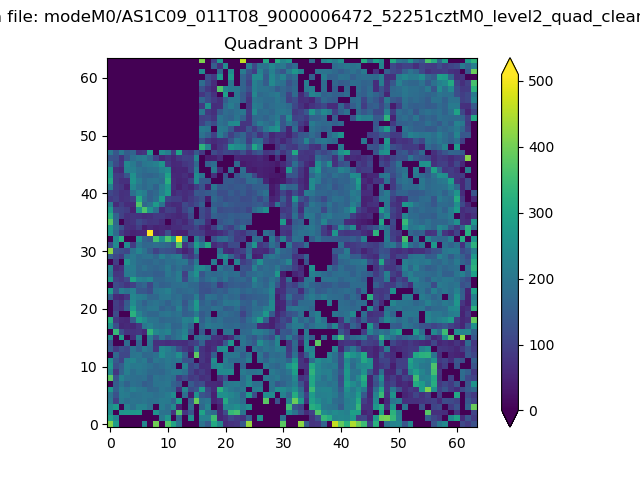 |
 |
Quadrant C |
| Plot type | Count rate plots | Images |
|---|---|---|
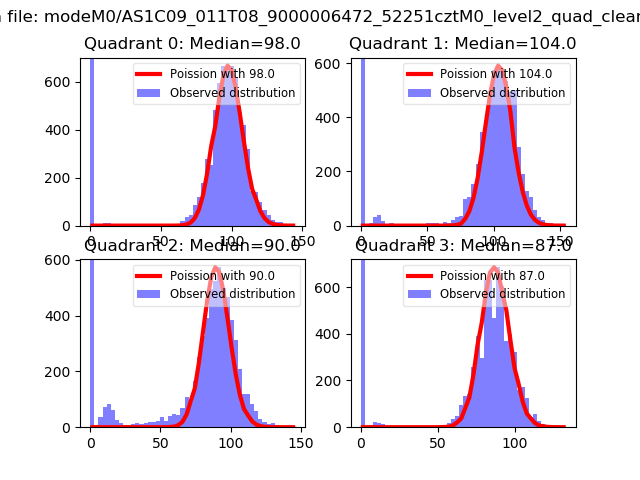
| Comparison with Poisson distribution Blue bars denote a histogram of data divided into 1 sec bins. Red curve is a Poisson curve with rate = median count rate of data. |
 |
 |
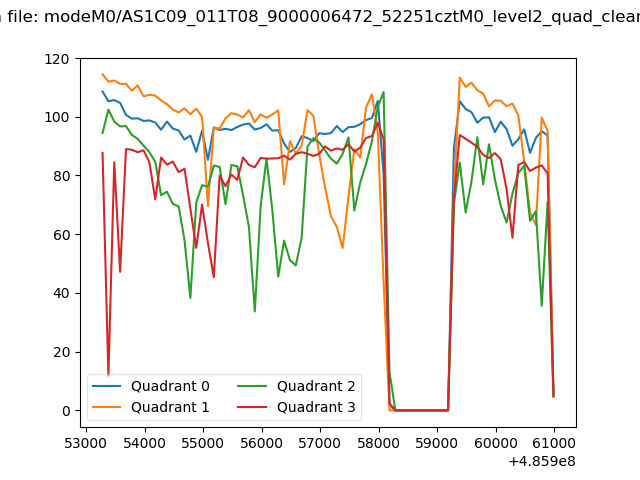
| Quadrant-wise count rates Data is divided into 100 sec bins |
 |
|
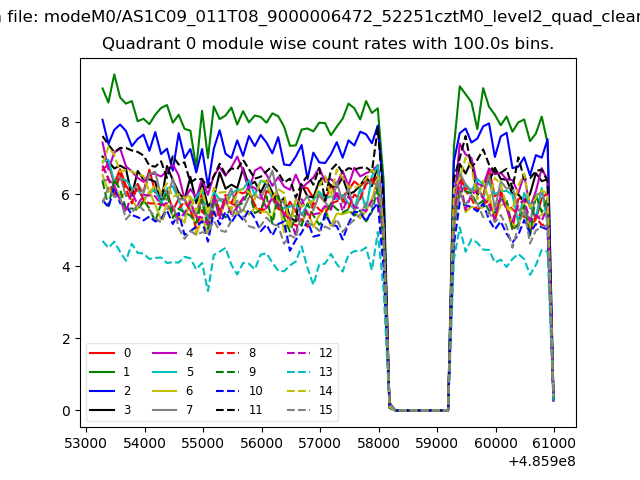
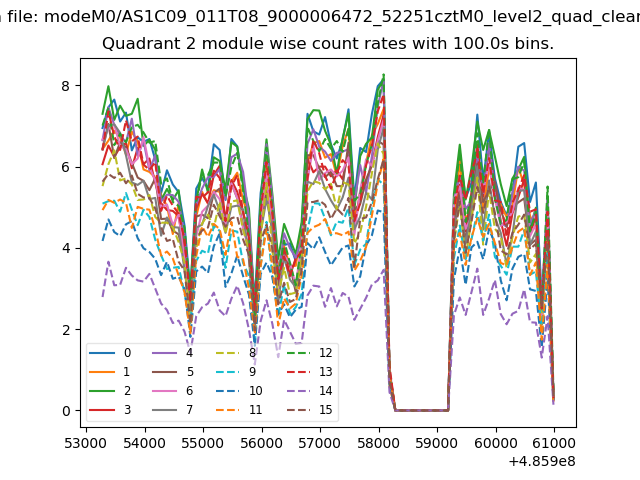
| Module-wise count rates for Quadrant A Data is divided into 100 sec bins |
 |
 |
| Module-wise count rates for Quadrant B Data is divided into 100 sec bins |
 |
 |
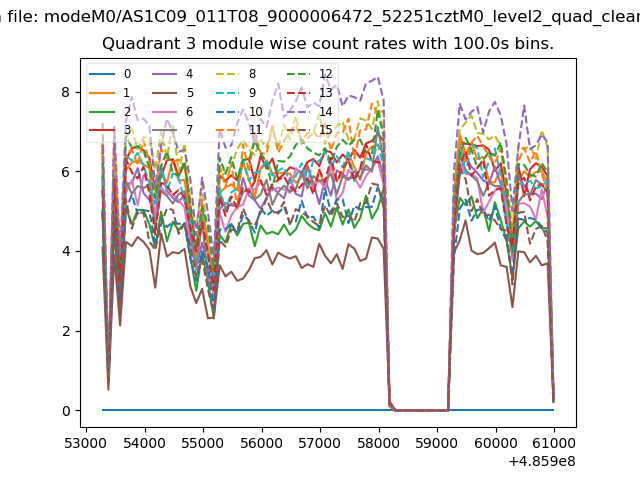
| Module-wise count rates for Quadrant C Data is divided into 100 sec bins |
 |
 |
| Module-wise count rates for Quadrant D Data is divided into 100 sec bins |
 |
 |
| Parameter | Plot |
|---|---|
| CZT HV Monitor | 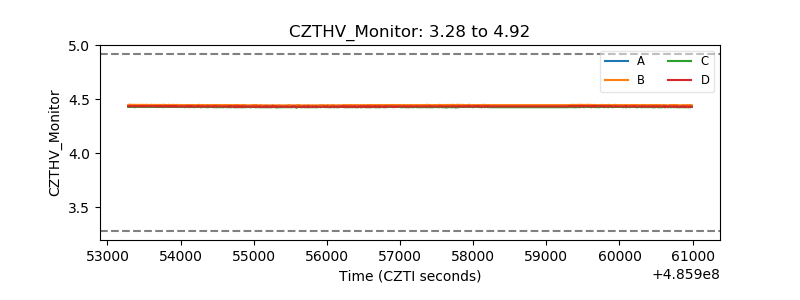 |
| D_VDD | 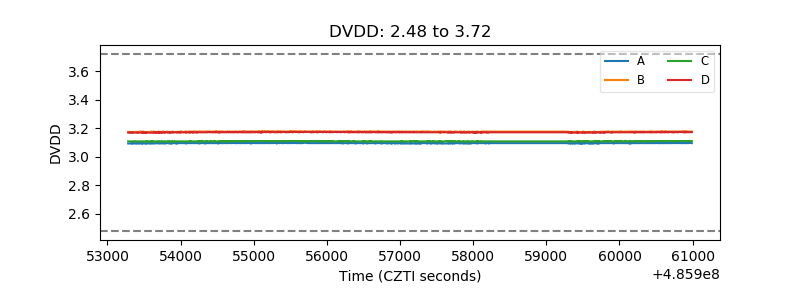 |
| Temperature 1 | 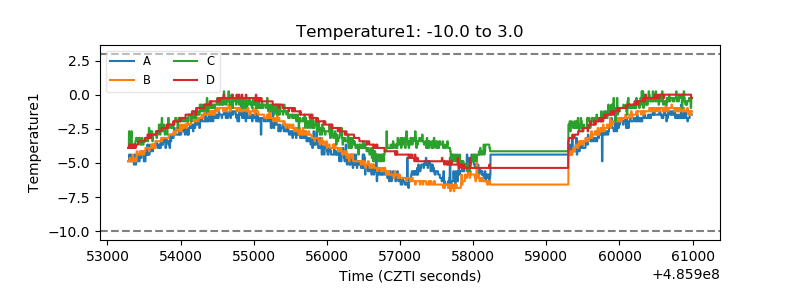 |
| Veto HV Monitor | 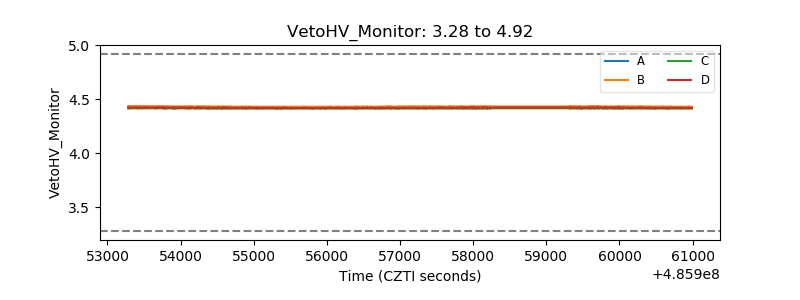 |
| Veto LLD | 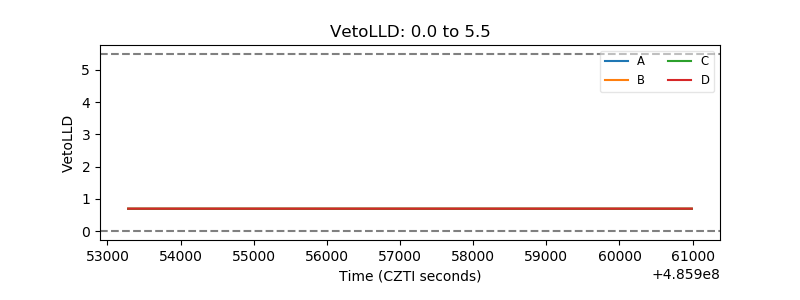 |
| Alpha Counter | 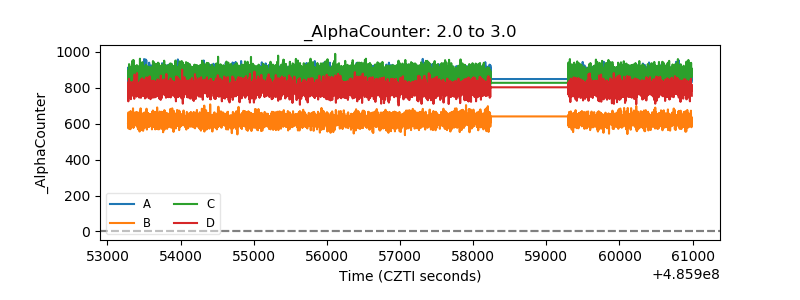 |
| _CPM_Rate | 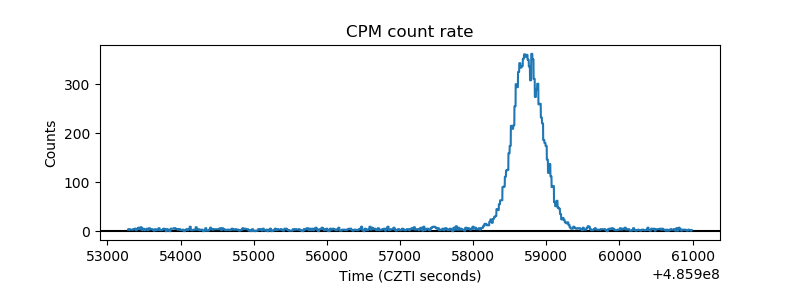 |
| CZT Counter | 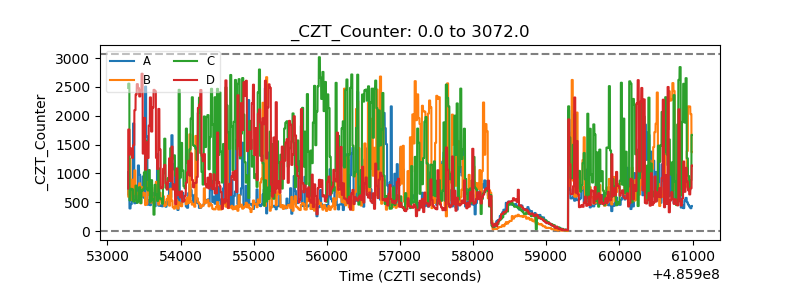 |
| +2.5 Volts monitor |  |
| +5 Volts monitor |  |
| _ROLL_ROT | 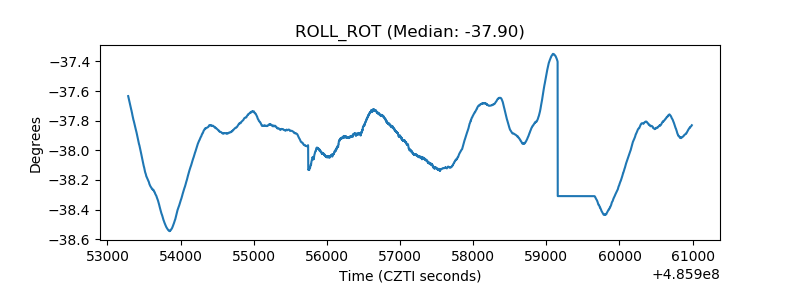 |
| _Roll_DEC | 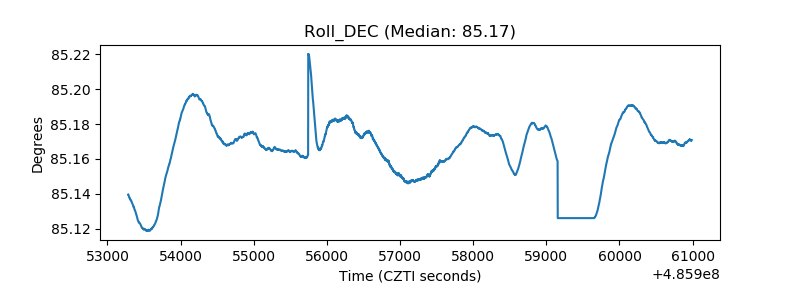 |
| _Roll_RA | 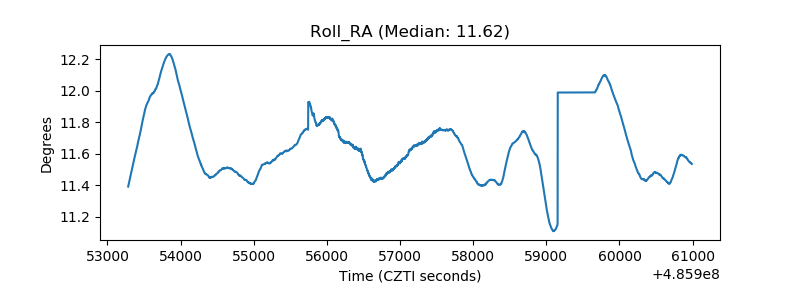 |
| Veto Counter | 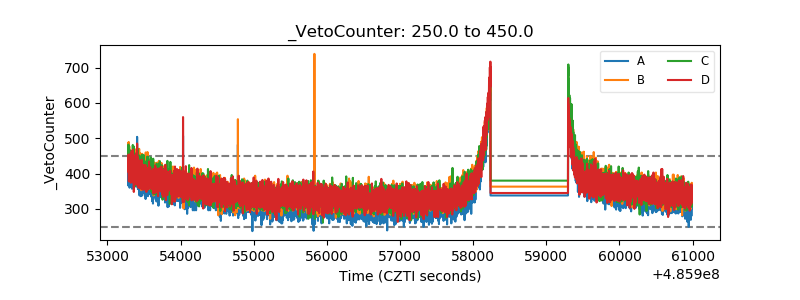 |