| Param | Original file | Final file |
|---|---|---|
| Filename | modeM0/AS1C09_011T08_9000006472_52252cztM0_level2.fits | modeM0/AS1C09_011T08_9000006472_52252cztM0_level2_quad_clean.evt |
| Size (bytes) | 737,948,160 | 86,256,000 |
| Size | 703.8 MB | 82.3 MB |
| Events in quadrant A | 4,845,400 | 607,607 |
| Events in quadrant B | 7,454,143 | 546,932 |
| Events in quadrant C | 8,711,446 | 464,124 |
| Events in quadrant D | 5,795,030 | 532,400 |
| Mode M0 | |||
|---|---|---|---|
| Quadrant | BADHDUFLAG | Total packets | Discarded packets |
| A | 0 | 18946 | 4 |
| B | 0 | 26716 | 1 |
| C | 0 | 30424 | 1 |
| D | 0 | 21790 | 1 |
| Mode M9 | |||
|---|---|---|---|
| Quadrant | BADHDUFLAG | Total packets | Discarded packets |
| A | 0 | 9 | 0 |
| B | 0 | 9 | 0 |
| C | 0 | 9 | 0 |
| D | 0 | 9 | 0 |
| Mode SS | |||
|---|---|---|---|
| Quadrant | BADHDUFLAG | Total packets | Discarded packets |
| A | 0 | 134 | 0 |
| B | 0 | 134 | 0 |
| C | 0 | 134 | 0 |
| D | 0 | 134 | 0 |
| Quadrant | Total seconds | Saturated seconds | Saturation percentage |
|---|---|---|---|
| A | 6598 | 302 | 4.577145% |
| B | 6598 | 1484 | 22.491664% |
| C | 6598 | 1832 | 27.765990% |
| D | 6599 | 532 | 8.061828% |
Noise dominated data is calculated using 1-second bins in cleaned event files. If a bin has >2000 counts, and if more than 50% of those come from <1% of pixels, then it is considered to be noise-dominated and hence unusable.
| Quadrant | # 1 sec bins | Bins with >0 counts | Bins with >2000 counts | High rate bins dominated by noise | Noise dominated (total time) | Noise dominated (detector-on time) | Marked lightcurve |
|---|---|---|---|---|---|---|---|
| A | 7543 | 6599 | 157 | 157 | 2.08% | 2.38% | 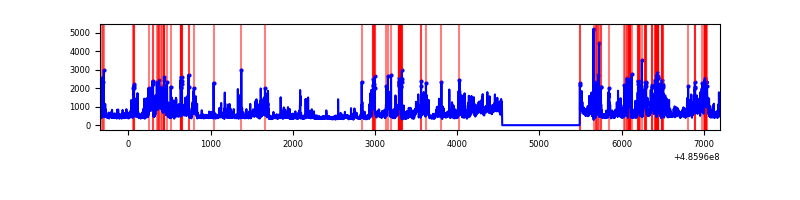 |
| B | 7543 | 6599 | 985 | 985 | 13.06% | 14.93% | 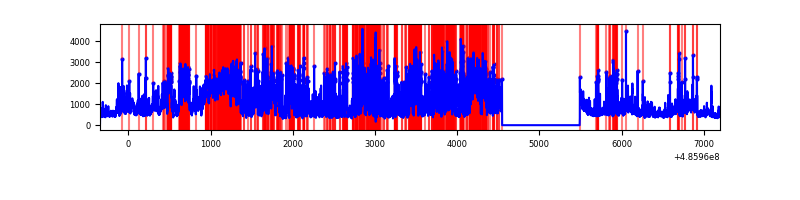 |
| C | 7543 | 6599 | 1453 | 1453 | 19.26% | 22.02% | 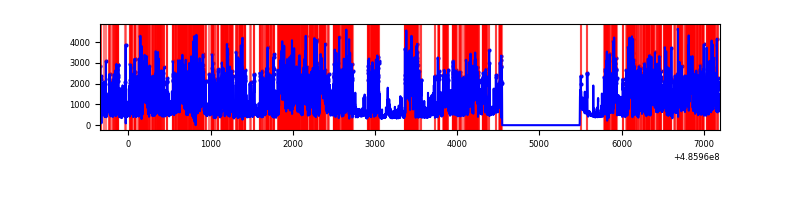 |
| D | 7544 | 6600 | 453 | 453 | 6.00% | 6.86% | 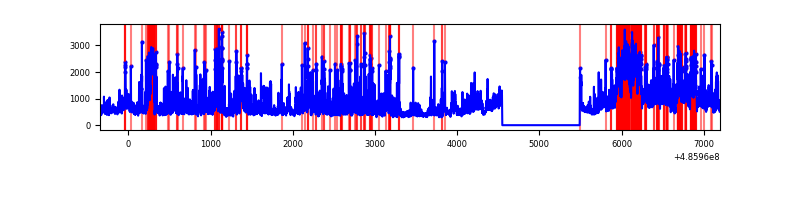 |
Top three noisy pixels from each quadrant. If the there are fewer than three noisy pixels in the level2.evt file, extra rows are filled as -1
| Pixel properties | Quadrant properties | ||||||
|---|---|---|---|---|---|---|---|
| Quadrant | DetID | PixID | Counts | Sigma | Mean | Median | Sigma |
| A | 12 | 3 | 1216406 | 7147.77 | 683 | 667 | 170.1 |
| A | 12 | 194 | 147521 | 863.41 | 683 | 667 | 170.1 |
| A | 3 | 79 | 120969 | 707.3 | 683 | 667 | 170.1 |
| B | 12 | 32 | 2359293 | 17840.41 | 622 | 600 | 132.2 |
| B | 10 | 254 | 790099 | 5971.52 | 622 | 600 | 132.2 |
| B | 4 | 171 | 513423 | 3878.83 | 622 | 600 | 132.2 |
| C | 15 | 224 | 4496767 | 27225.12 | 592 | 582 | 165.1 |
| C | 15 | 231 | 457932 | 2769.33 | 592 | 582 | 165.1 |
| C | 15 | 189 | 226734 | 1369.39 | 592 | 582 | 165.1 |
| D | 6 | 42 | 1328139 | 7211.42 | 653 | 625 | 184.1 |
| D | 8 | 176 | 1013177 | 5500.46 | 653 | 625 | 184.1 |
| D | 12 | 1 | 230189 | 1247.05 | 653 | 625 | 184.1 |
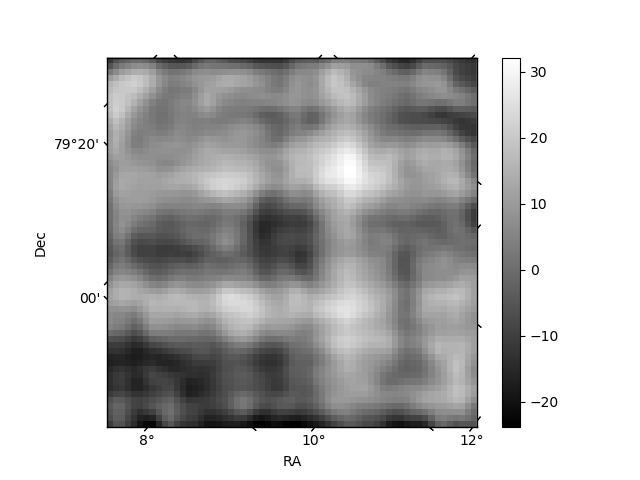
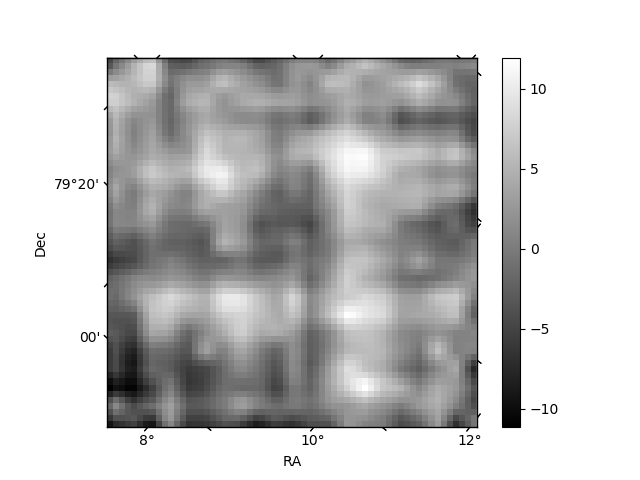
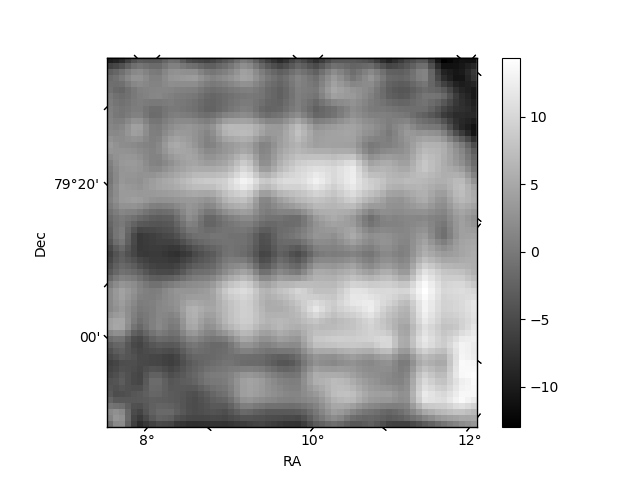
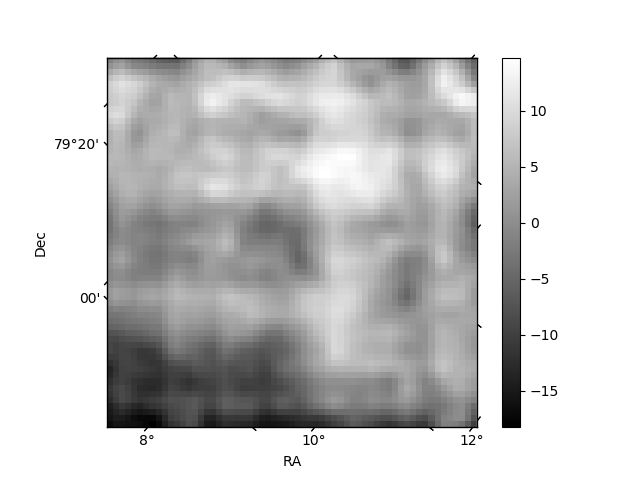
Histogram calculated using DETX and DETY for each event in the final _common_clean file
| Quadrant A | 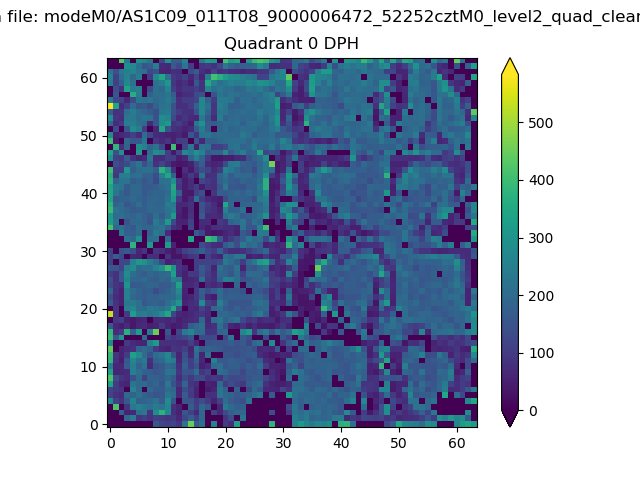 |
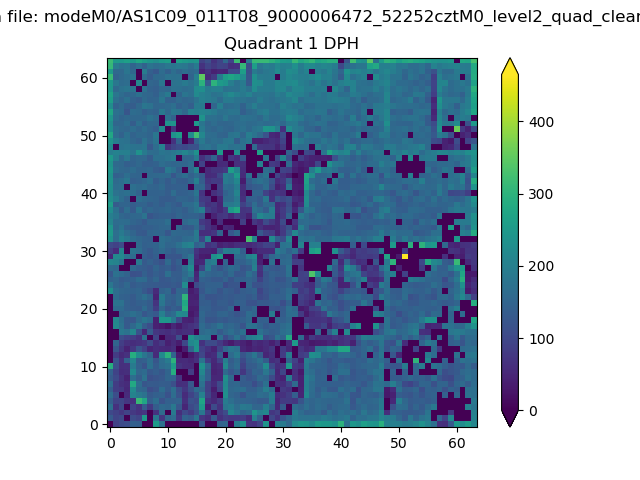 |
Quadrant B |
|---|---|---|---|
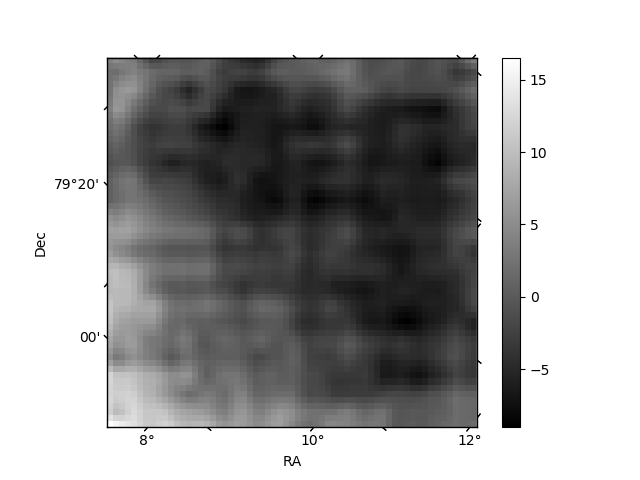
| Quadrant D | 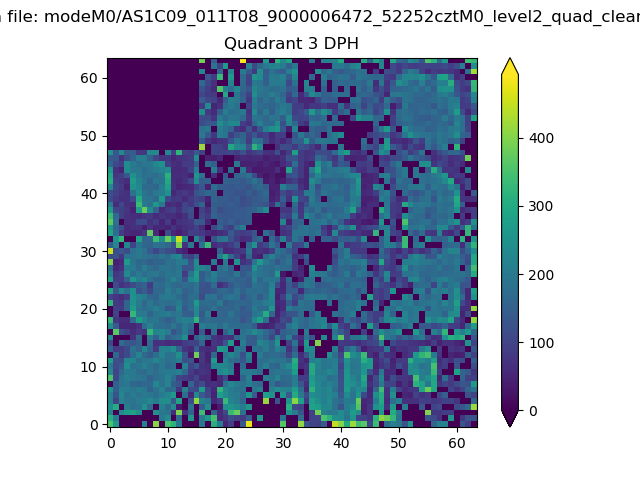 |
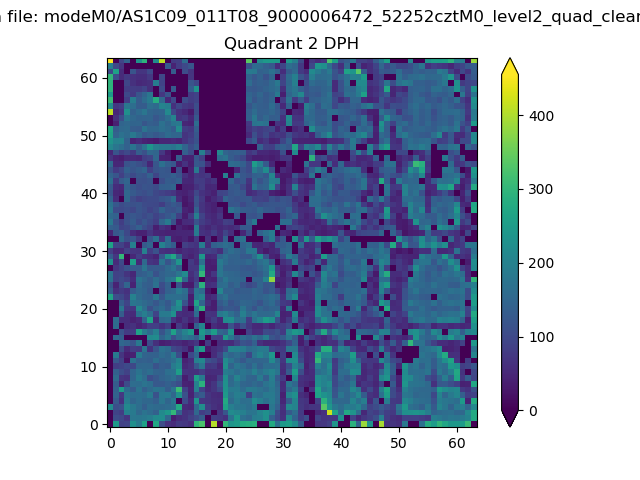 |
Quadrant C |
| Plot type | Count rate plots | Images |
|---|---|---|
| Comparison with Poisson distribution Blue bars denote a histogram of data divided into 1 sec bins. Red curve is a Poisson curve with rate = median count rate of data. |
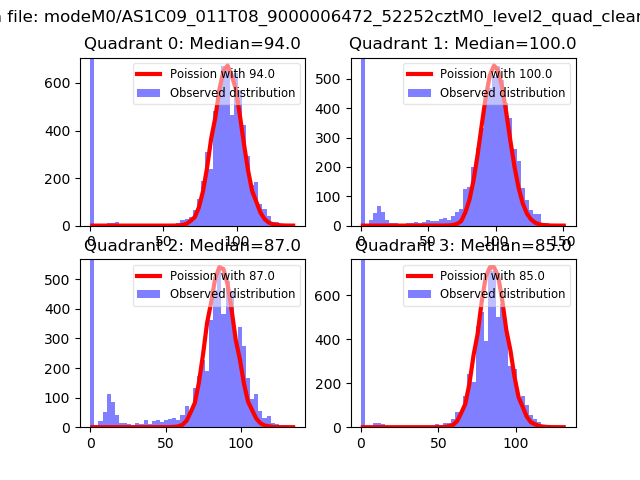 |
 |
| Quadrant-wise count rates Data is divided into 100 sec bins |
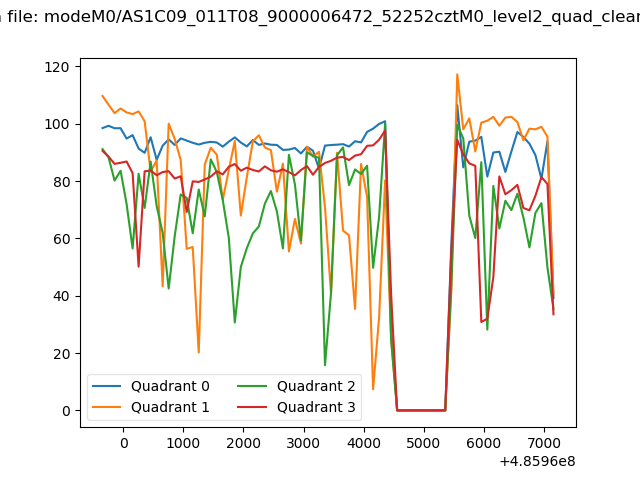 |
|
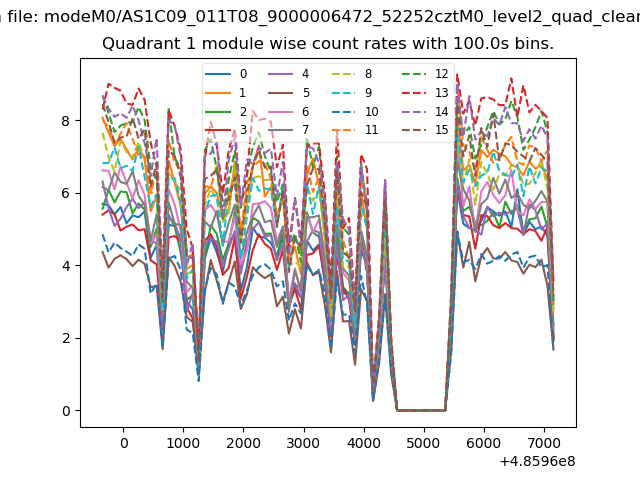
| Module-wise count rates for Quadrant A Data is divided into 100 sec bins |
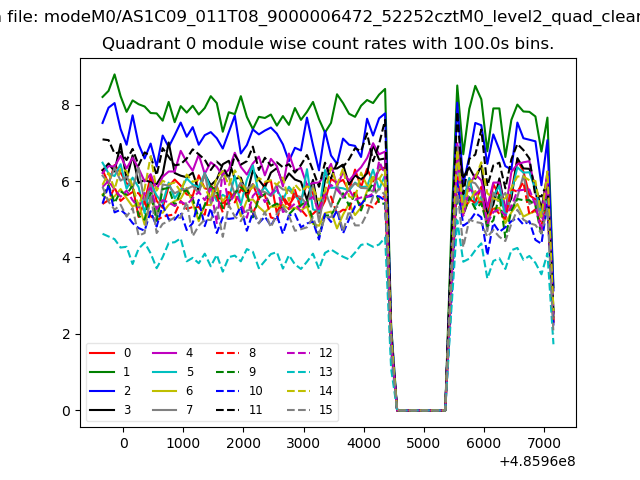 |
 |
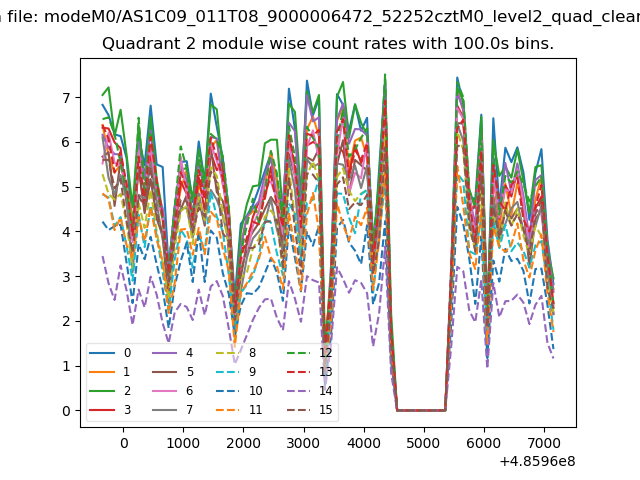
| Module-wise count rates for Quadrant B Data is divided into 100 sec bins |
 |
 |
| Module-wise count rates for Quadrant C Data is divided into 100 sec bins |
 |
 |
| Module-wise count rates for Quadrant D Data is divided into 100 sec bins |
 |
 |
| Parameter | Plot |
|---|---|
| CZT HV Monitor |  |
| D_VDD | 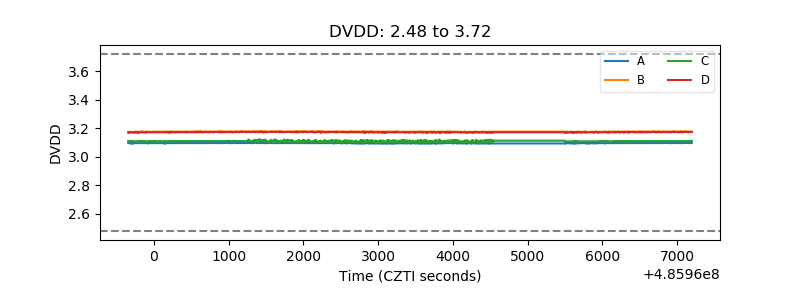 |
| Temperature 1 | 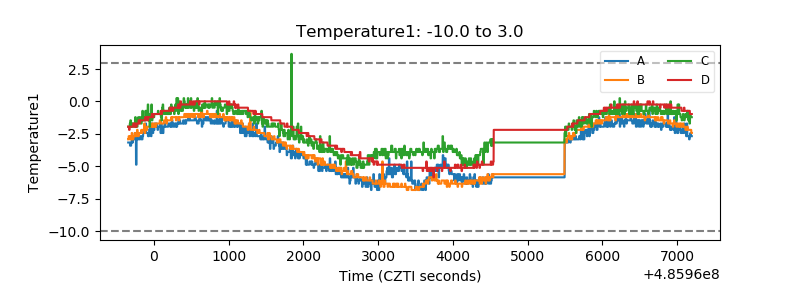 |
| Veto HV Monitor | 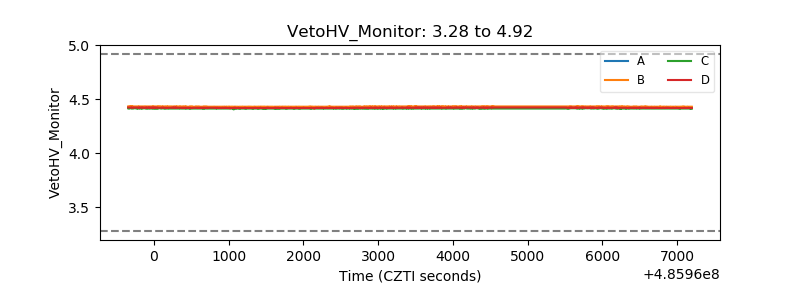 |
| Veto LLD | 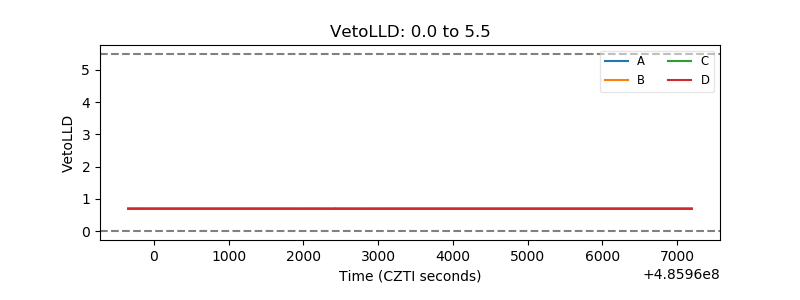 |
| Alpha Counter | 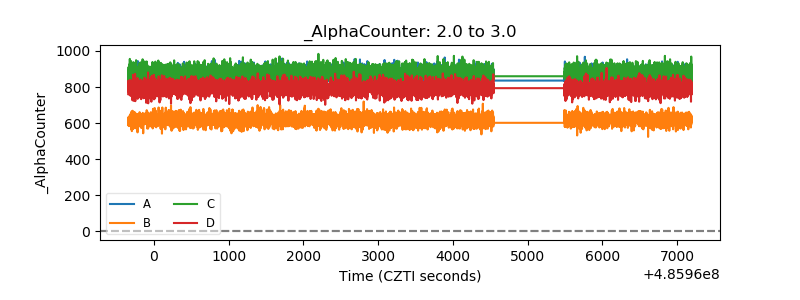 |
| _CPM_Rate | 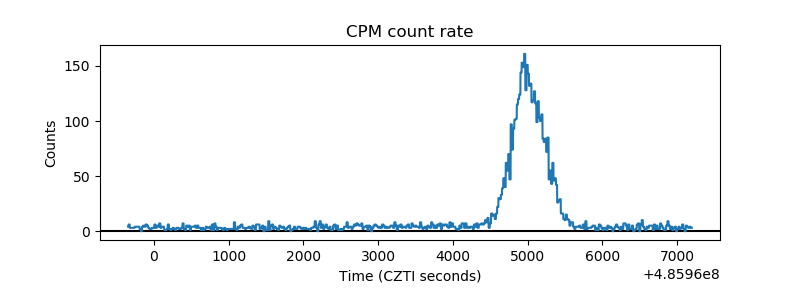 |
| CZT Counter | 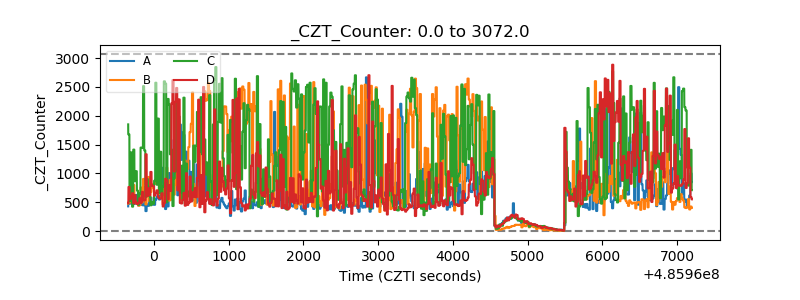 |
| +2.5 Volts monitor |  |
| +5 Volts monitor |  |
| _ROLL_ROT | 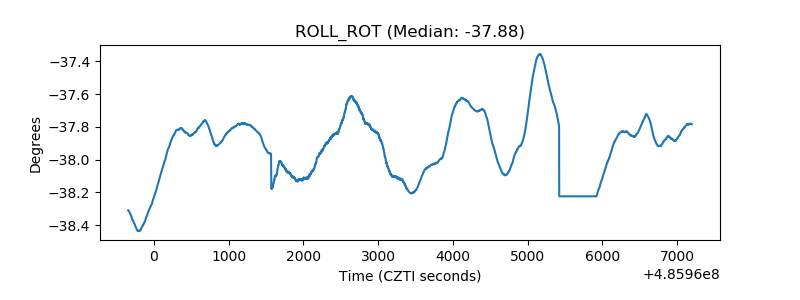 |
| _Roll_DEC | 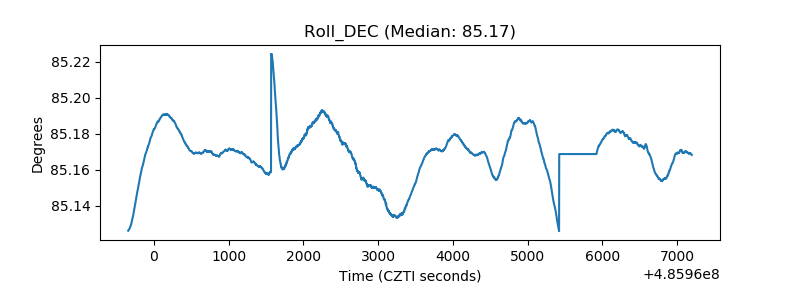 |
| _Roll_RA | 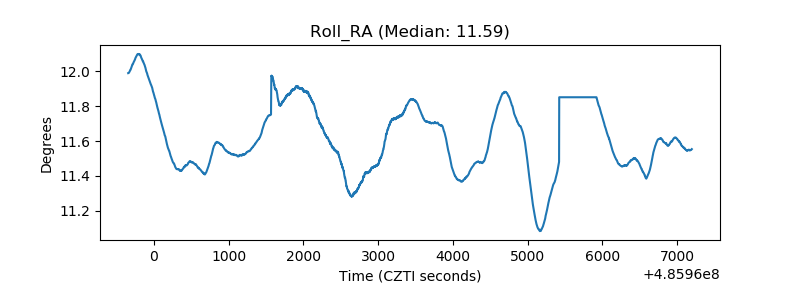 |
| Veto Counter | 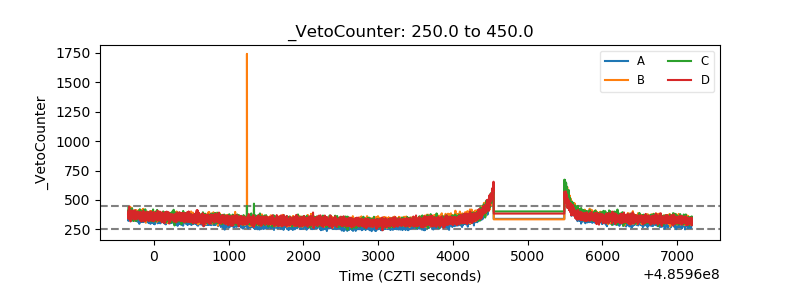 |