| Param | Original file | Final file |
|---|---|---|
| Filename | modeM0/AS1C09_011T08_9000006472_52253cztM0_level2.fits | modeM0/AS1C09_011T08_9000006472_52253cztM0_level2_quad_clean.evt |
| Size (bytes) | 733,780,800 | 87,874,560 |
| Size | 699.8 MB | 83.8 MB |
| Events in quadrant A | 4,634,387 | 609,603 |
| Events in quadrant B | 7,263,626 | 560,879 |
| Events in quadrant C | 8,221,895 | 501,037 |
| Events in quadrant D | 6,523,360 | 521,376 |
| Mode M0 | |||
|---|---|---|---|
| Quadrant | BADHDUFLAG | Total packets | Discarded packets |
| A | 0 | 18476 | 1 |
| B | 0 | 26290 | 1 |
| C | 0 | 29096 | 1 |
| D | 0 | 24085 | 4 |
| Mode M9 | |||
|---|---|---|---|
| Quadrant | BADHDUFLAG | Total packets | Discarded packets |
| A | 0 | 7 | 0 |
| B | 0 | 7 | 0 |
| C | 0 | 7 | 0 |
| D | 0 | 7 | 0 |
| Mode SS | |||
|---|---|---|---|
| Quadrant | BADHDUFLAG | Total packets | Discarded packets |
| A | 0 | 136 | 0 |
| B | 0 | 136 | 0 |
| C | 0 | 136 | 0 |
| D | 0 | 136 | 0 |
| Quadrant | Total seconds | Saturated seconds | Saturation percentage |
|---|---|---|---|
| A | 6709 | 282 | 4.203309% |
| B | 6710 | 1379 | 20.551416% |
| C | 6710 | 1444 | 21.520119% |
| D | 6709 | 667 | 9.941869% |
Noise dominated data is calculated using 1-second bins in cleaned event files. If a bin has >2000 counts, and if more than 50% of those come from <1% of pixels, then it is considered to be noise-dominated and hence unusable.
| Quadrant | # 1 sec bins | Bins with >0 counts | Bins with >2000 counts | High rate bins dominated by noise | Noise dominated (total time) | Noise dominated (detector-on time) | Marked lightcurve |
|---|---|---|---|---|---|---|---|
| A | 7349 | 6711 | 167 | 167 | 2.27% | 2.49% | 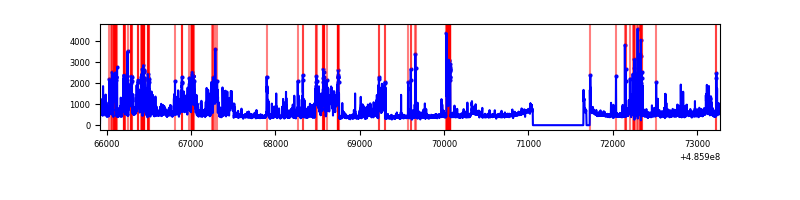 |
| B | 7350 | 6712 | 835 | 835 | 11.36% | 12.44% | 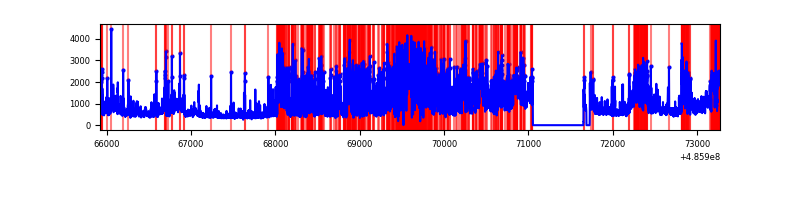 |
| C | 7350 | 6712 | 1133 | 1133 | 15.41% | 16.88% | 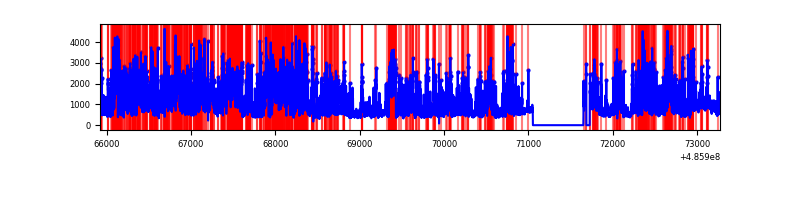 |
| D | 7349 | 6711 | 626 | 626 | 8.52% | 9.33% |  |
Top three noisy pixels from each quadrant. If the there are fewer than three noisy pixels in the level2.evt file, extra rows are filled as -1
| Pixel properties | Quadrant properties | ||||||
|---|---|---|---|---|---|---|---|
| Quadrant | DetID | PixID | Counts | Sigma | Mean | Median | Sigma |
| A | 12 | 3 | 1020255 | 5924.45 | 690 | 671 | 172.1 |
| A | 15 | 250 | 230670 | 1336.44 | 690 | 671 | 172.1 |
| A | 5 | 240 | 137063 | 792.53 | 690 | 671 | 172.1 |
| B | 12 | 32 | 2190415 | 16474.48 | 630 | 608 | 132.9 |
| B | 10 | 254 | 1099883 | 8270.12 | 630 | 608 | 132.9 |
| B | 0 | 213 | 343414 | 2579.01 | 630 | 608 | 132.9 |
| C | 15 | 224 | 3769364 | 22249.19 | 622 | 616 | 169.4 |
| C | 15 | 189 | 340946 | 2009.17 | 622 | 616 | 169.4 |
| C | 15 | 192 | 260420 | 1533.78 | 622 | 616 | 169.4 |
| D | 6 | 42 | 1942889 | 10402.64 | 657 | 627 | 186.7 |
| D | 8 | 176 | 1148003 | 6145.27 | 657 | 627 | 186.7 |
| D | 12 | 128 | 236162 | 1261.51 | 657 | 627 | 186.7 |
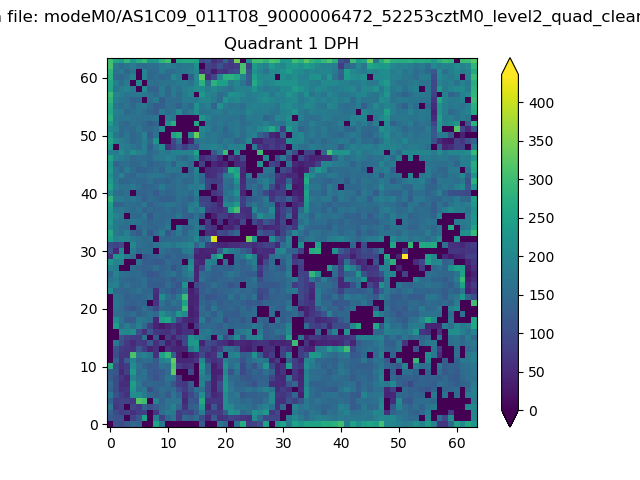
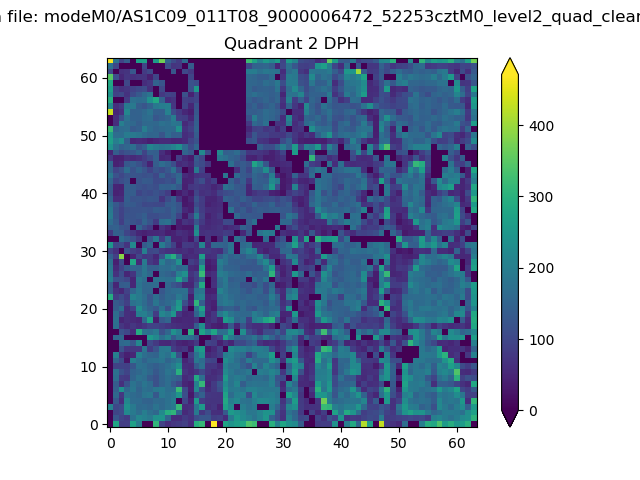
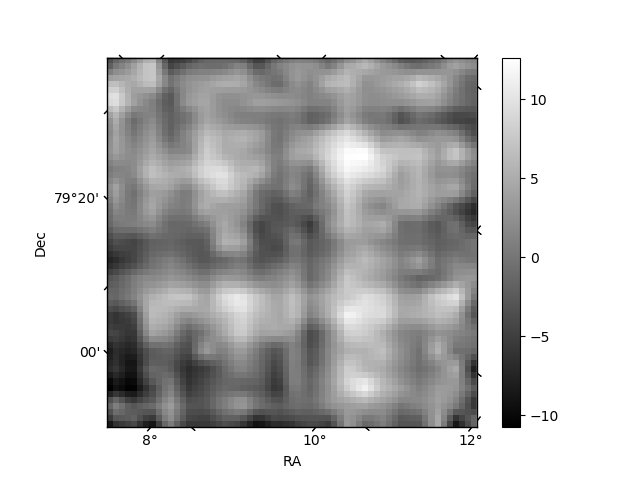
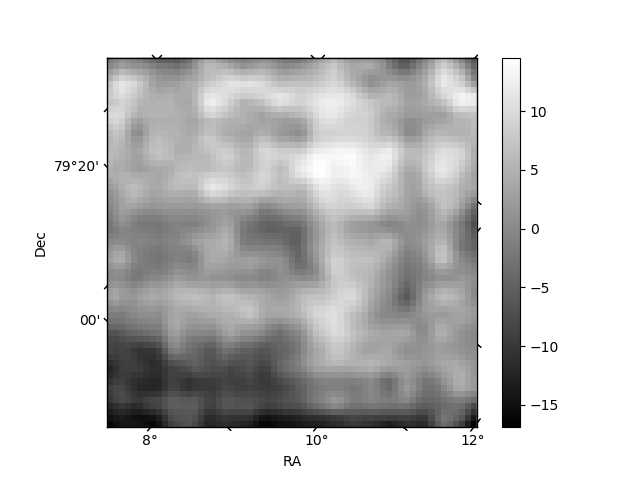
Histogram calculated using DETX and DETY for each event in the final _common_clean file
| Quadrant A | 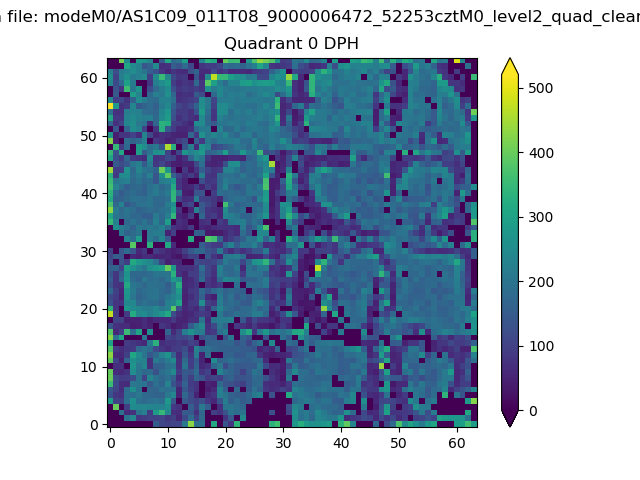 |
 |
Quadrant B |
|---|---|---|---|
| Quadrant D | 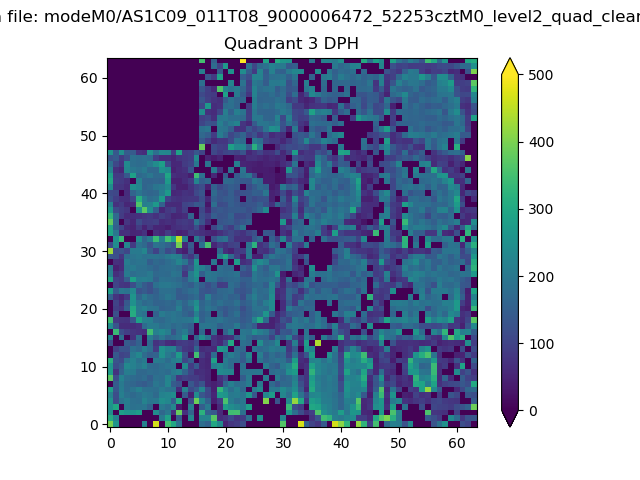 |
 |
Quadrant C |
| Plot type | Count rate plots | Images |
|---|---|---|
| Comparison with Poisson distribution Blue bars denote a histogram of data divided into 1 sec bins. Red curve is a Poisson curve with rate = median count rate of data. |
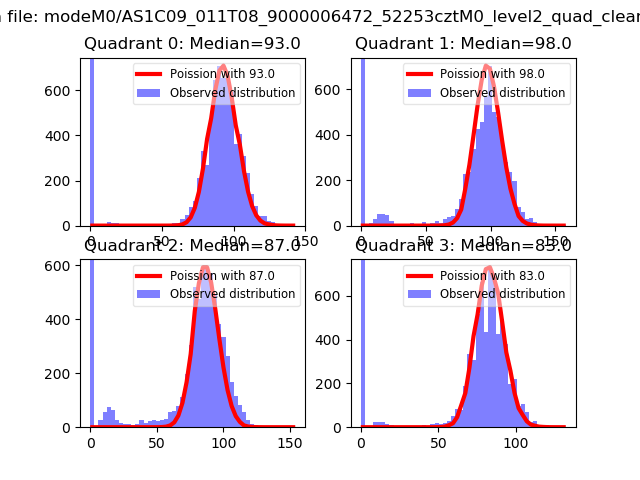 |
 |
| Quadrant-wise count rates Data is divided into 100 sec bins |
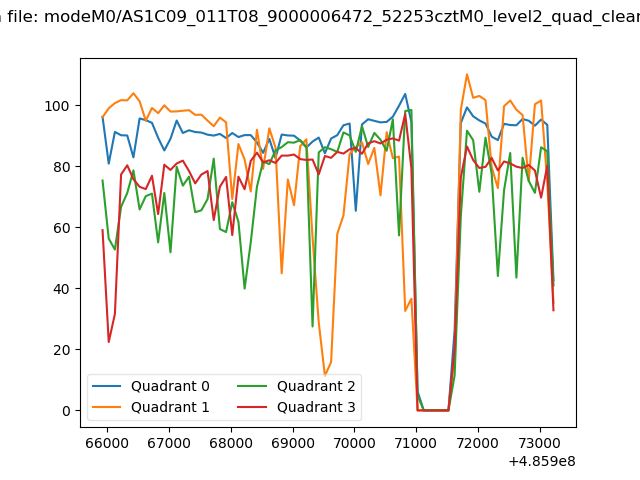 |
|
| Module-wise count rates for Quadrant A Data is divided into 100 sec bins |
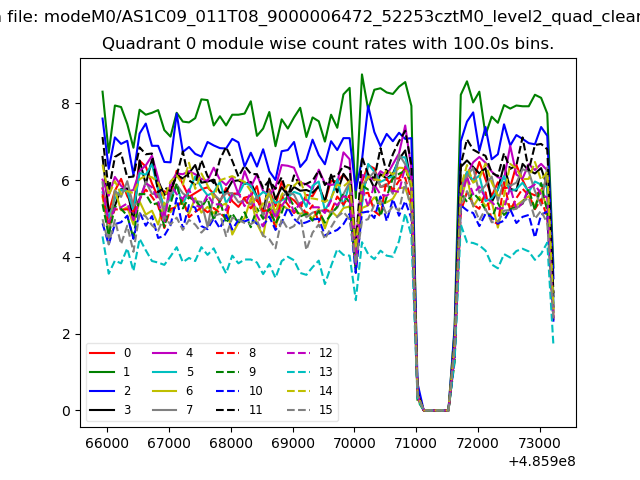 |
 |
| Module-wise count rates for Quadrant B Data is divided into 100 sec bins |
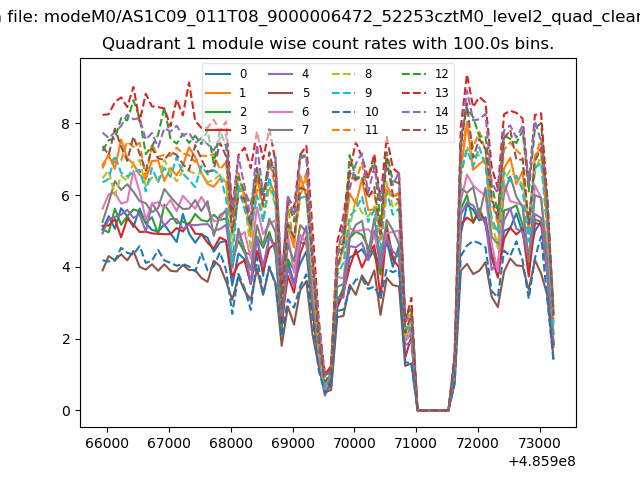 |
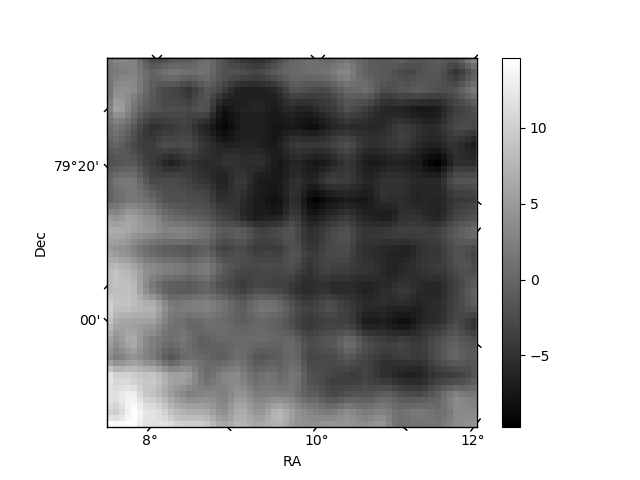 |
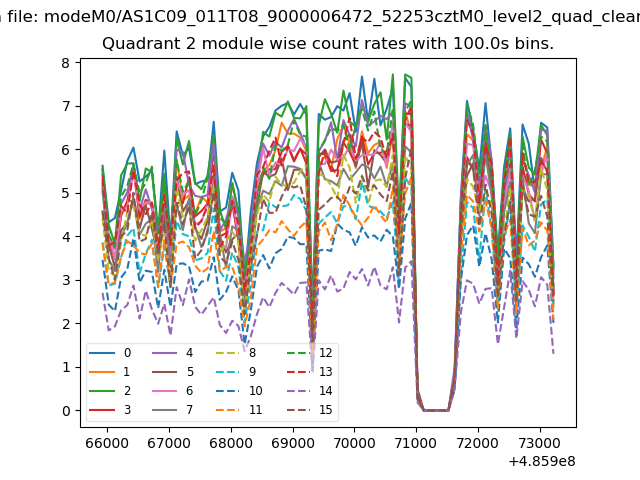
| Module-wise count rates for Quadrant C Data is divided into 100 sec bins |
 |
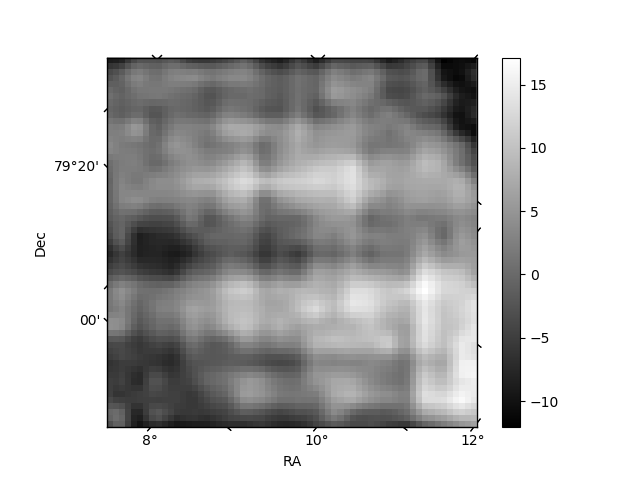 |
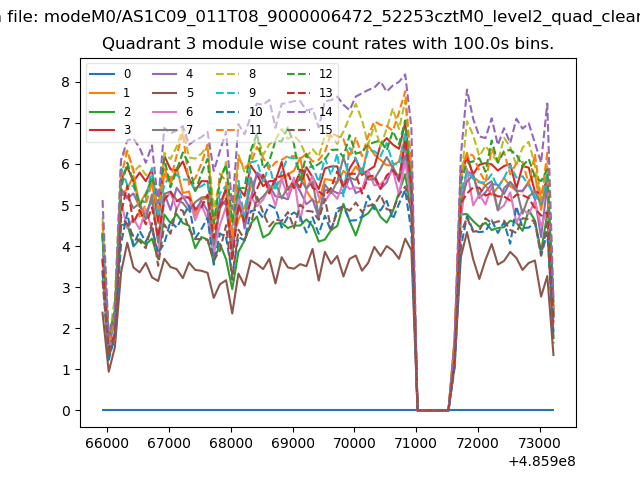
| Module-wise count rates for Quadrant D Data is divided into 100 sec bins |
 |
 |
| Parameter | Plot |
|---|---|
| CZT HV Monitor | 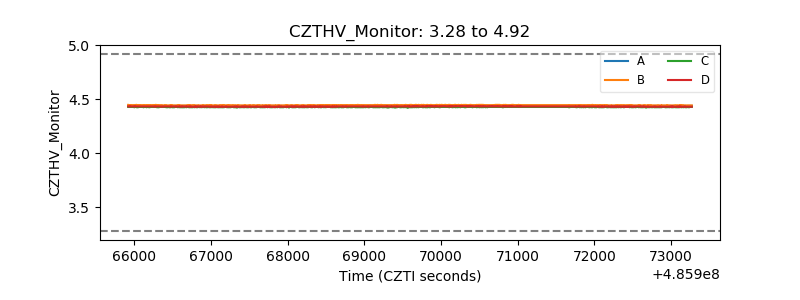 |
| D_VDD | 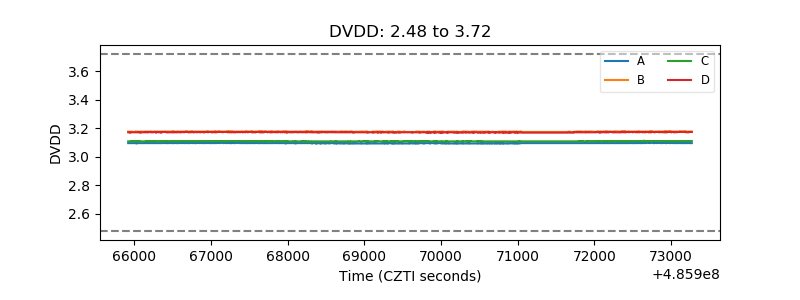 |
| Temperature 1 | 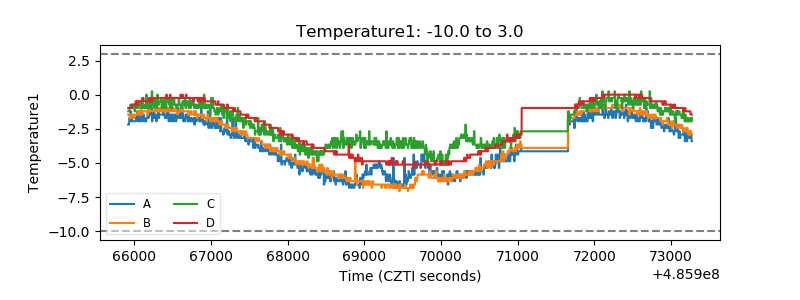 |
| Veto HV Monitor | 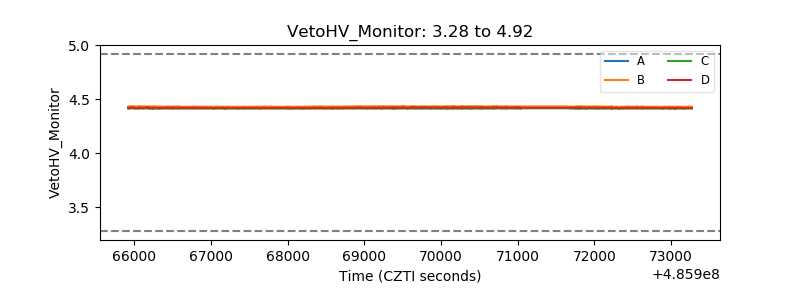 |
| Veto LLD | 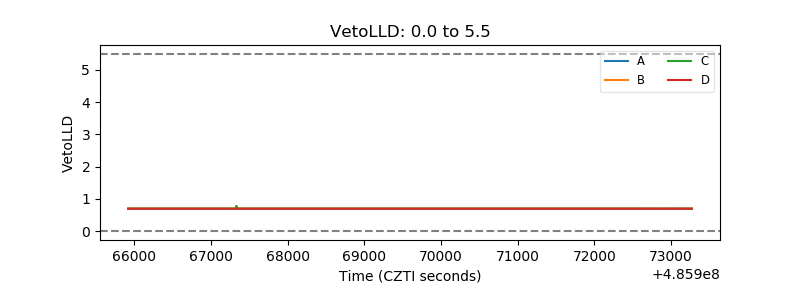 |
| Alpha Counter |  |
| _CPM_Rate | 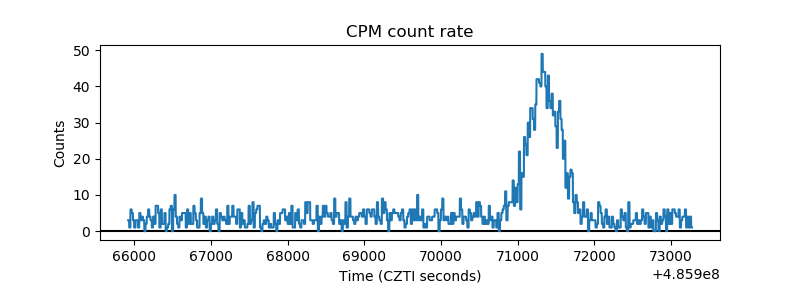 |
| CZT Counter | 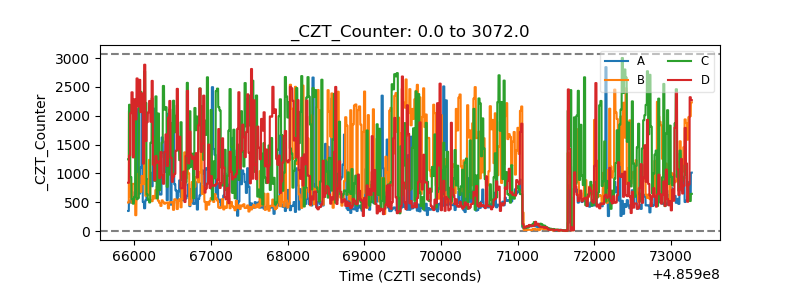 |
| +2.5 Volts monitor | 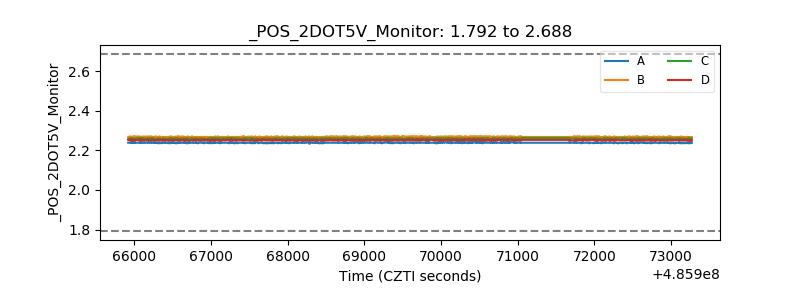 |
| +5 Volts monitor | 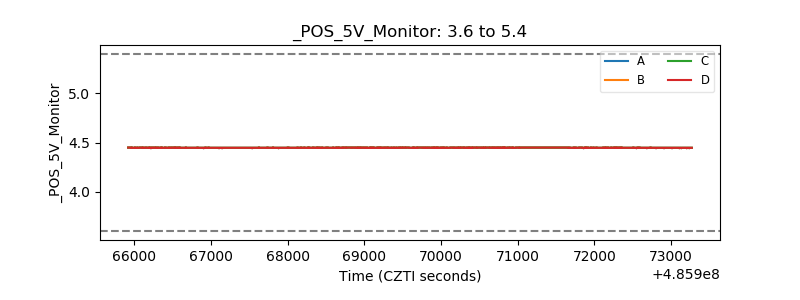 |
| _ROLL_ROT | 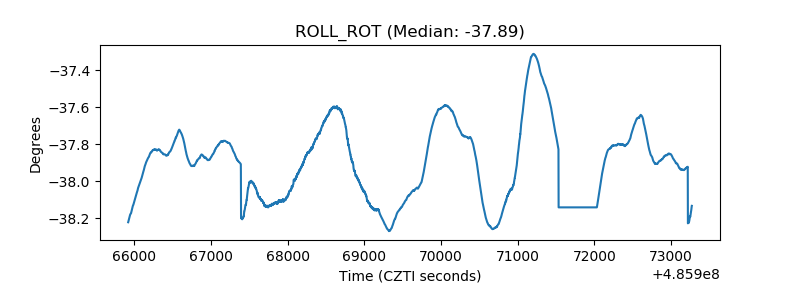 |
| _Roll_DEC | 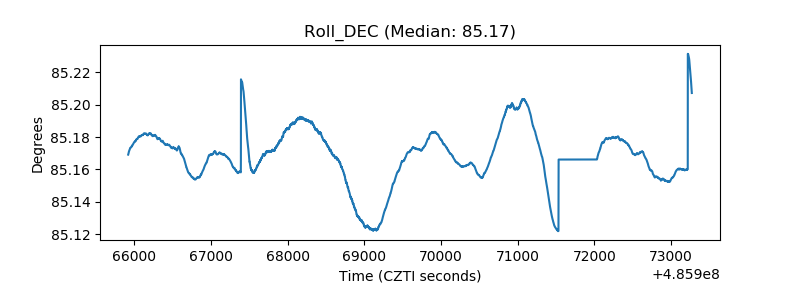 |
| _Roll_RA | 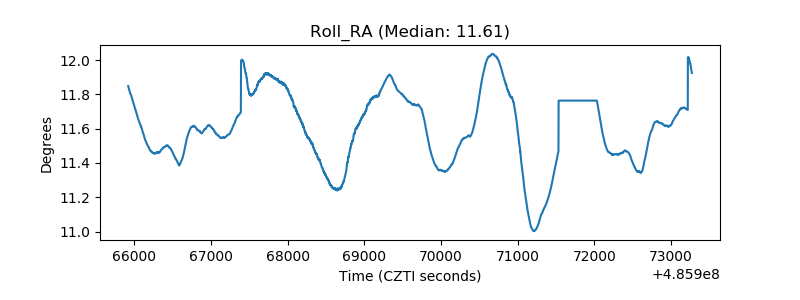 |
| Veto Counter | 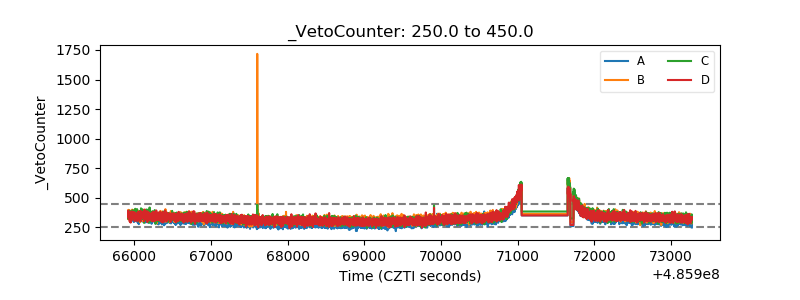 |