| Param | Original file | Final file |
|---|---|---|
| Filename | modeM0/AS1C09_011T08_9000006472_52254cztM0_level2.fits | modeM0/AS1C09_011T08_9000006472_52254cztM0_level2_quad_clean.evt |
| Size (bytes) | 837,933,120 | 92,502,720 |
| Size | 799.1 MB | 88.2 MB |
| Events in quadrant A | 4,077,845 | 684,164 |
| Events in quadrant B | 10,593,184 | 507,984 |
| Events in quadrant C | 7,872,640 | 581,096 |
| Events in quadrant D | 7,903,706 | 514,318 |
| Mode M0 | |||
|---|---|---|---|
| Quadrant | BADHDUFLAG | Total packets | Discarded packets |
| A | 0 | 17394 | 2 |
| B | 0 | 36647 | 2 |
| C | 0 | 28537 | 2 |
| D | 0 | 28589 | 2 |
| Mode M9 | |||
|---|---|---|---|
| Quadrant | BADHDUFLAG | Total packets | Discarded packets |
| A | 0 | 1 | 0 |
| B | 0 | 1 | 0 |
| C | 0 | 1 | 0 |
| D | 0 | 1 | 0 |
| Mode SS | |||
|---|---|---|---|
| Quadrant | BADHDUFLAG | Total packets | Discarded packets |
| A | 0 | 148 | 0 |
| B | 0 | 148 | 0 |
| C | 0 | 148 | 0 |
| D | 0 | 148 | 0 |
| Quadrant | Total seconds | Saturated seconds | Saturation percentage |
|---|---|---|---|
| A | 7367 | 125 | 1.696756% |
| B | 7367 | 2734 | 37.111443% |
| C | 7368 | 1149 | 15.594463% |
| D | 7368 | 1407 | 19.096091% |
Noise dominated data is calculated using 1-second bins in cleaned event files. If a bin has >2000 counts, and if more than 50% of those come from <1% of pixels, then it is considered to be noise-dominated and hence unusable.
| Quadrant | # 1 sec bins | Bins with >0 counts | Bins with >2000 counts | High rate bins dominated by noise | Noise dominated (total time) | Noise dominated (detector-on time) | Marked lightcurve |
|---|---|---|---|---|---|---|---|
| A | 7467 | 7370 | 61 | 61 | 0.82% | 0.83% | 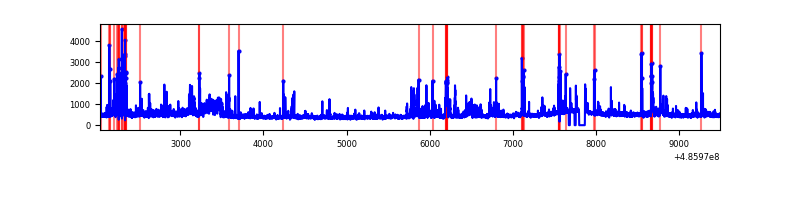 |
| B | 7467 | 7370 | 1677 | 1677 | 22.46% | 22.75% | 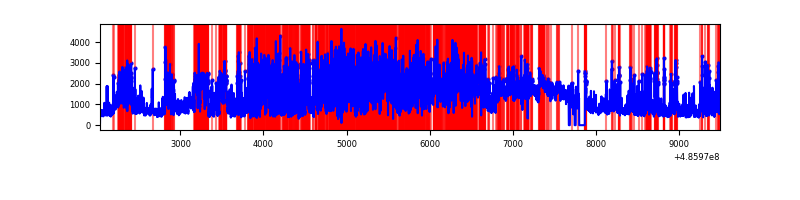 |
| C | 7468 | 7371 | 873 | 873 | 11.69% | 11.84% | 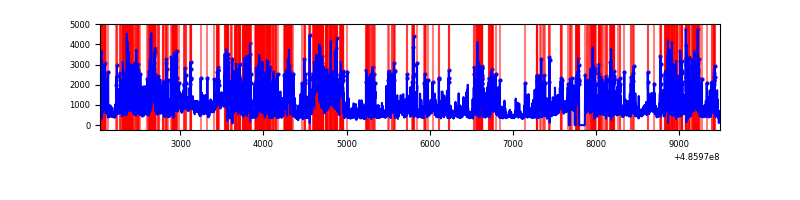 |
| D | 7468 | 7371 | 1107 | 1107 | 14.82% | 15.02% | 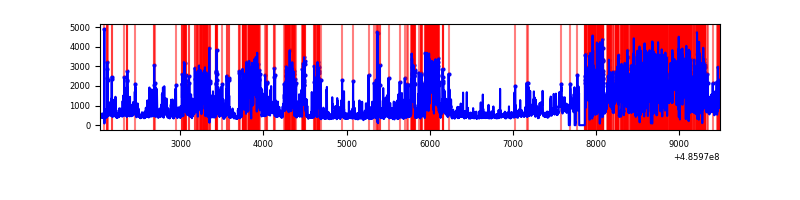 |
Top three noisy pixels from each quadrant. If the there are fewer than three noisy pixels in the level2.evt file, extra rows are filled as -1
| Pixel properties | Quadrant properties | ||||||
|---|---|---|---|---|---|---|---|
| Quadrant | DetID | PixID | Counts | Sigma | Mean | Median | Sigma |
| A | 12 | 3 | 333646 | 1752.75 | 769 | 748 | 189.9 |
| A | 5 | 240 | 171404 | 898.52 | 769 | 748 | 189.9 |
| A | 4 | 3 | 106494 | 556.77 | 769 | 748 | 189.9 |
| B | 12 | 32 | 3445448 | 24567.54 | 662 | 638 | 140.2 |
| B | 10 | 254 | 2412708 | 17202.29 | 662 | 638 | 140.2 |
| B | 5 | 32 | 500225 | 3562.93 | 662 | 638 | 140.2 |
| C | 15 | 224 | 3337000 | 17136.6 | 710 | 702 | 194.7 |
| C | 15 | 189 | 372125 | 1907.78 | 710 | 702 | 194.7 |
| C | 4 | 5 | 293161 | 1502.19 | 710 | 702 | 194.7 |
| D | 11 | 176 | 2021379 | 10390.75 | 688 | 660 | 194.5 |
| D | 8 | 176 | 1465674 | 7533.26 | 688 | 660 | 194.5 |
| D | 15 | 94 | 592825 | 3044.97 | 688 | 660 | 194.5 |
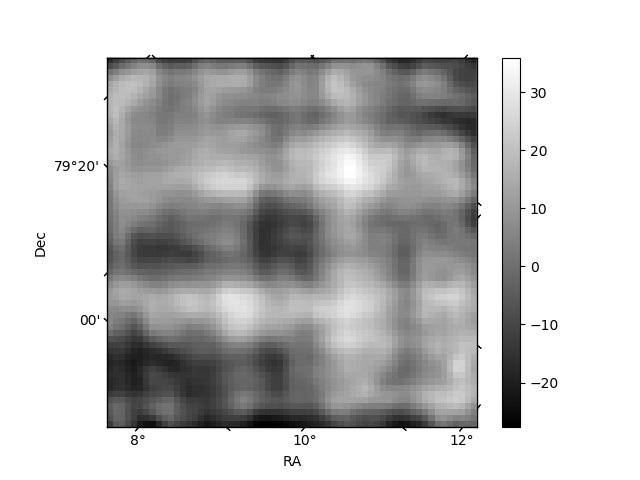
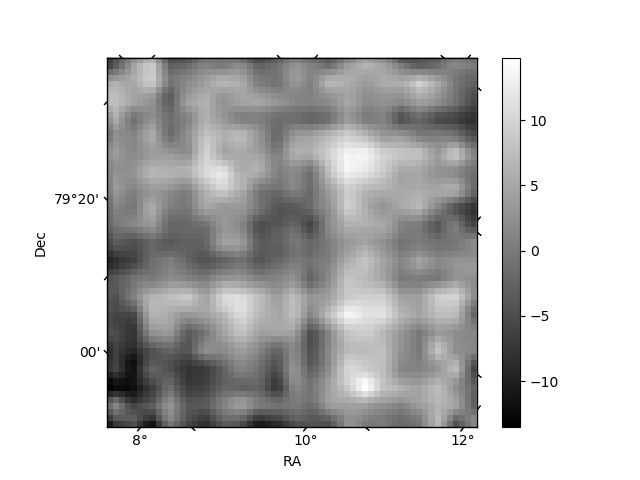
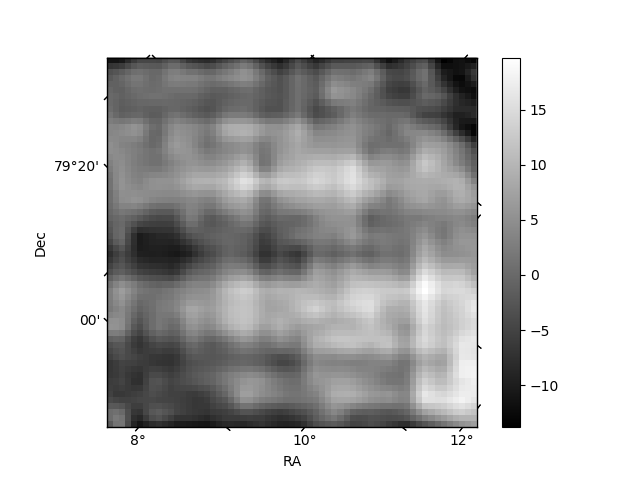
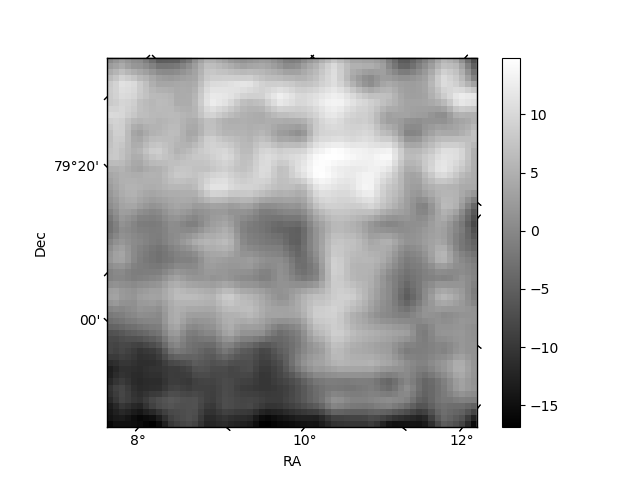
Histogram calculated using DETX and DETY for each event in the final _common_clean file
| Quadrant A | 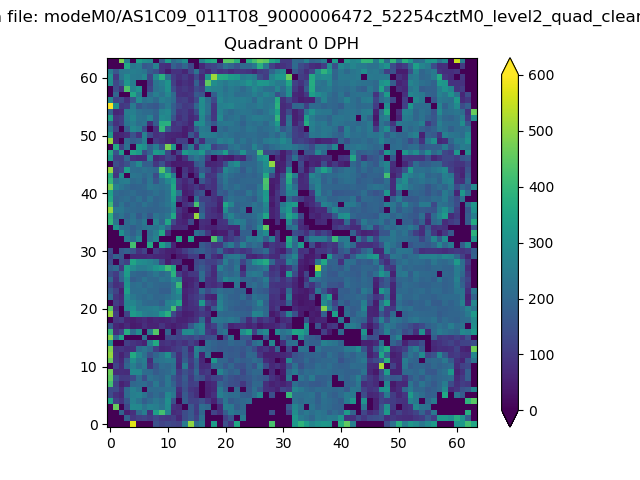 |
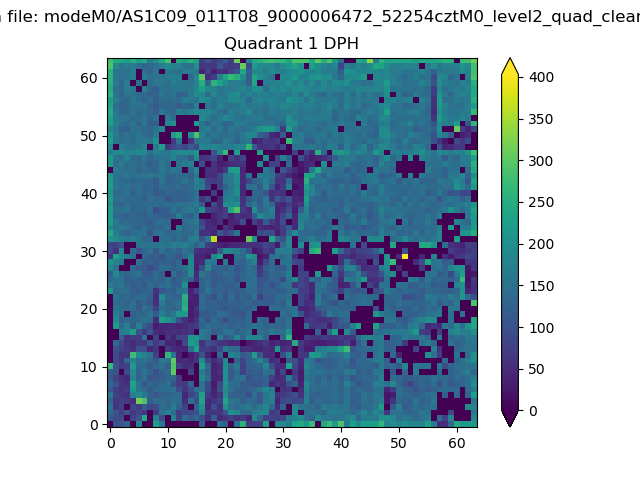 |
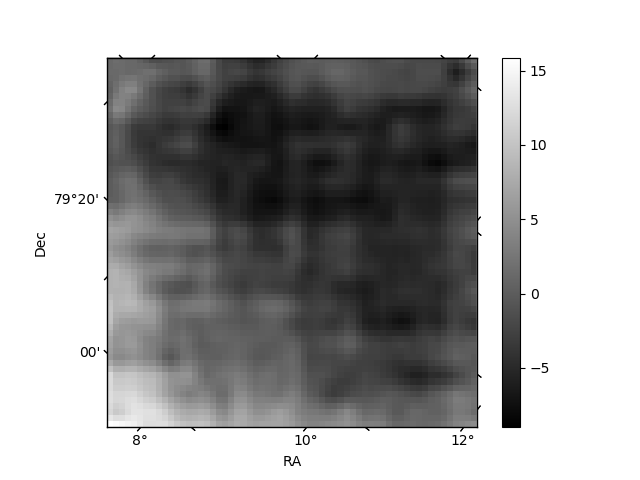
Quadrant B |
|---|---|---|---|
| Quadrant D | 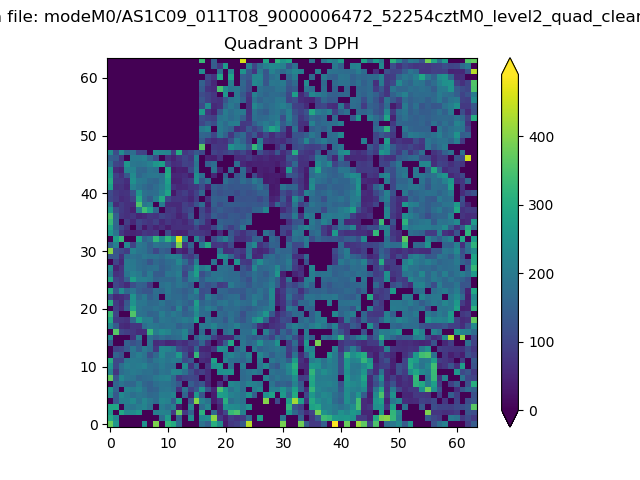 |
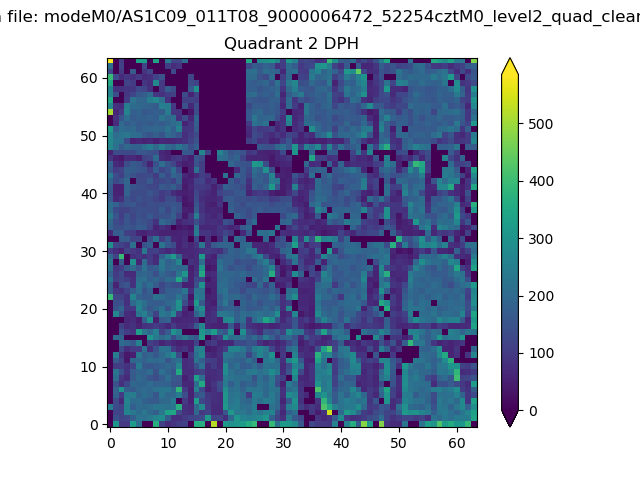 |
Quadrant C |
| Plot type | Count rate plots | Images |
|---|---|---|
| Comparison with Poisson distribution Blue bars denote a histogram of data divided into 1 sec bins. Red curve is a Poisson curve with rate = median count rate of data. |
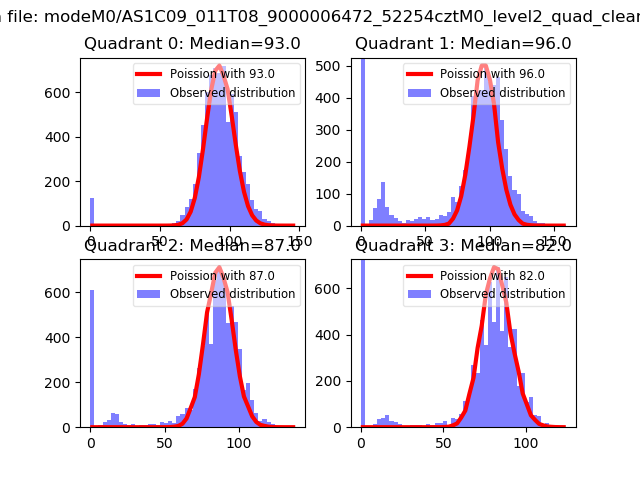 |
 |
| Quadrant-wise count rates Data is divided into 100 sec bins |
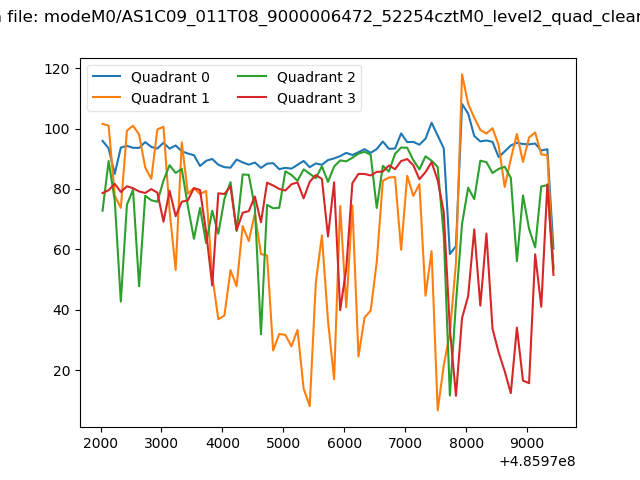 |
|
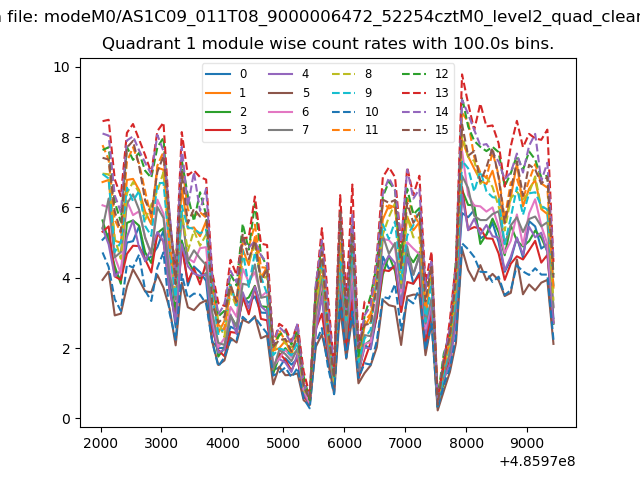
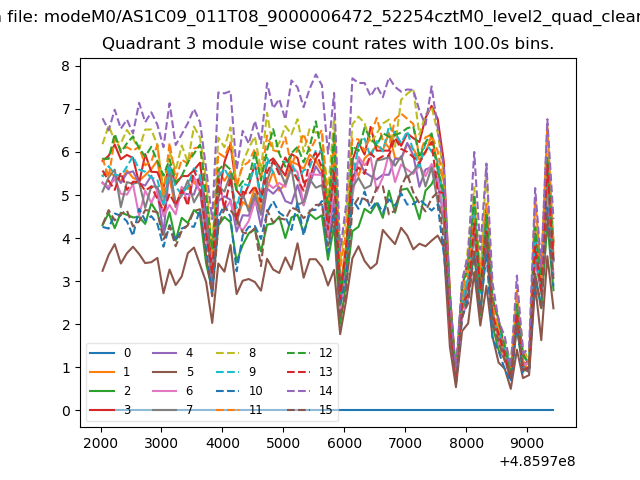
| Module-wise count rates for Quadrant A Data is divided into 100 sec bins |
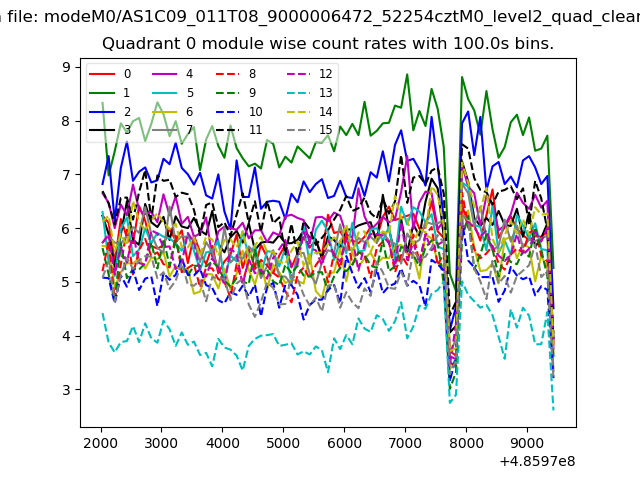 |
 |
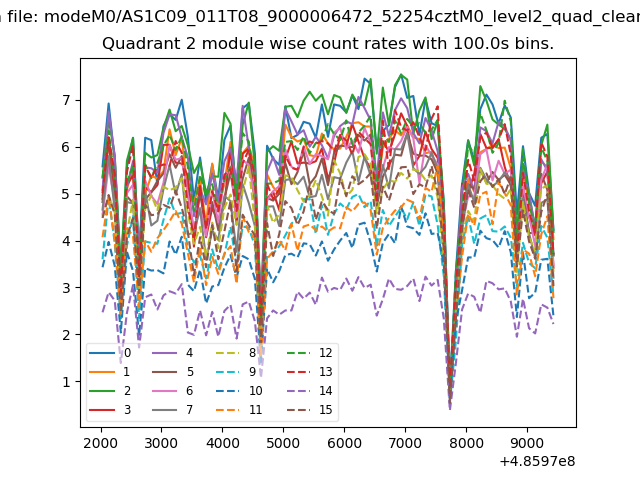
| Module-wise count rates for Quadrant B Data is divided into 100 sec bins |
 |
 |
| Module-wise count rates for Quadrant C Data is divided into 100 sec bins |
 |
 |
| Module-wise count rates for Quadrant D Data is divided into 100 sec bins |
 |
 |
| Parameter | Plot |
|---|---|
| CZT HV Monitor | 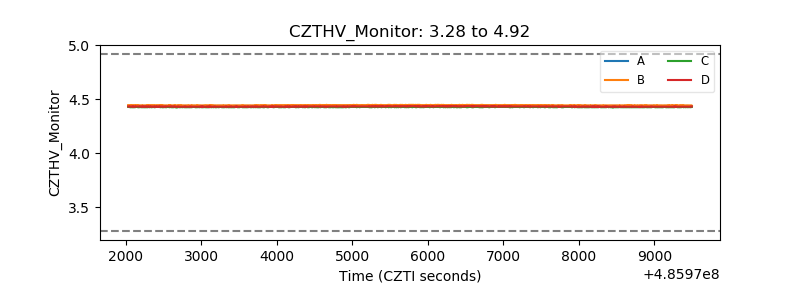 |
| D_VDD | 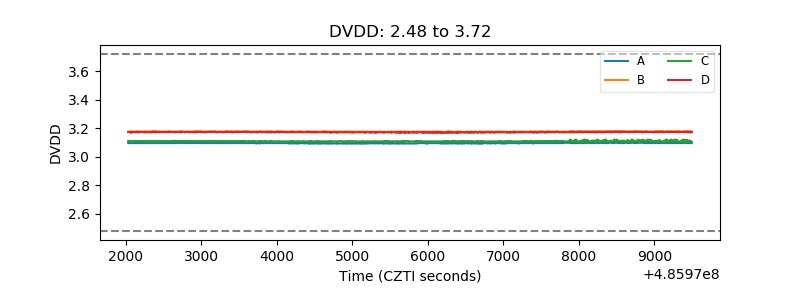 |
| Temperature 1 | 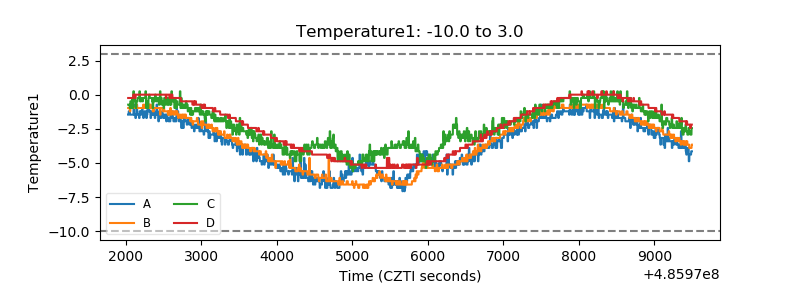 |
| Veto HV Monitor | 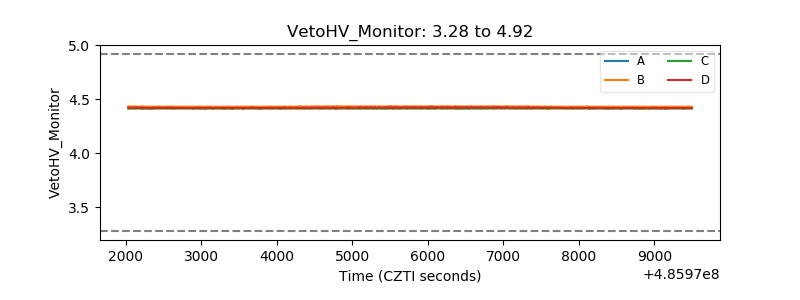 |
| Veto LLD | 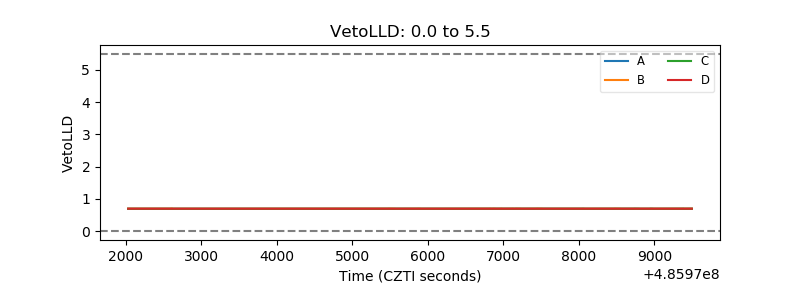 |
| Alpha Counter | 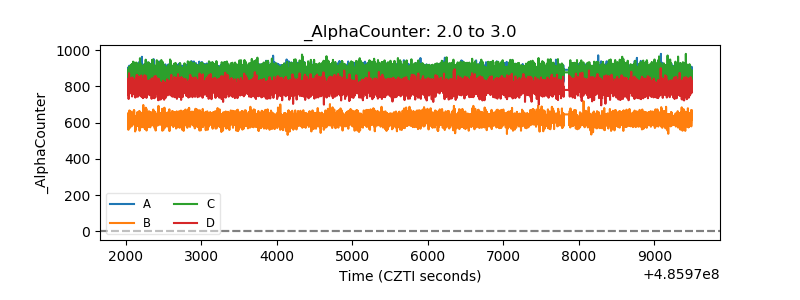 |
| _CPM_Rate | 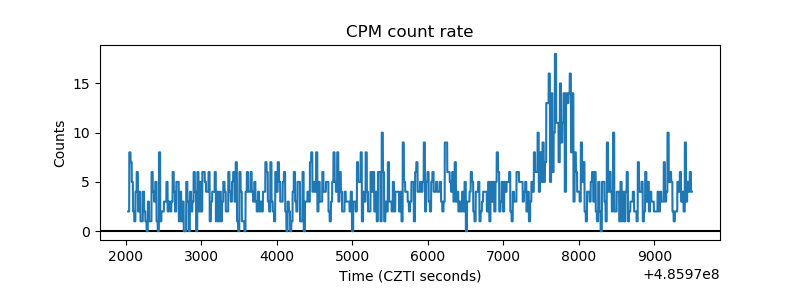 |
| CZT Counter | 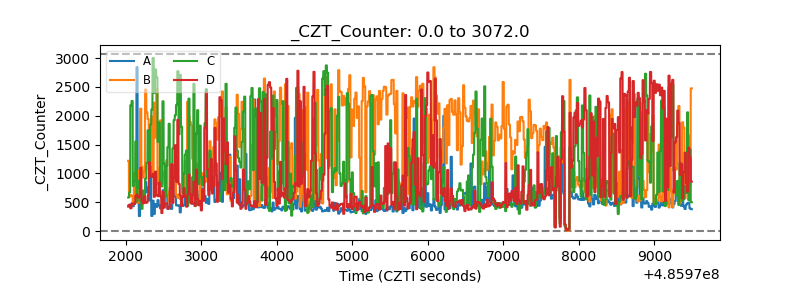 |
| +2.5 Volts monitor |  |
| +5 Volts monitor |  |
| _ROLL_ROT |  |
| _Roll_DEC | 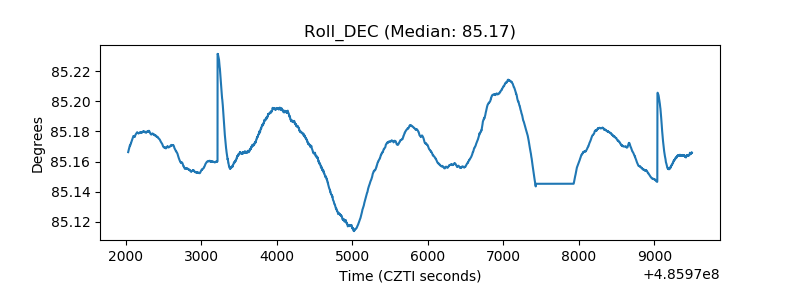 |
| _Roll_RA | 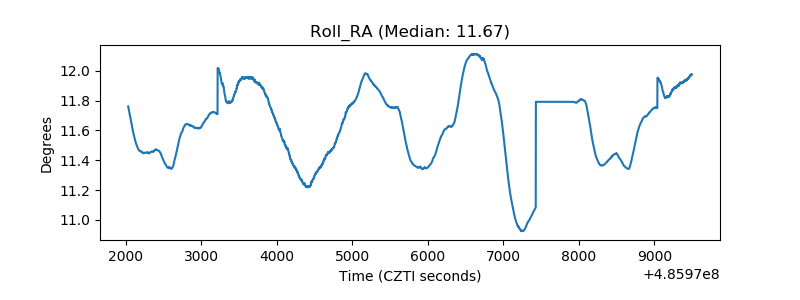 |
| Veto Counter | 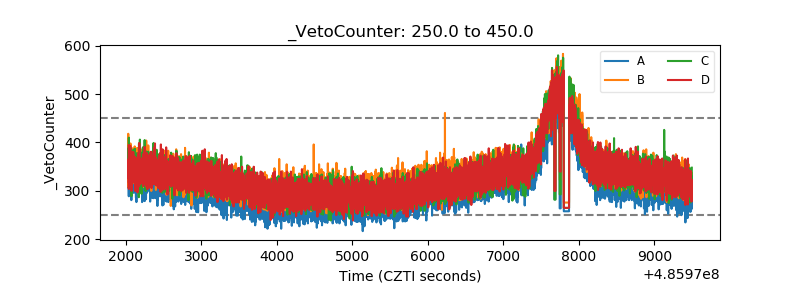 |