| Param | Original file | Final file |
|---|---|---|
| Filename | modeM0/AS1C09_011T08_9000006472_52255cztM0_level2.fits | modeM0/AS1C09_011T08_9000006472_52255cztM0_level2_quad_clean.evt |
| Size (bytes) | 953,979,840 | 98,326,080 |
| Size | 909.8 MB | 93.8 MB |
| Events in quadrant A | 4,067,292 | 734,263 |
| Events in quadrant B | 10,593,095 | 626,323 |
| Events in quadrant C | 8,493,902 | 607,005 |
| Events in quadrant D | 11,550,074 | 460,945 |
| Mode M0 | |||
|---|---|---|---|
| Quadrant | BADHDUFLAG | Total packets | Discarded packets |
| A | 0 | 17747 | 1 |
| B | 0 | 36961 | 0 |
| C | 0 | 30735 | 0 |
| D | 0 | 39708 | 0 |
| Mode SS | |||
|---|---|---|---|
| Quadrant | BADHDUFLAG | Total packets | Discarded packets |
| A | 0 | 156 | 0 |
| B | 0 | 156 | 0 |
| C | 0 | 156 | 0 |
| D | 0 | 156 | 0 |
| Quadrant | Total seconds | Saturated seconds | Saturation percentage |
|---|---|---|---|
| A | 7883 | 59 | 0.748446% |
| B | 7884 | 2071 | 26.268392% |
| C | 7884 | 1440 | 18.264840% |
| D | 7884 | 2744 | 34.804668% |
Noise dominated data is calculated using 1-second bins in cleaned event files. If a bin has >2000 counts, and if more than 50% of those come from <1% of pixels, then it is considered to be noise-dominated and hence unusable.
| Quadrant | # 1 sec bins | Bins with >0 counts | Bins with >2000 counts | High rate bins dominated by noise | Noise dominated (total time) | Noise dominated (detector-on time) | Marked lightcurve |
|---|---|---|---|---|---|---|---|
| A | 7883 | 7883 | 36 | 36 | 0.46% | 0.46% | 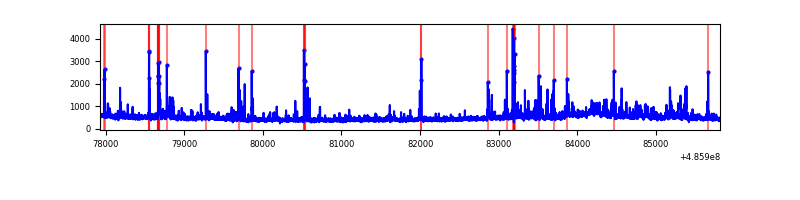 |
| B | 7884 | 7884 | 1481 | 1481 | 18.78% | 18.78% | 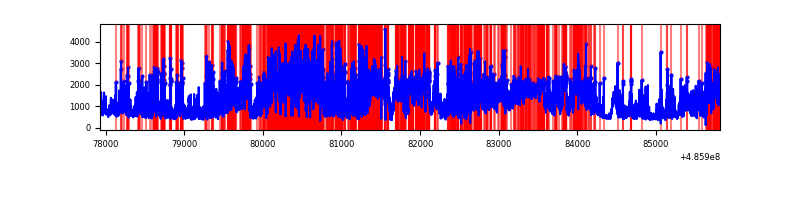 |
| C | 7884 | 7884 | 1119 | 1119 | 14.19% | 14.19% | 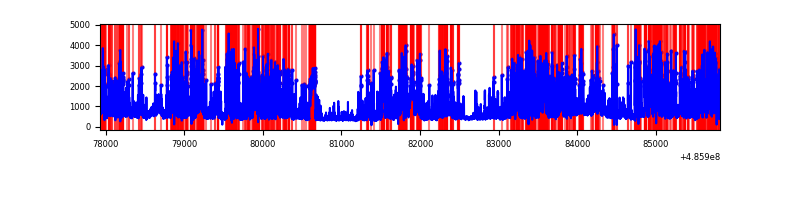 |
| D | 7884 | 7884 | 2272 | 2272 | 28.82% | 28.82% | 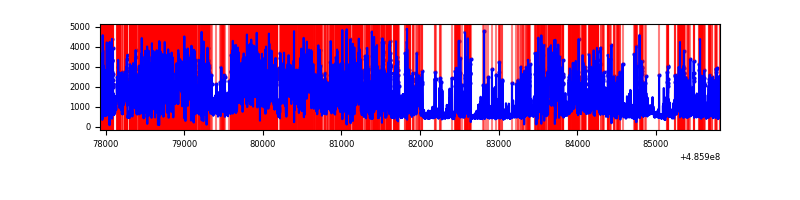 |
Top three noisy pixels from each quadrant. If the there are fewer than three noisy pixels in the level2.evt file, extra rows are filled as -1
| Pixel properties | Quadrant properties | ||||||
|---|---|---|---|---|---|---|---|
| Quadrant | DetID | PixID | Counts | Sigma | Mean | Median | Sigma |
| A | 3 | 79 | 229867 | 1097.8 | 829 | 808 | 208.7 |
| A | 4 | 3 | 141354 | 673.59 | 829 | 808 | 208.7 |
| A | 11 | 3 | 106096 | 504.61 | 829 | 808 | 208.7 |
| B | 10 | 254 | 3102801 | 19396.81 | 749 | 723 | 159.9 |
| B | 12 | 32 | 2048848 | 12806.6 | 749 | 723 | 159.9 |
| B | 5 | 32 | 552010 | 3447.11 | 749 | 723 | 159.9 |
| C | 15 | 224 | 4294304 | 20866.31 | 751 | 745 | 205.8 |
| C | 9 | 38 | 190494 | 922.16 | 751 | 745 | 205.8 |
| C | 1 | 242 | 144394 | 698.12 | 751 | 745 | 205.8 |
| D | 11 | 176 | 6423673 | 33517.63 | 671 | 641 | 191.6 |
| D | 8 | 176 | 688062 | 3587.2 | 671 | 641 | 191.6 |
| D | 6 | 42 | 604808 | 3152.76 | 671 | 641 | 191.6 |
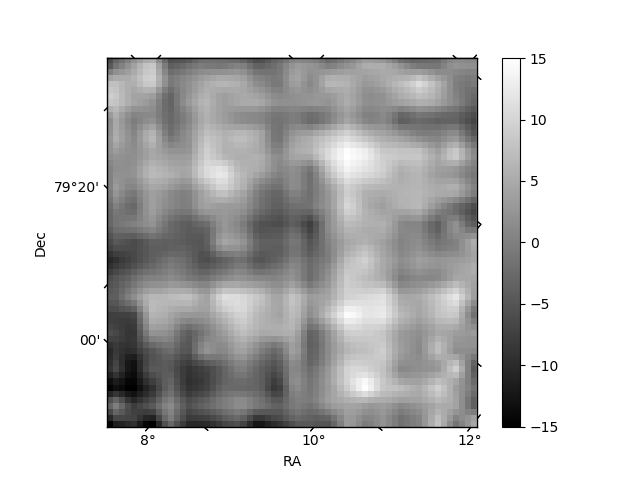
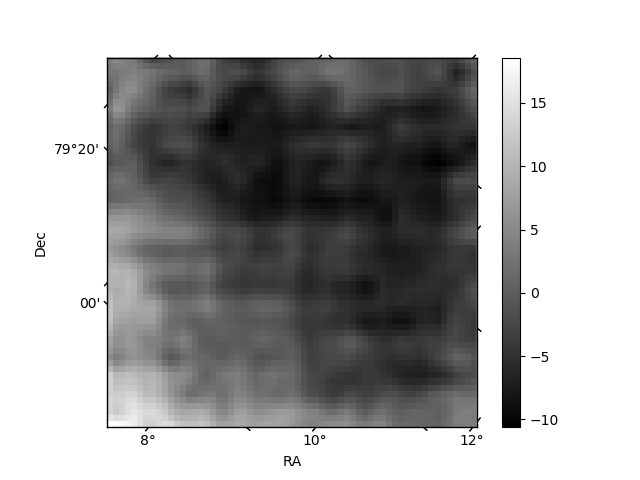
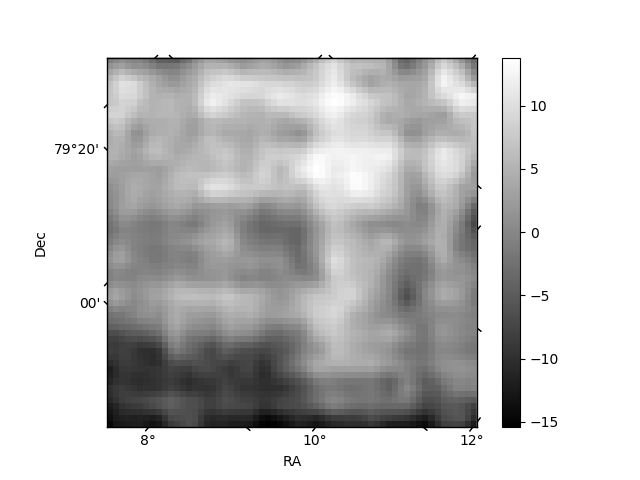
Histogram calculated using DETX and DETY for each event in the final _common_clean file
| Quadrant A | 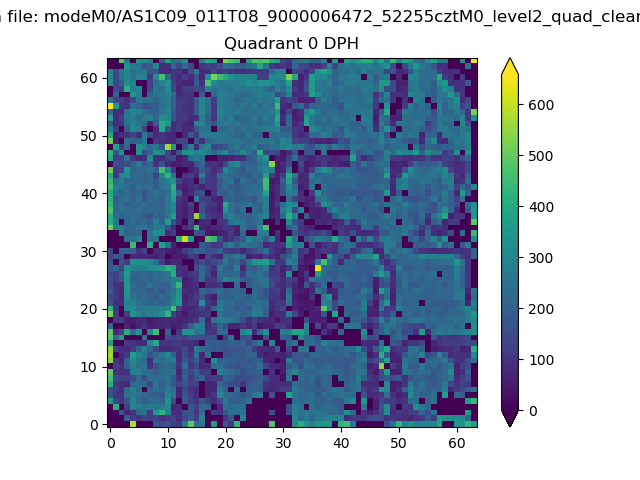 |
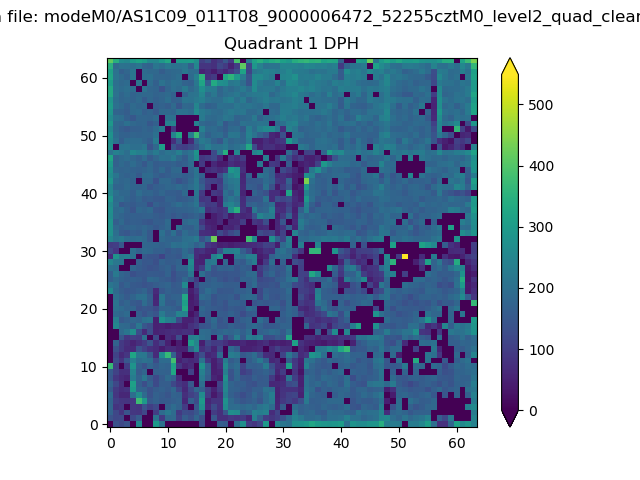 |
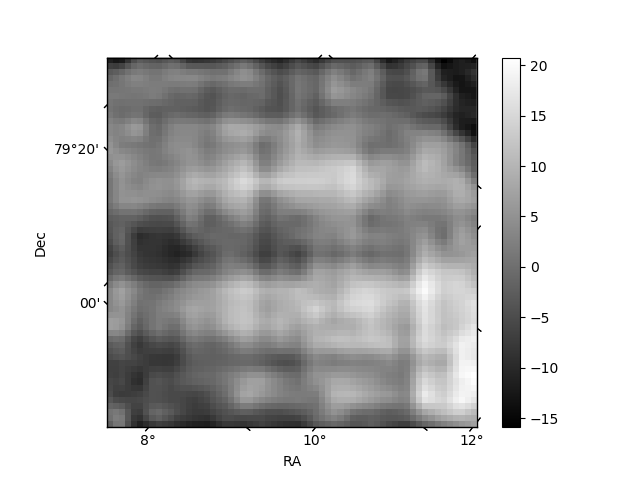
Quadrant B |
|---|---|---|---|
| Quadrant D | 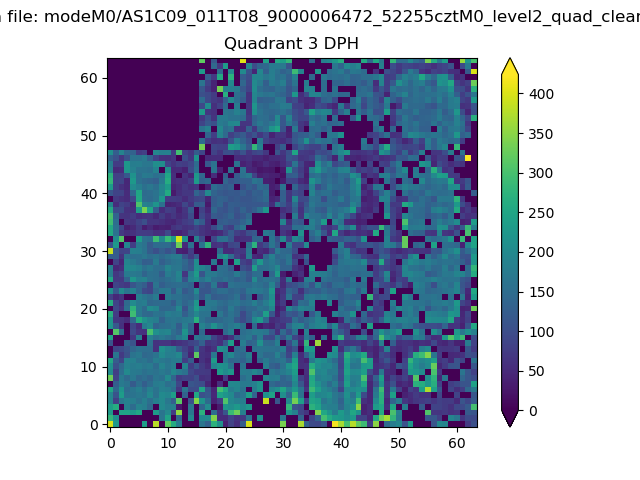 |
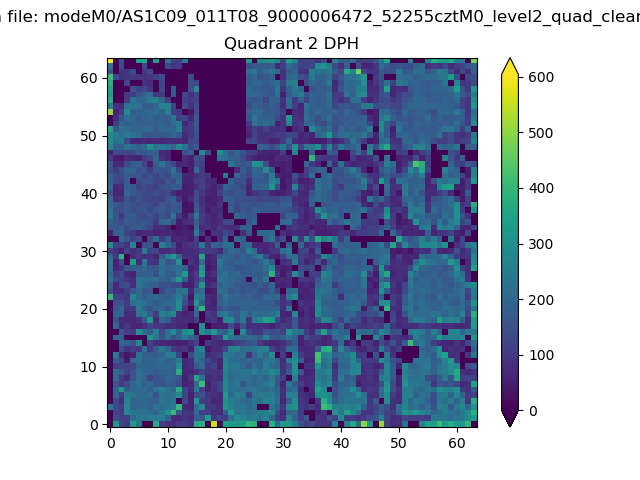 |
Quadrant C |
| Plot type | Count rate plots | Images |
|---|---|---|
| Comparison with Poisson distribution Blue bars denote a histogram of data divided into 1 sec bins. Red curve is a Poisson curve with rate = median count rate of data. |
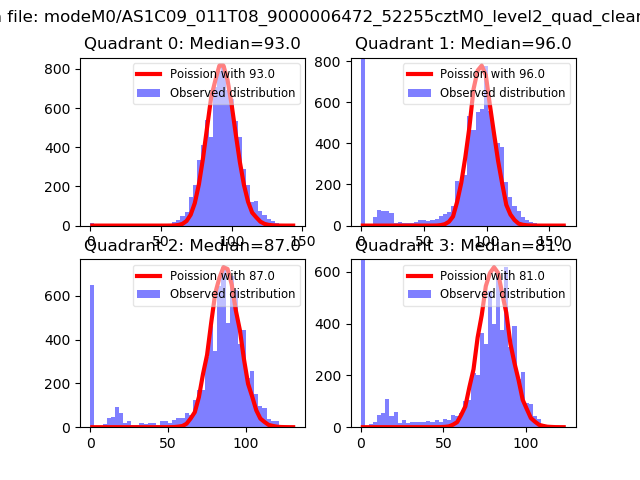 |
 |
| Quadrant-wise count rates Data is divided into 100 sec bins |
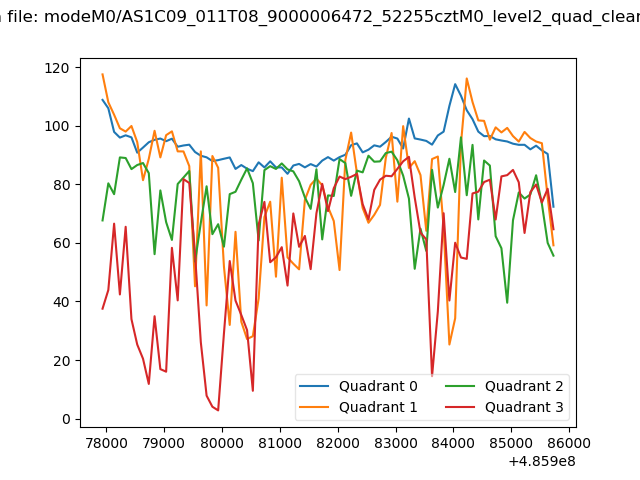 |
|
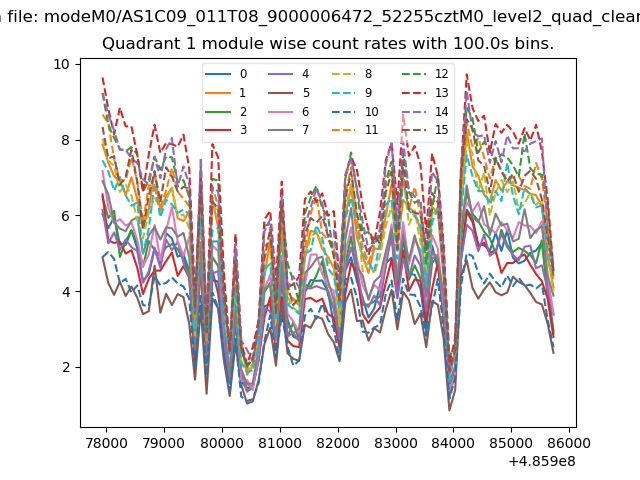
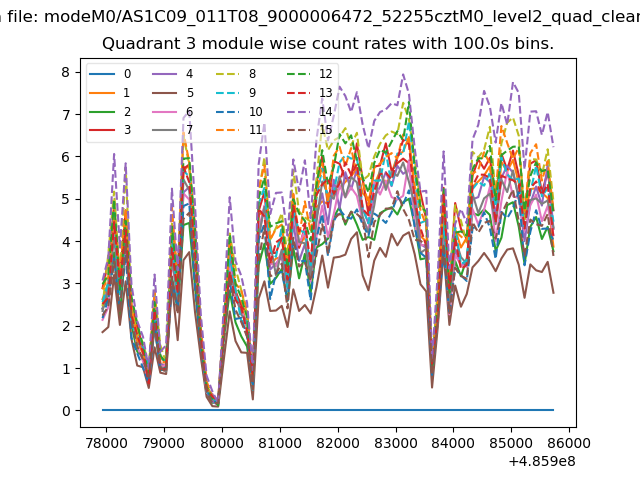
| Module-wise count rates for Quadrant A Data is divided into 100 sec bins |
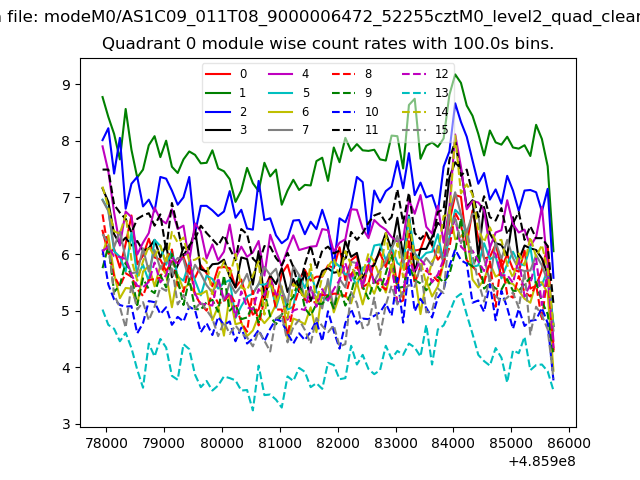 |
 |
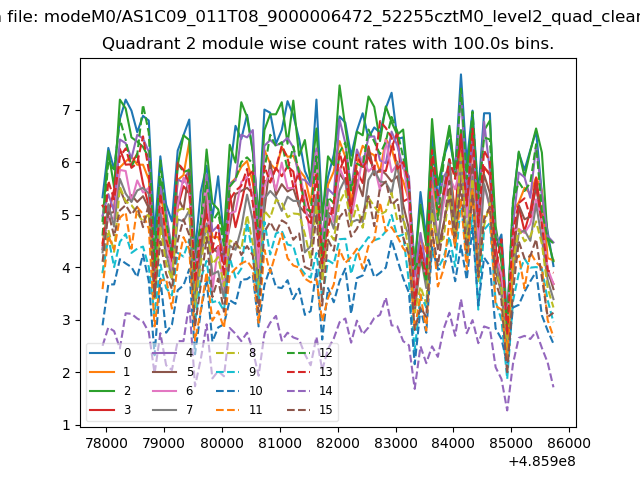
| Module-wise count rates for Quadrant B Data is divided into 100 sec bins |
 |
 |
| Module-wise count rates for Quadrant C Data is divided into 100 sec bins |
 |
 |
| Module-wise count rates for Quadrant D Data is divided into 100 sec bins |
 |
 |
| Parameter | Plot |
|---|---|
| CZT HV Monitor | 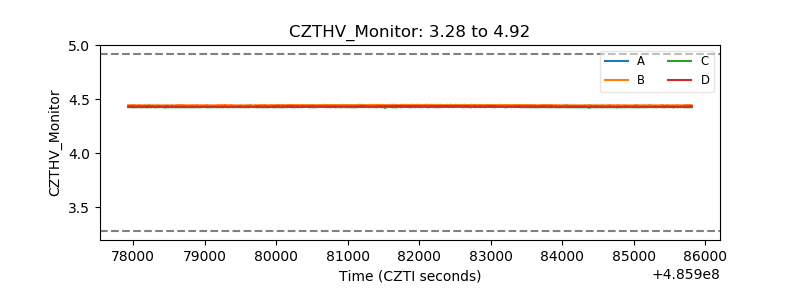 |
| D_VDD | 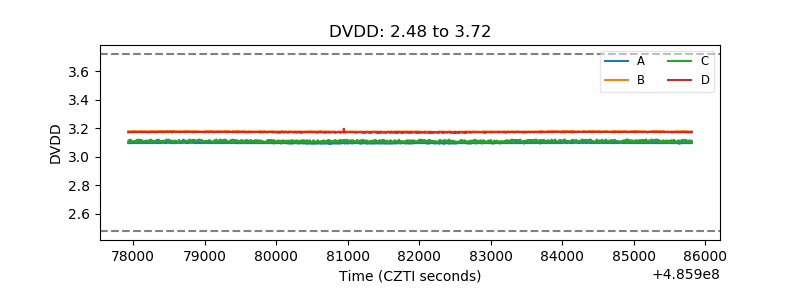 |
| Temperature 1 | 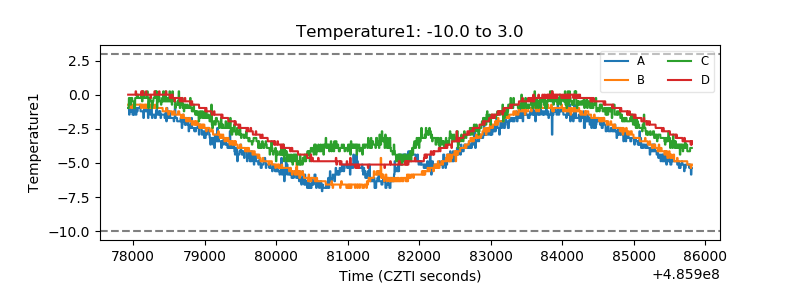 |
| Veto HV Monitor | 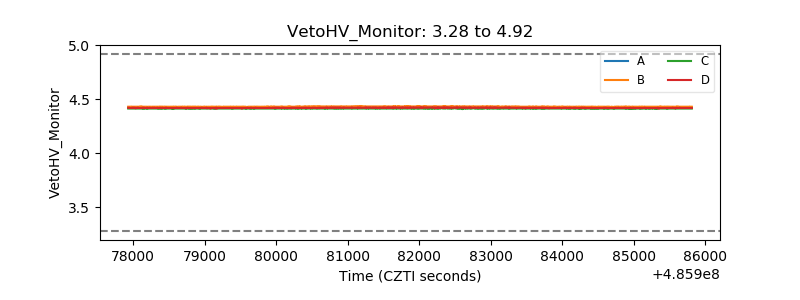 |
| Veto LLD | 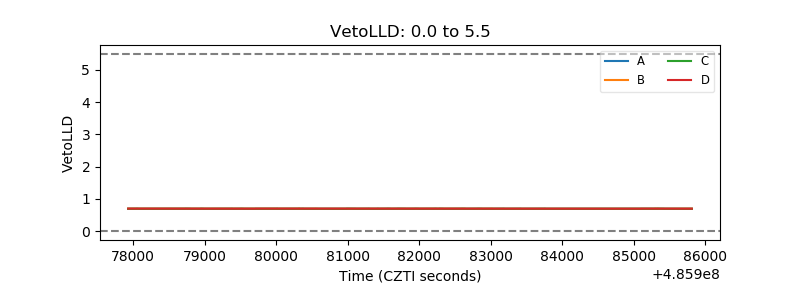 |
| Alpha Counter |  |
| _CPM_Rate | 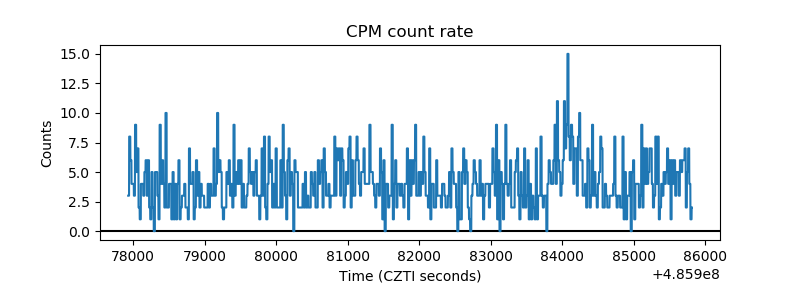 |
| CZT Counter | 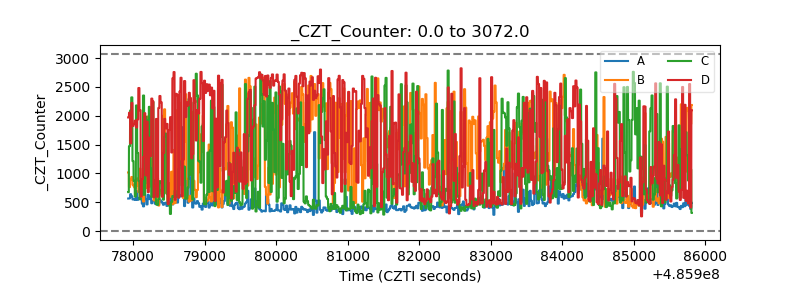 |
| +2.5 Volts monitor | 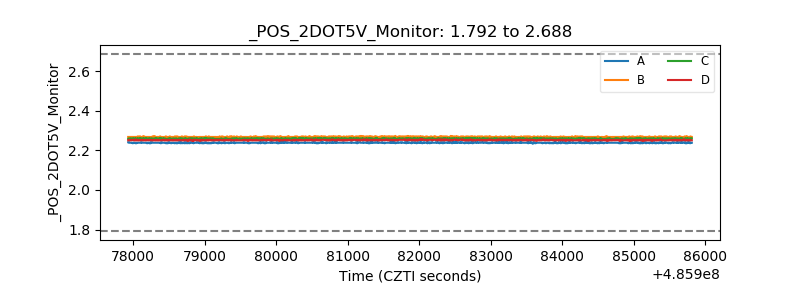 |
| +5 Volts monitor | 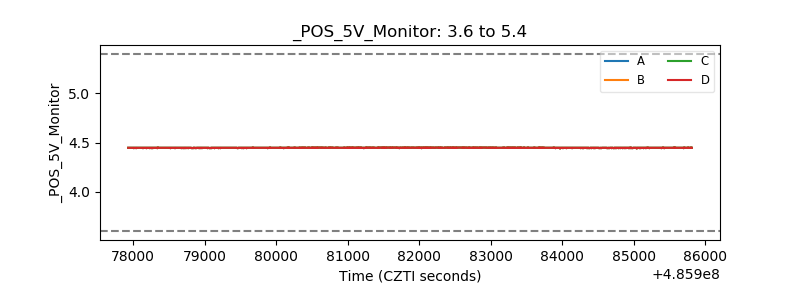 |
| _ROLL_ROT |  |
| _Roll_DEC | 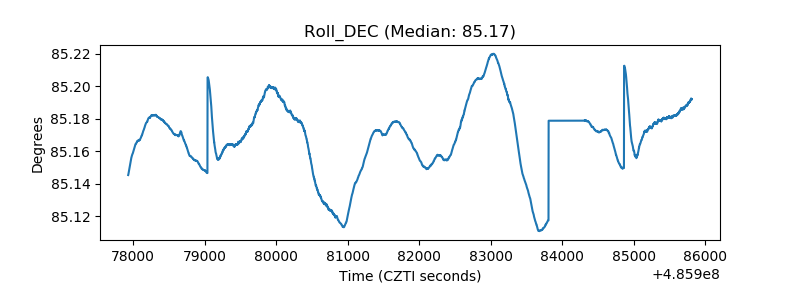 |
| _Roll_RA | 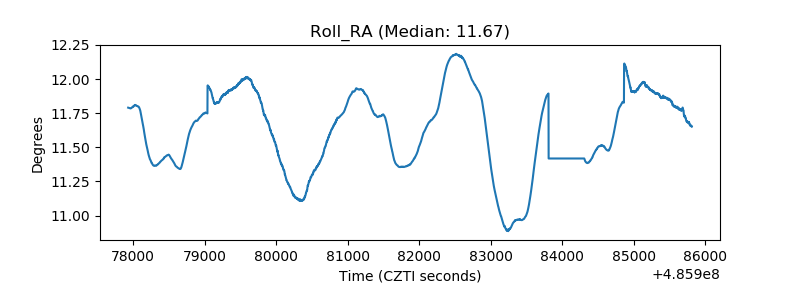 |
| Veto Counter | 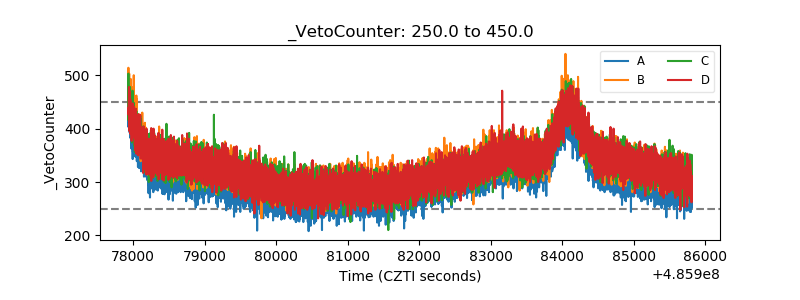 |