| Param | Original file | Final file |
|---|---|---|
| Filename | modeM0/AS1C09_011T08_9000006472_52256cztM0_level2.fits | modeM0/AS1C09_011T08_9000006472_52256cztM0_level2_quad_clean.evt |
| Size (bytes) | 930,487,680 | 94,498,560 |
| Size | 887.4 MB | 90.1 MB |
| Events in quadrant A | 4,893,213 | 712,748 |
| Events in quadrant B | 9,601,497 | 656,781 |
| Events in quadrant C | 12,746,938 | 312,400 |
| Events in quadrant D | 6,593,930 | 632,372 |
| Mode M0 | |||
|---|---|---|---|
| Quadrant | BADHDUFLAG | Total packets | Discarded packets |
| A | 0 | 20120 | 0 |
| B | 0 | 34064 | 0 |
| C | 0 | 43305 | 0 |
| D | 0 | 25112 | 0 |
| Mode SS | |||
|---|---|---|---|
| Quadrant | BADHDUFLAG | Total packets | Discarded packets |
| A | 0 | 158 | 0 |
| B | 0 | 158 | 0 |
| C | 0 | 158 | 0 |
| D | 0 | 158 | 0 |
| Quadrant | Total seconds | Saturated seconds | Saturation percentage |
|---|---|---|---|
| A | 7856 | 265 | 3.373218% |
| B | 7856 | 1662 | 21.155804% |
| C | 7857 | 4602 | 58.571974% |
| D | 7856 | 560 | 7.128310% |
Noise dominated data is calculated using 1-second bins in cleaned event files. If a bin has >2000 counts, and if more than 50% of those come from <1% of pixels, then it is considered to be noise-dominated and hence unusable.
| Quadrant | # 1 sec bins | Bins with >0 counts | Bins with >2000 counts | High rate bins dominated by noise | Noise dominated (total time) | Noise dominated (detector-on time) | Marked lightcurve |
|---|---|---|---|---|---|---|---|
| A | 7856 | 7856 | 203 | 203 | 2.58% | 2.58% | 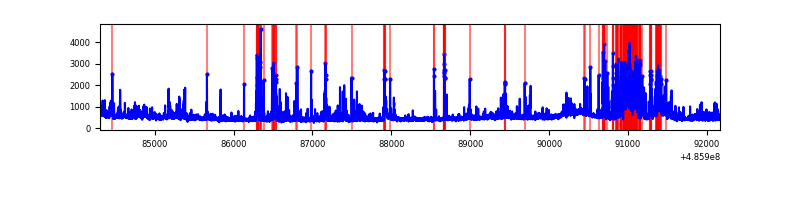 |
| B | 7856 | 7856 | 1049 | 1049 | 13.35% | 13.35% | 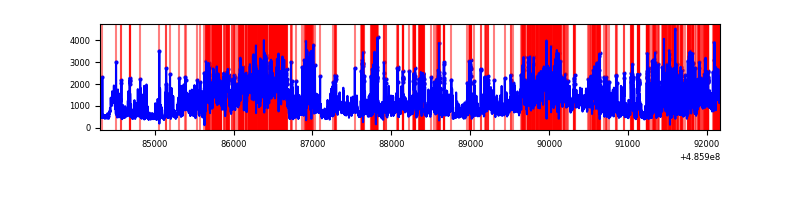 |
| C | 7857 | 7856 | 2500 | 2500 | 31.82% | 31.82% | 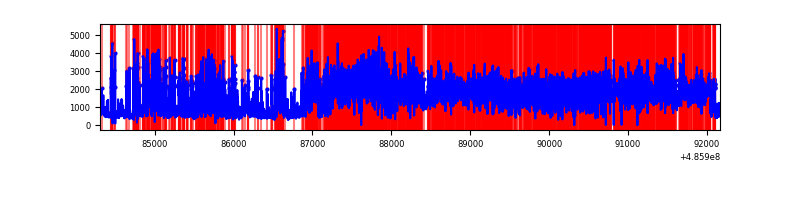 |
| D | 7856 | 7856 | 428 | 428 | 5.45% | 5.45% | 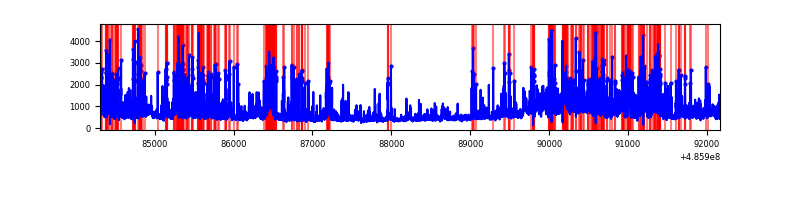 |
Top three noisy pixels from each quadrant. If the there are fewer than three noisy pixels in the level2.evt file, extra rows are filled as -1
| Pixel properties | Quadrant properties | ||||||
|---|---|---|---|---|---|---|---|
| Quadrant | DetID | PixID | Counts | Sigma | Mean | Median | Sigma |
| A | 3 | 79 | 728392 | 3552.87 | 818 | 795 | 204.8 |
| A | 7 | 206 | 149325 | 725.27 | 818 | 795 | 204.8 |
| A | 11 | 3 | 130006 | 630.94 | 818 | 795 | 204.8 |
| B | 7 | 0 | 2545564 | 15631.44 | 766 | 739 | 162.8 |
| B | 12 | 32 | 1619140 | 9940.93 | 766 | 739 | 162.8 |
| B | 10 | 254 | 1061184 | 6513.72 | 766 | 739 | 162.8 |
| C | 15 | 158 | 4807581 | 31904.0 | 540 | 536 | 150.7 |
| C | 15 | 224 | 3836823 | 25461.15 | 540 | 536 | 150.7 |
| C | 15 | 159 | 432978 | 2870.09 | 540 | 536 | 150.7 |
| D | 11 | 176 | 1200593 | 5348.52 | 787 | 750 | 224.3 |
| D | 8 | 176 | 617412 | 2748.88 | 787 | 750 | 224.3 |
| D | 15 | 78 | 375120 | 1668.82 | 787 | 750 | 224.3 |
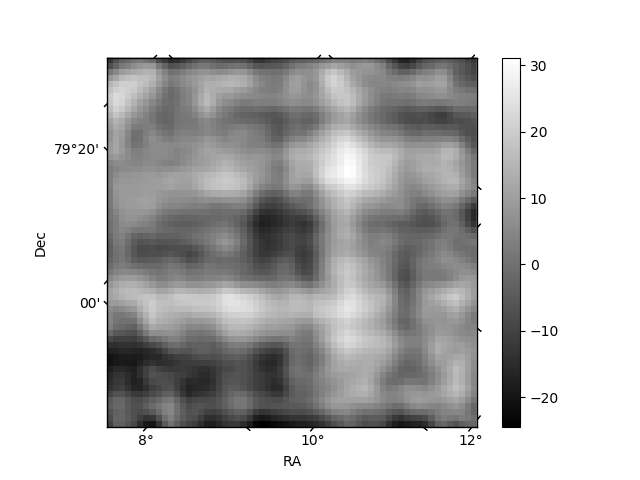
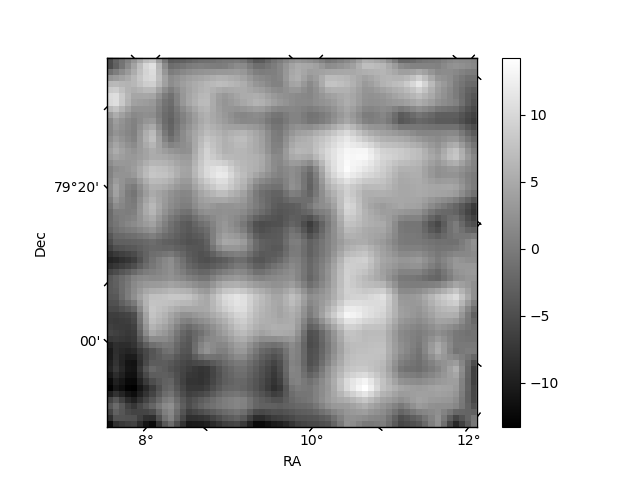
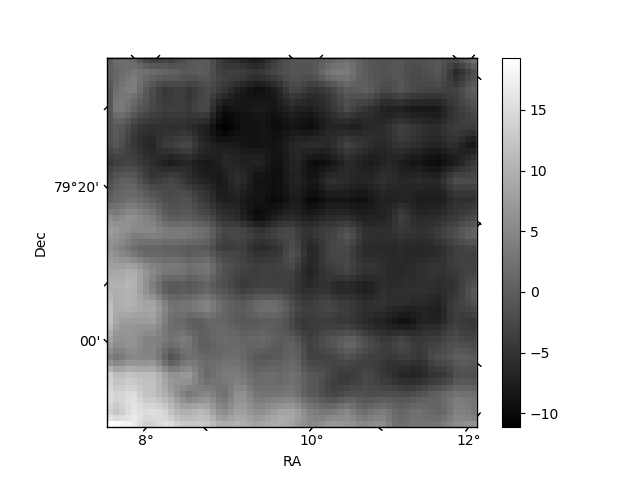
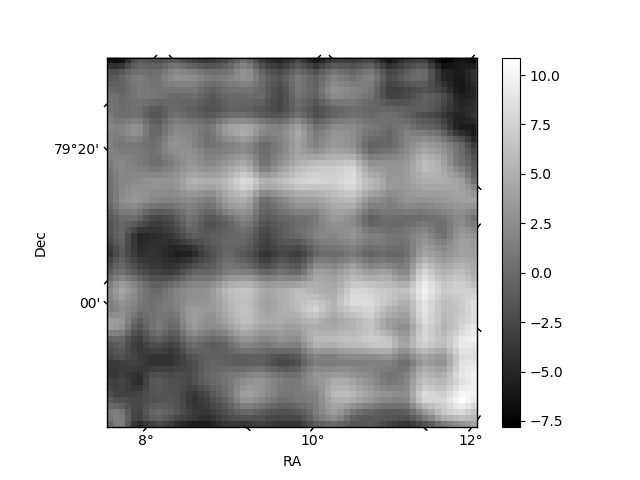
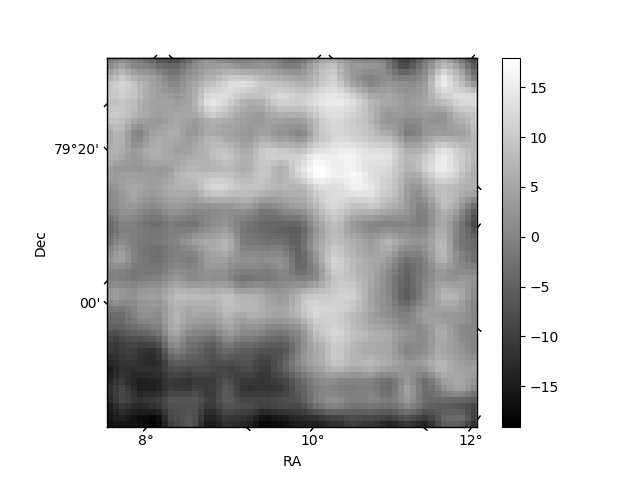
Histogram calculated using DETX and DETY for each event in the final _common_clean file
| Quadrant A | 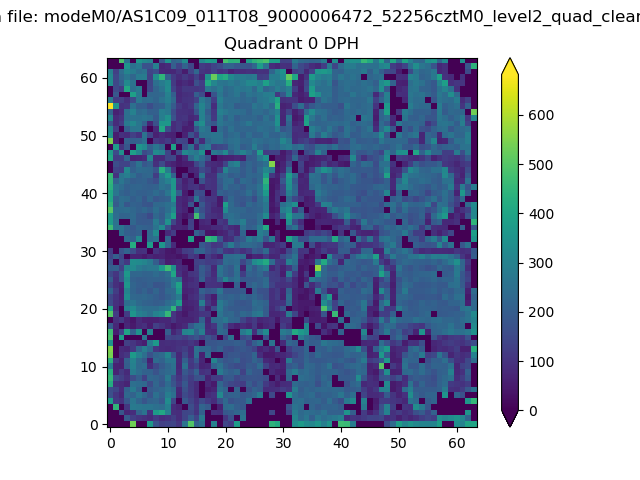 |
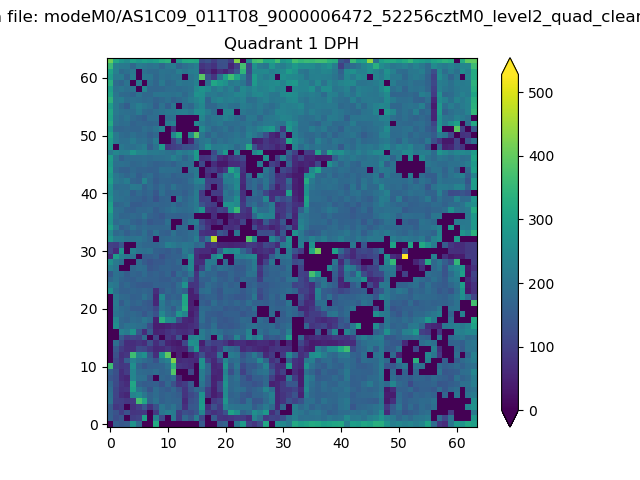 |
Quadrant B |
|---|---|---|---|
| Quadrant D | 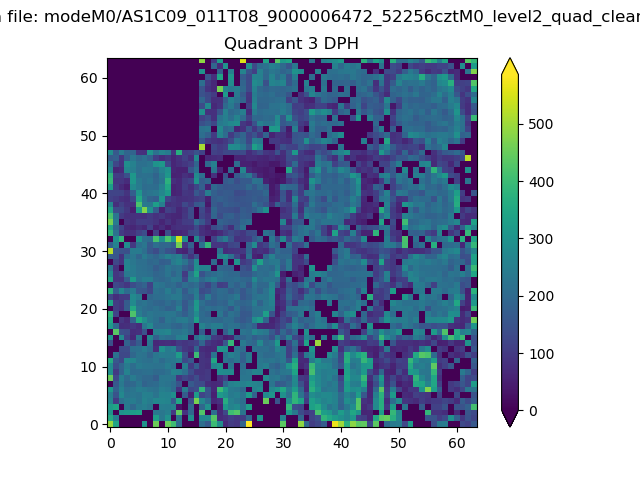 |
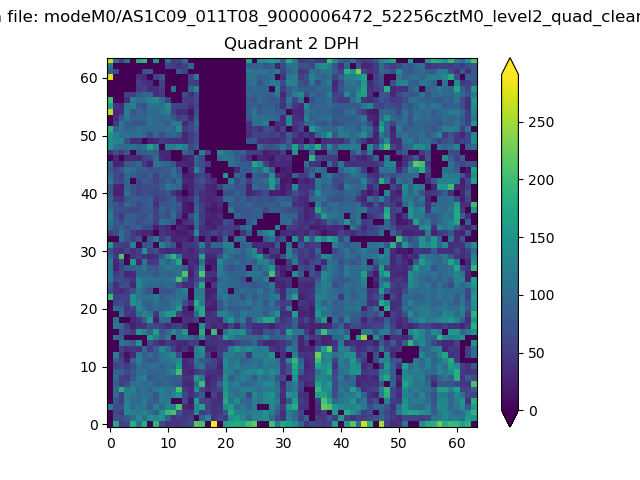 |
Quadrant C |
| Plot type | Count rate plots | Images |
|---|---|---|
| Comparison with Poisson distribution Blue bars denote a histogram of data divided into 1 sec bins. Red curve is a Poisson curve with rate = median count rate of data. |
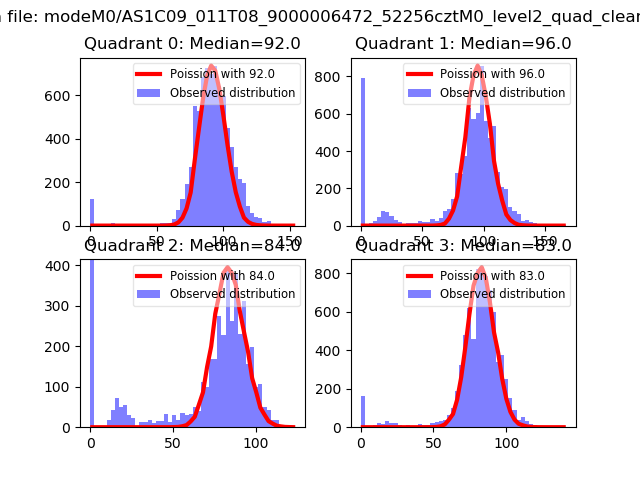 |
 |
| Quadrant-wise count rates Data is divided into 100 sec bins |
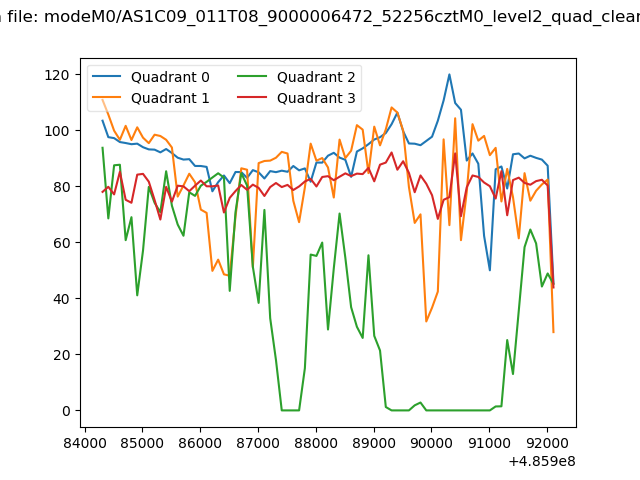 |
|
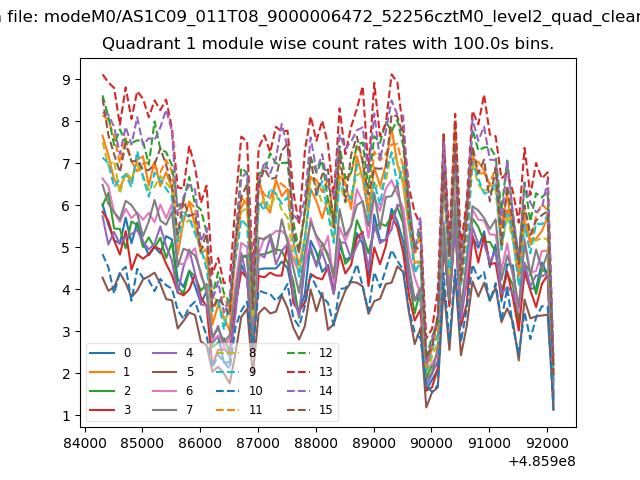
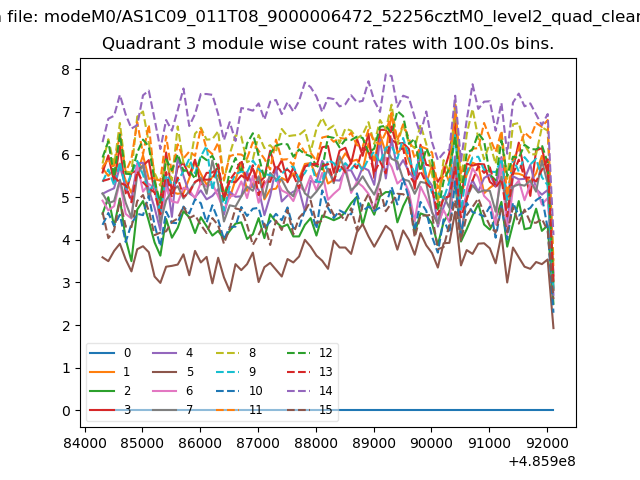
| Module-wise count rates for Quadrant A Data is divided into 100 sec bins |
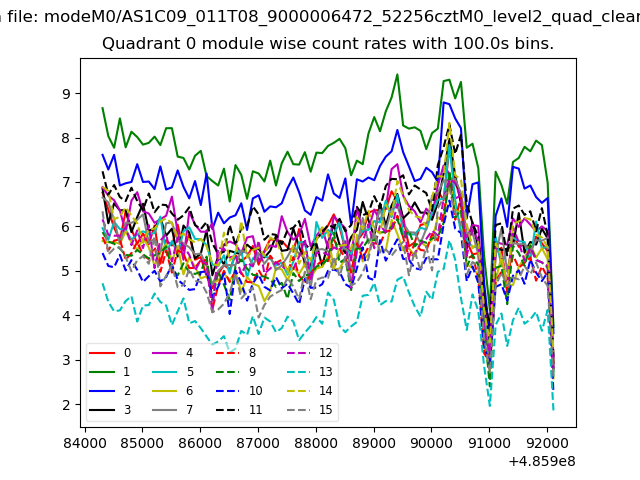 |
 |
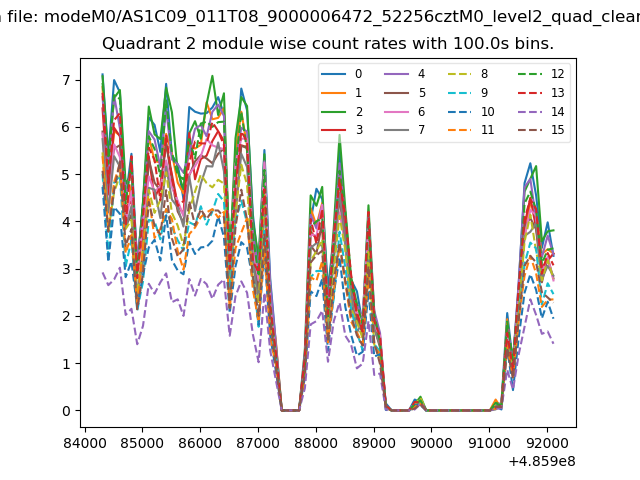
| Module-wise count rates for Quadrant B Data is divided into 100 sec bins |
 |
 |
| Module-wise count rates for Quadrant C Data is divided into 100 sec bins |
 |
 |
| Module-wise count rates for Quadrant D Data is divided into 100 sec bins |
 |
 |
| Parameter | Plot |
|---|---|
| CZT HV Monitor | 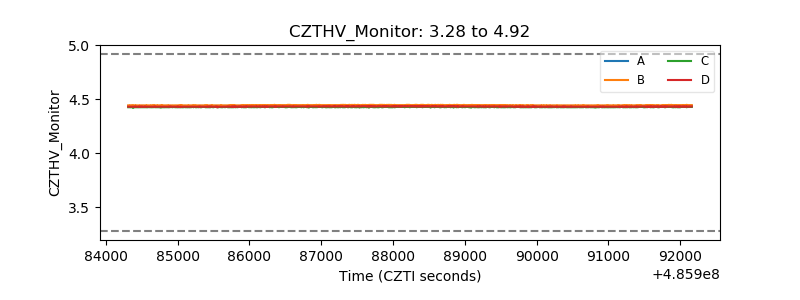 |
| D_VDD | 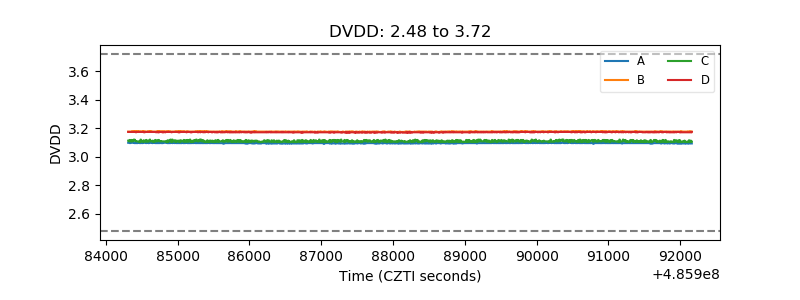 |
| Temperature 1 | 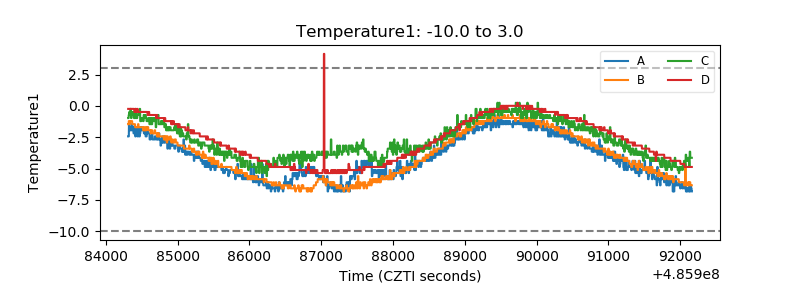 |
| Veto HV Monitor | 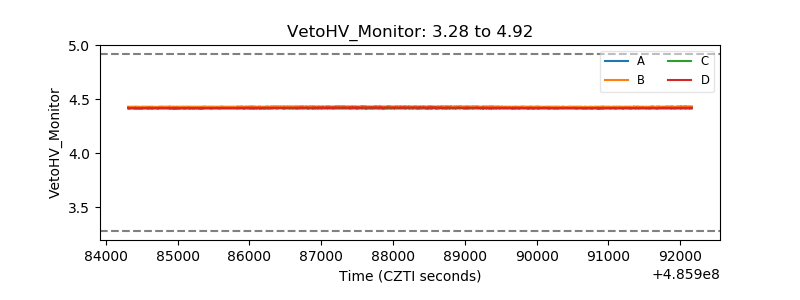 |
| Veto LLD | 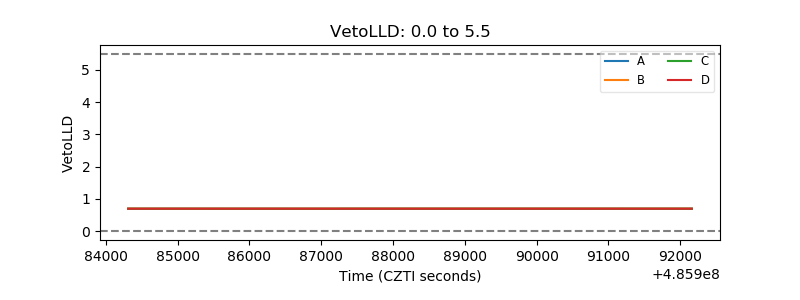 |
| Alpha Counter | 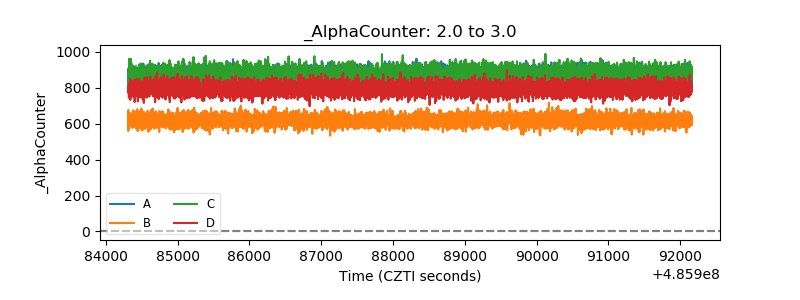 |
| _CPM_Rate | 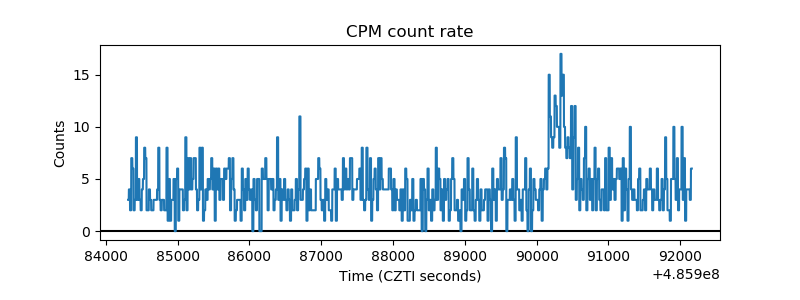 |
| CZT Counter | 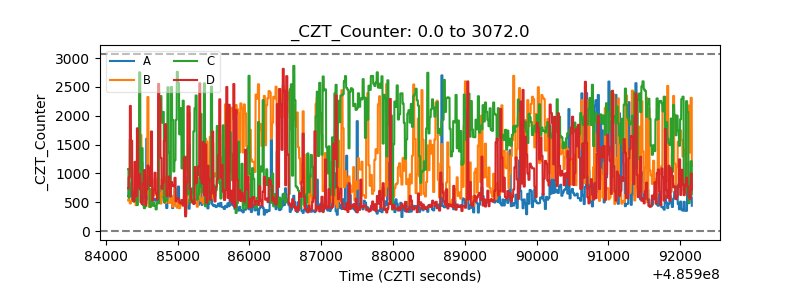 |
| +2.5 Volts monitor |  |
| +5 Volts monitor |  |
| _ROLL_ROT | 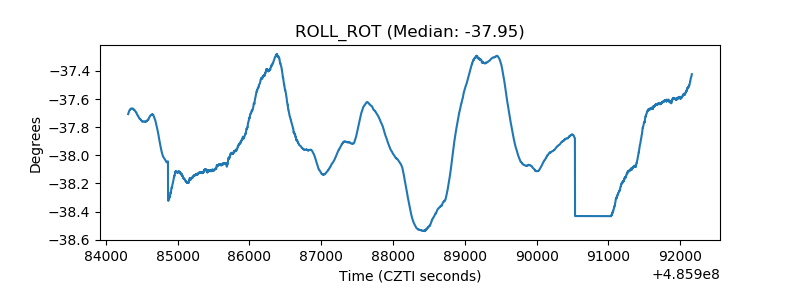 |
| _Roll_DEC | 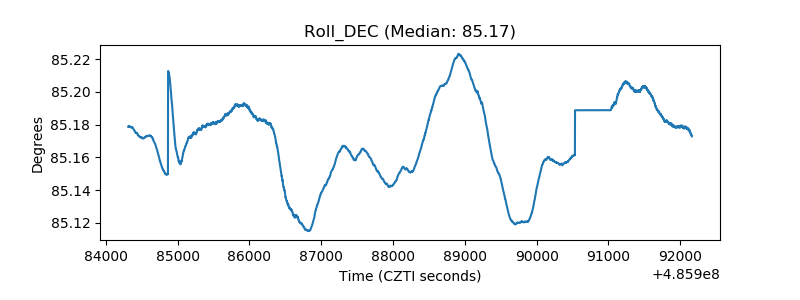 |
| _Roll_RA | 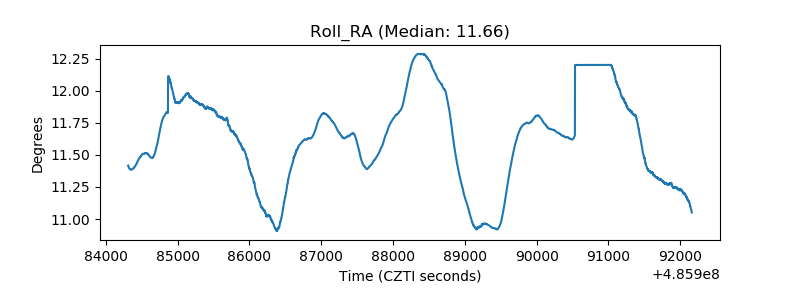 |
| Veto Counter | 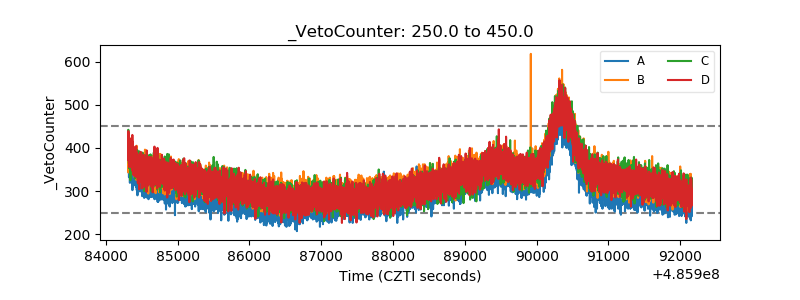 |