| Param | Original file | Final file |
|---|---|---|
| Filename | modeM0/AS1C09_011T08_9000006472_52259cztM0_level2.fits | modeM0/AS1C09_011T08_9000006472_52259cztM0_level2_quad_clean.evt |
| Size (bytes) | 2,339,524,800 | 191,301,120 |
| Size | 2.2 GB | 182.4 MB |
| Events in quadrant A | 10,589,214 | 1,597,267 |
| Events in quadrant B | 24,128,388 | 1,323,544 |
| Events in quadrant C | 36,373,795 | 185,406 |
| Events in quadrant D | 14,112,168 | 1,438,163 |
| Mode M0 | |||
|---|---|---|---|
| Quadrant | BADHDUFLAG | Total packets | Discarded packets |
| A | 0 | 45025 | 448 |
| B | 0 | 84725 | 326 |
| C | 0 | 121472 | 1051 |
| D | 0 | 55460 | 671 |
| Mode M9 | |||
|---|---|---|---|
| Quadrant | BADHDUFLAG | Total packets | Discarded packets |
| A | 0 | 18 | 0 |
| B | 0 | 18 | 0 |
| C | 0 | 18 | 0 |
| D | 0 | 18 | 0 |
| Mode SS | |||
|---|---|---|---|
| Quadrant | BADHDUFLAG | Total packets | Discarded packets |
| A | 0 | 366 | 2 |
| B | 0 | 365 | 0 |
| C | 0 | 366 | 4 |
| D | 0 | 366 | 0 |
| Quadrant | Total seconds | Saturated seconds | Saturation percentage |
|---|---|---|---|
| A | 18100 | 498 | 2.751381% |
| B | 18115 | 5092 | 28.109302% |
| C | 18067 | 16407 | 90.811978% |
| D | 18084 | 826 | 4.567574% |
Noise dominated data is calculated using 1-second bins in cleaned event files. If a bin has >2000 counts, and if more than 50% of those come from <1% of pixels, then it is considered to be noise-dominated and hence unusable.
| Quadrant | # 1 sec bins | Bins with >0 counts | Bins with >2000 counts | High rate bins dominated by noise | Noise dominated (total time) | Noise dominated (detector-on time) | Marked lightcurve |
|---|---|---|---|---|---|---|---|
| A | 19857 | 18131 | 331 | 331 | 1.67% | 1.83% | 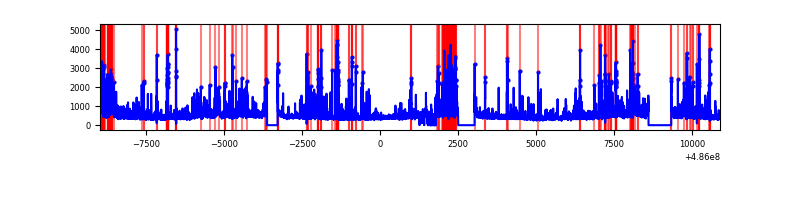 |
| B | 19857 | 18150 | 3381 | 3381 | 17.03% | 18.63% | 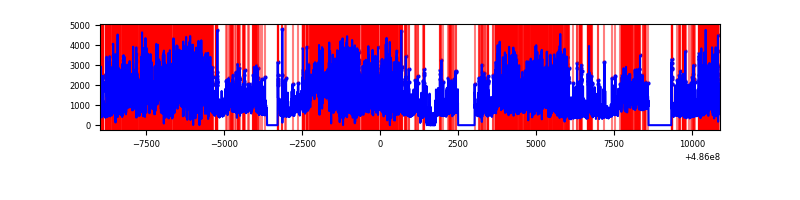 |
| C | 19857 | 18091 | 9114 | 9114 | 45.90% | 50.38% | 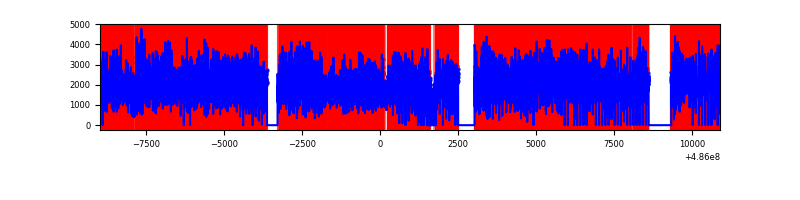 |
| D | 19858 | 18111 | 738 | 738 | 3.72% | 4.07% | 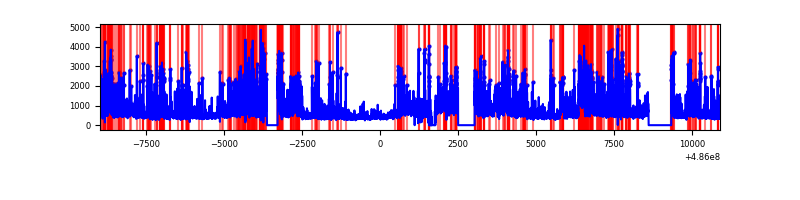 |
Top three noisy pixels from each quadrant. If the there are fewer than three noisy pixels in the level2.evt file, extra rows are filled as -1
| Pixel properties | Quadrant properties | ||||||
|---|---|---|---|---|---|---|---|
| Quadrant | DetID | PixID | Counts | Sigma | Mean | Median | Sigma |
| A | 3 | 79 | 989638 | 2143.61 | 1845 | 1803 | 460.8 |
| A | 4 | 249 | 614288 | 1329.1 | 1845 | 1803 | 460.8 |
| A | 11 | 3 | 376731 | 813.6 | 1845 | 1803 | 460.8 |
| B | 12 | 32 | 8069282 | 22876.05 | 1650 | 1586 | 352.7 |
| B | 10 | 254 | 2790158 | 7907.03 | 1650 | 1586 | 352.7 |
| B | 7 | 0 | 2701922 | 7656.84 | 1650 | 1586 | 352.7 |
| C | 15 | 158 | 21744687 | 96447.9 | 794 | 784 | 225.4 |
| C | 15 | 224 | 5059407 | 22438.18 | 794 | 784 | 225.4 |
| C | 15 | 178 | 2655213 | 11774.06 | 794 | 784 | 225.4 |
| D | 11 | 176 | 1959306 | 3898.01 | 1768 | 1688 | 502.2 |
| D | 6 | 42 | 1203036 | 2392.13 | 1768 | 1688 | 502.2 |
| D | 8 | 176 | 1101391 | 2189.73 | 1768 | 1688 | 502.2 |
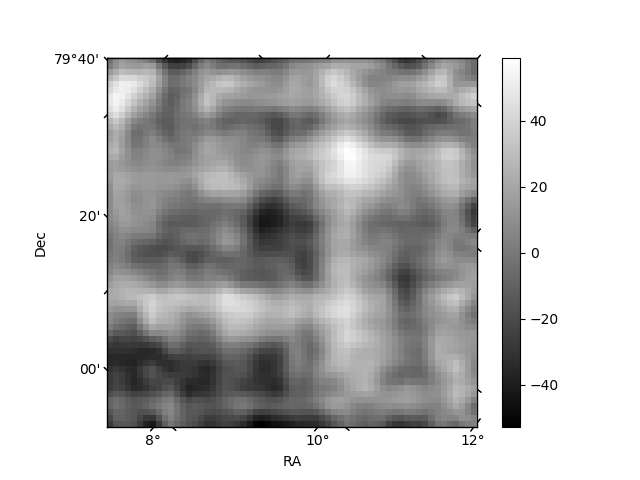
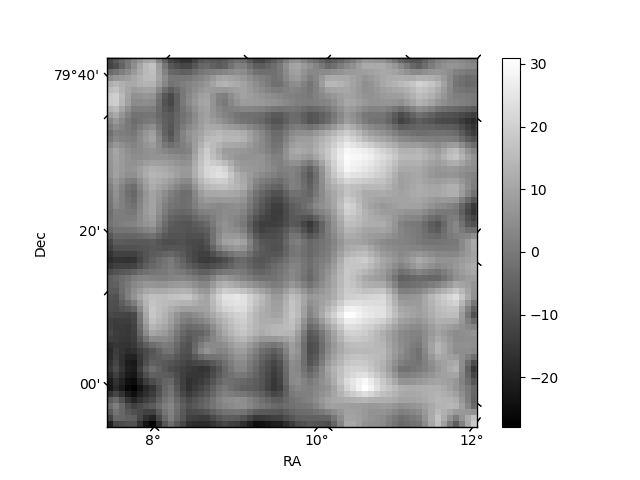
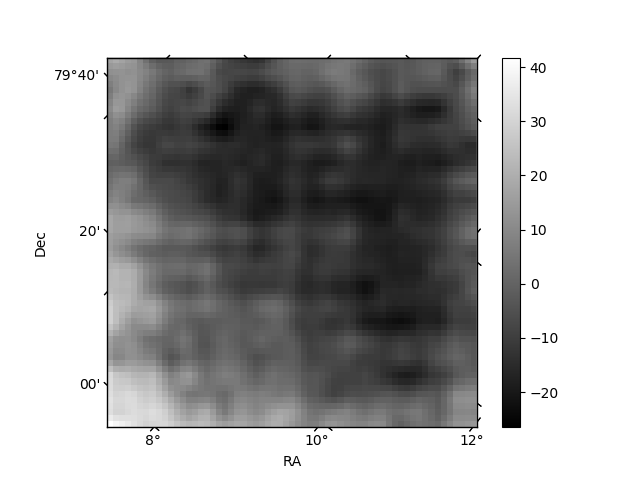
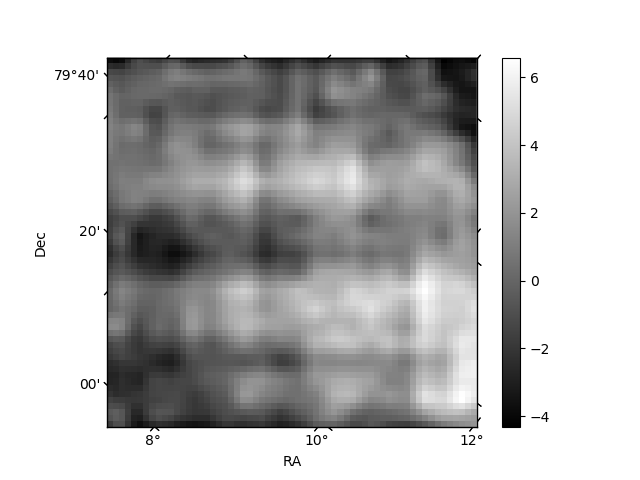
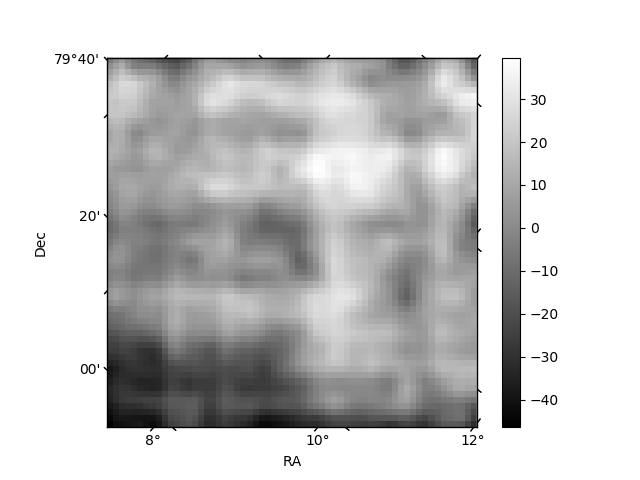
Histogram calculated using DETX and DETY for each event in the final _common_clean file
| Quadrant A | 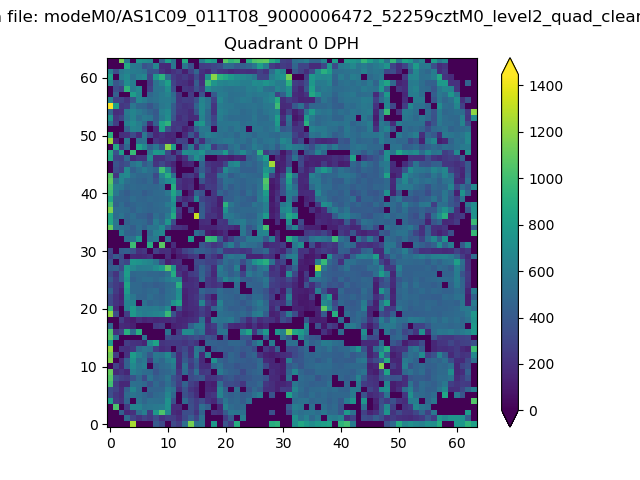 |
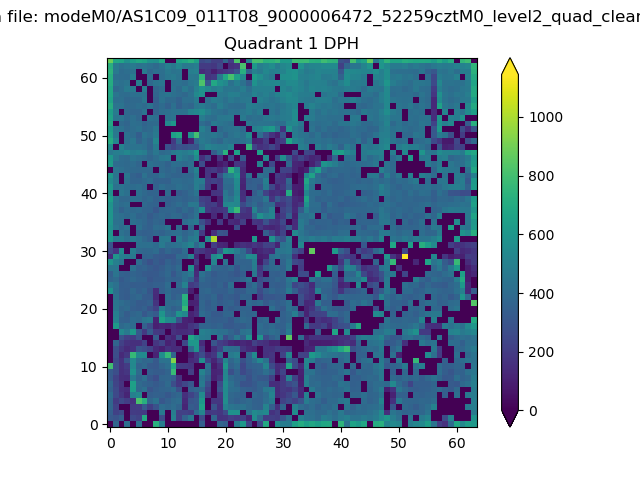 |
Quadrant B |
|---|---|---|---|
| Quadrant D | 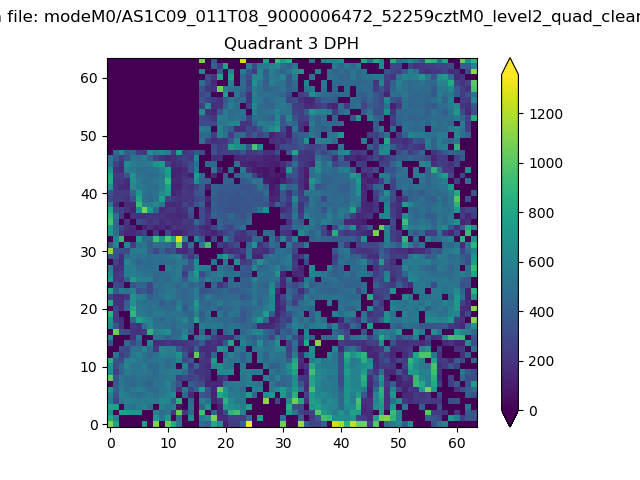 |
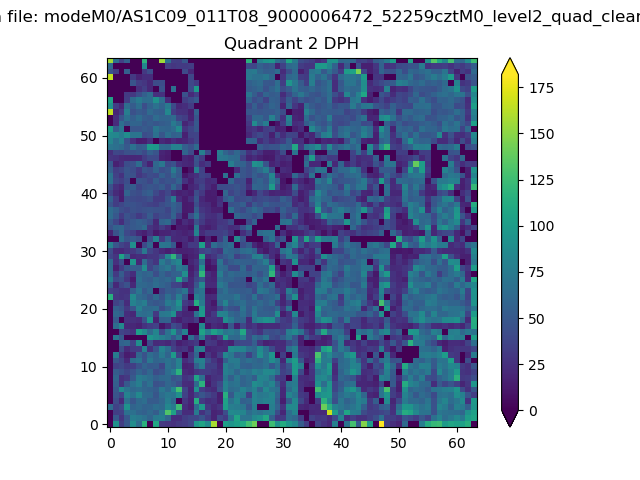 |
Quadrant C |
| Plot type | Count rate plots | Images |
|---|---|---|
| Comparison with Poisson distribution Blue bars denote a histogram of data divided into 1 sec bins. Red curve is a Poisson curve with rate = median count rate of data. |
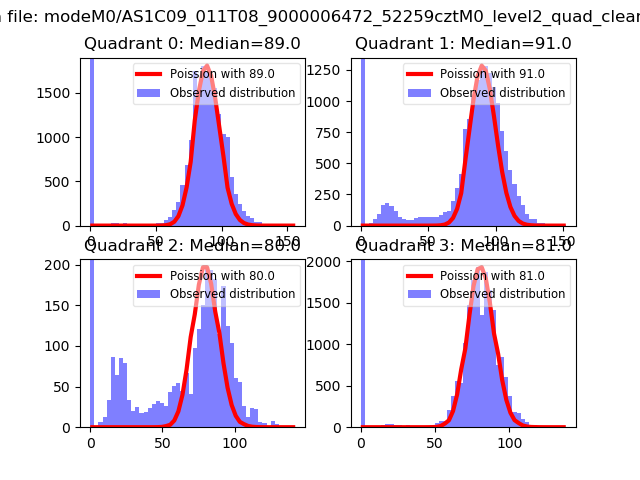 |
 |
| Quadrant-wise count rates Data is divided into 100 sec bins |
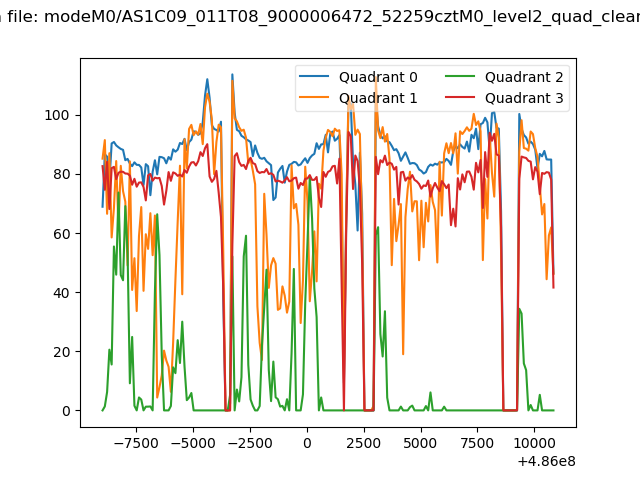 |
|
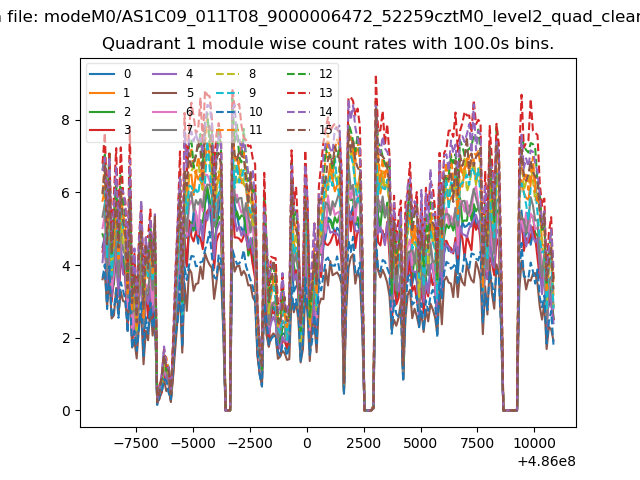
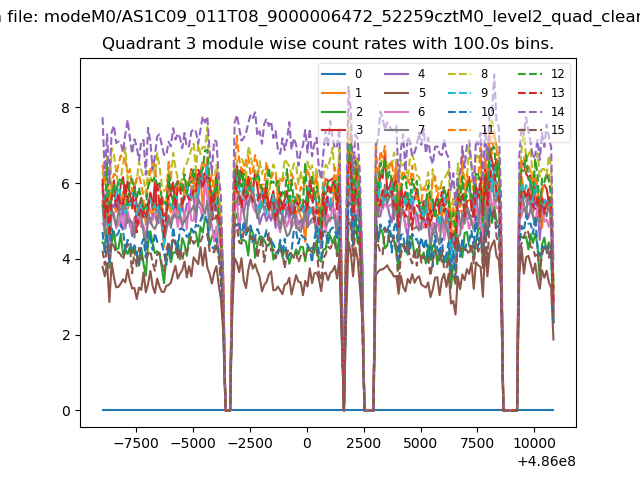
| Module-wise count rates for Quadrant A Data is divided into 100 sec bins |
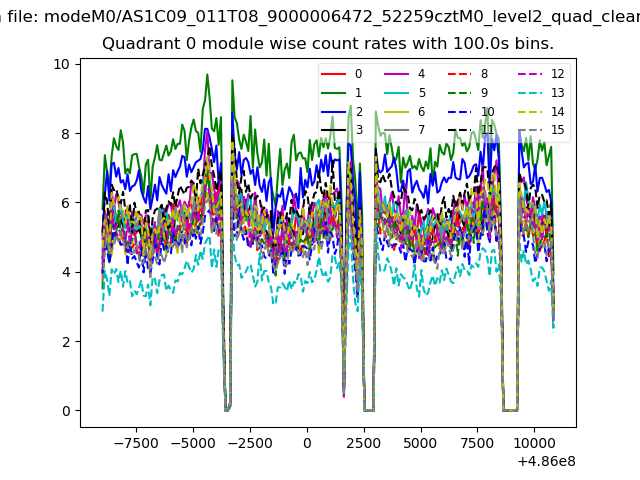 |
 |
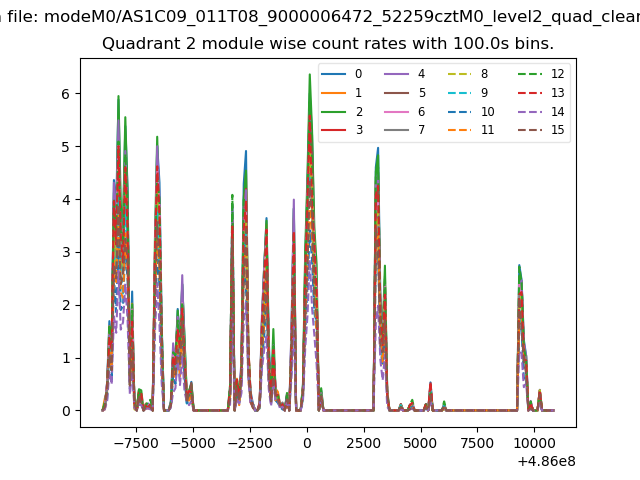
| Module-wise count rates for Quadrant B Data is divided into 100 sec bins |
 |
 |
| Module-wise count rates for Quadrant C Data is divided into 100 sec bins |
 |
 |
| Module-wise count rates for Quadrant D Data is divided into 100 sec bins |
 |
 |
| Parameter | Plot |
|---|---|
| CZT HV Monitor | 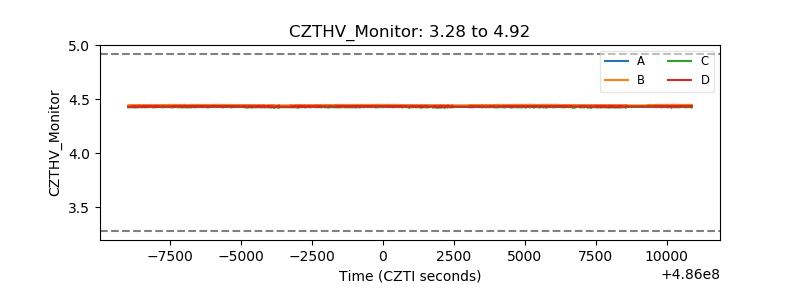 |
| D_VDD | 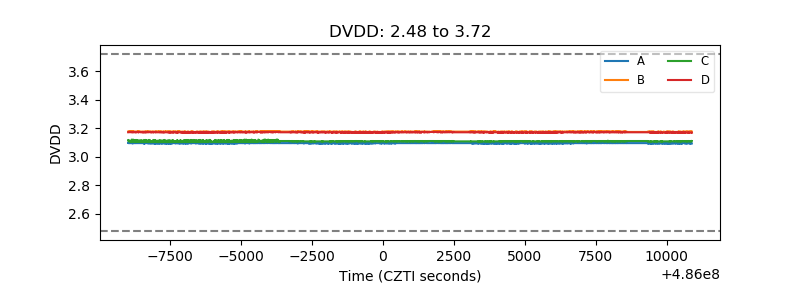 |
| Temperature 1 | 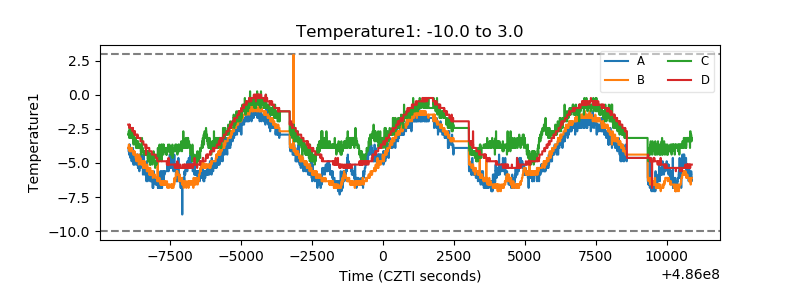 |
| Veto HV Monitor | 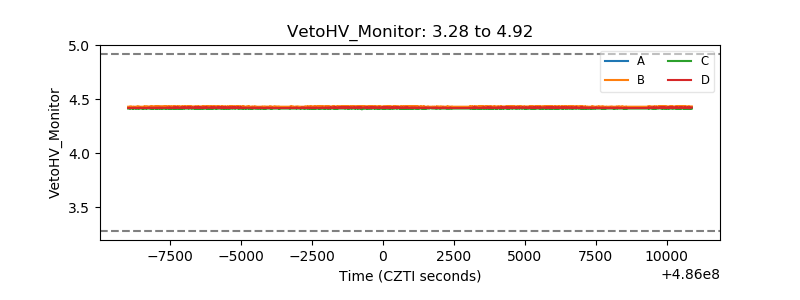 |
| Veto LLD | 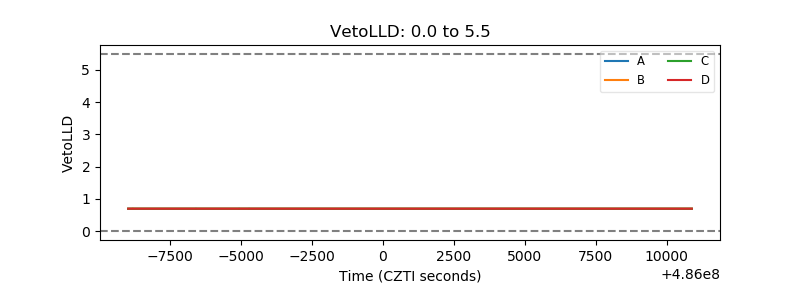 |
| Alpha Counter | 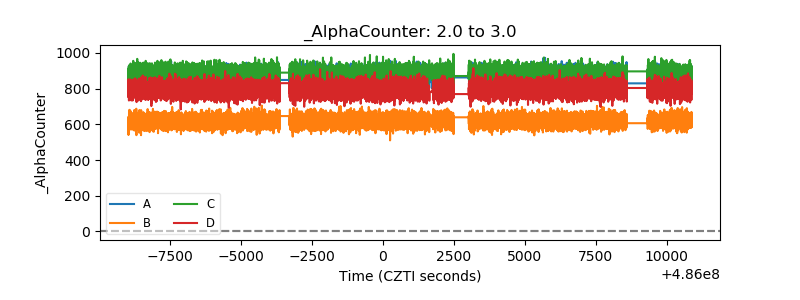 |
| _CPM_Rate | 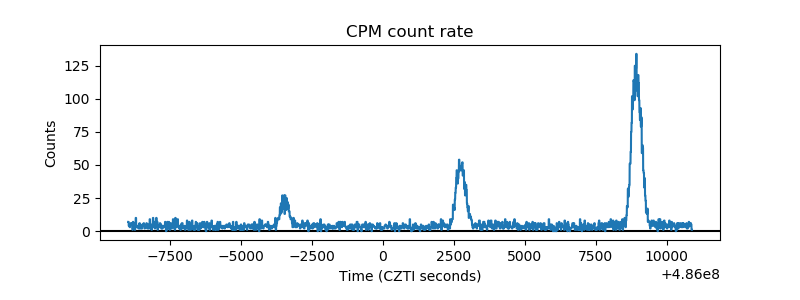 |
| CZT Counter | 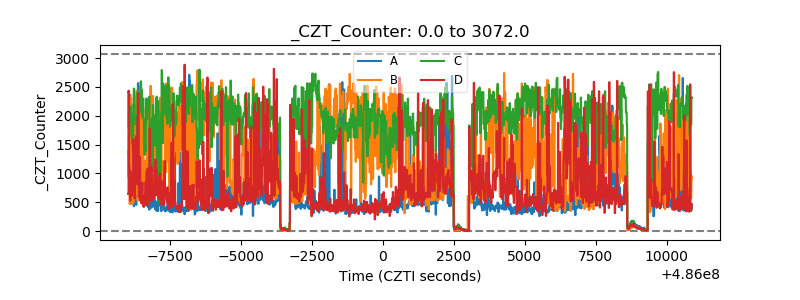 |
| +2.5 Volts monitor | 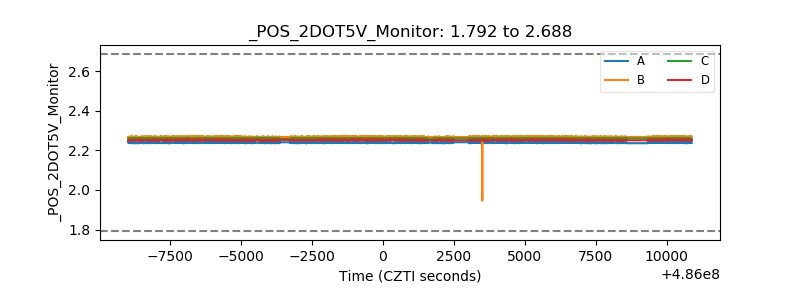 |
| +5 Volts monitor | 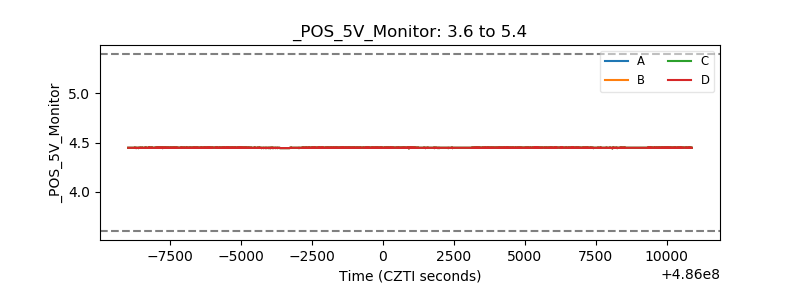 |
| _ROLL_ROT | 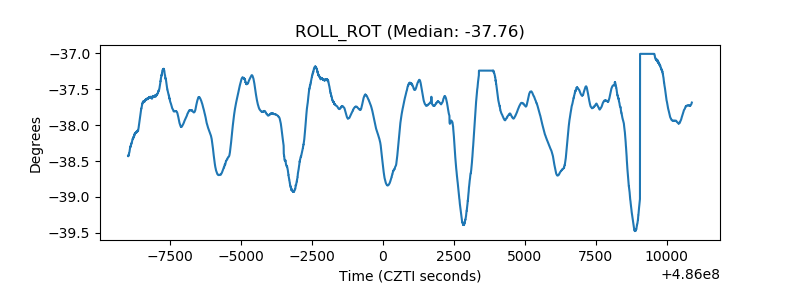 |
| _Roll_DEC | 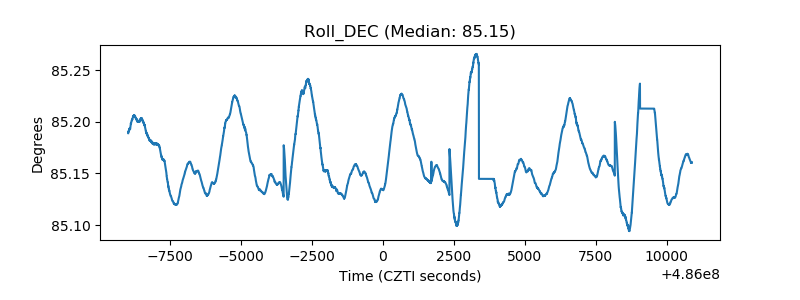 |
| _Roll_RA | 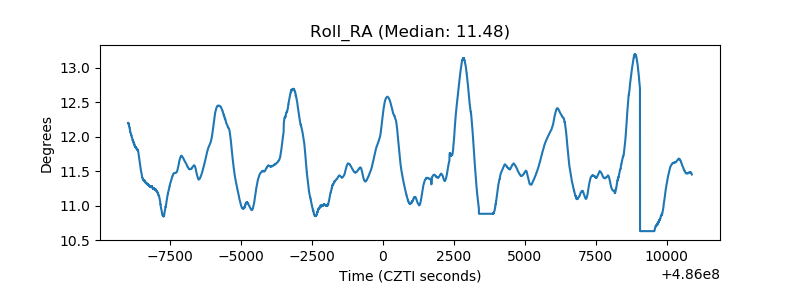 |
| Veto Counter | 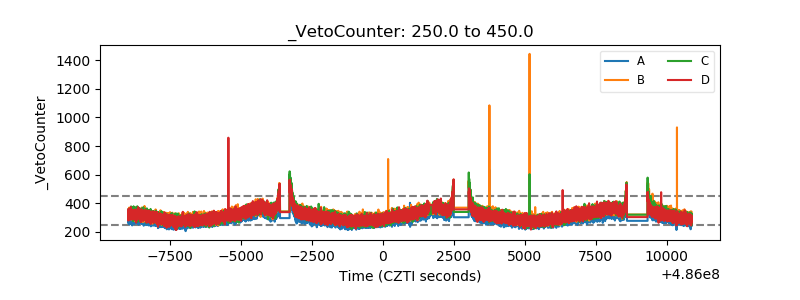 |