| Param | Original file | Final file |
|---|---|---|
| Filename | modeM0/AS1C09_011T08_9000006472_52260cztM0_level2.fits | modeM0/AS1C09_011T08_9000006472_52260cztM0_level2_quad_clean.evt |
| Size (bytes) | 545,316,480 | 48,859,200 |
| Size | 520.1 MB | 46.6 MB |
| Events in quadrant A | 2,642,303 | 406,201 |
| Events in quadrant B | 4,740,048 | 384,885 |
| Events in quadrant C | 9,795,095 | 4,714 |
| Events in quadrant D | 2,654,273 | 364,480 |
| Mode M0 | |||
|---|---|---|---|
| Quadrant | BADHDUFLAG | Total packets | Discarded packets |
| A | 0 | 11065 | 0 |
| B | 0 | 17196 | 0 |
| C | 0 | 32195 | 0 |
| D | 0 | 11353 | 0 |
| Mode SS | |||
|---|---|---|---|
| Quadrant | BADHDUFLAG | Total packets | Discarded packets |
| A | 0 | 90 | 0 |
| B | 0 | 90 | 0 |
| C | 0 | 90 | 0 |
| D | 0 | 90 | 0 |
| Quadrant | Total seconds | Saturated seconds | Saturation percentage |
|---|---|---|---|
| A | 4536 | 70 | 1.543210% |
| B | 4537 | 740 | 16.310337% |
| C | 4537 | 4500 | 99.184483% |
| D | 4537 | 97 | 2.137977% |
Noise dominated data is calculated using 1-second bins in cleaned event files. If a bin has >2000 counts, and if more than 50% of those come from <1% of pixels, then it is considered to be noise-dominated and hence unusable.
| Quadrant | # 1 sec bins | Bins with >0 counts | Bins with >2000 counts | High rate bins dominated by noise | Noise dominated (total time) | Noise dominated (detector-on time) | Marked lightcurve |
|---|---|---|---|---|---|---|---|
| A | 4536 | 4536 | 55 | 55 | 1.21% | 1.21% | 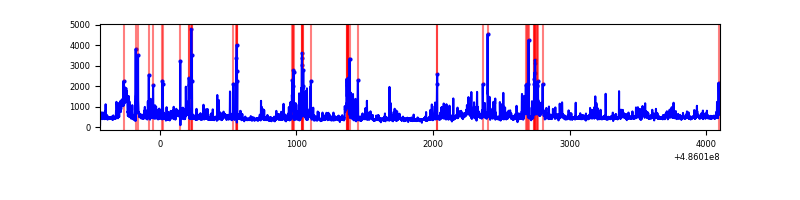 |
| B | 4537 | 4537 | 524 | 524 | 11.55% | 11.55% | 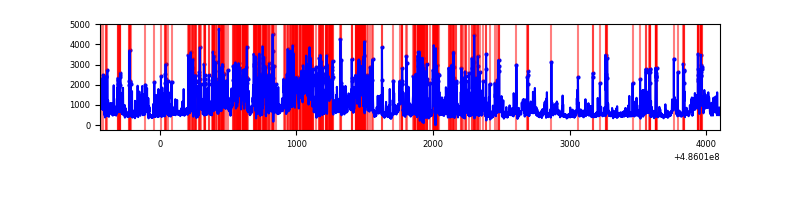 |
| C | 4536 | 4528 | 3089 | 3089 | 68.10% | 68.22% | 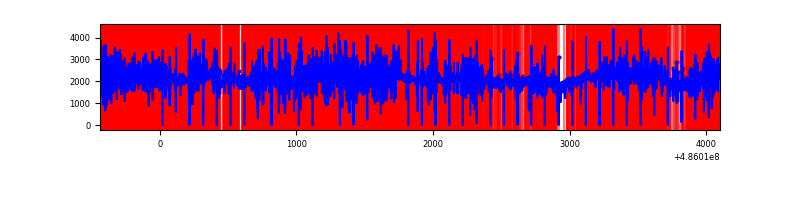 |
| D | 4537 | 4537 | 94 | 94 | 2.07% | 2.07% | 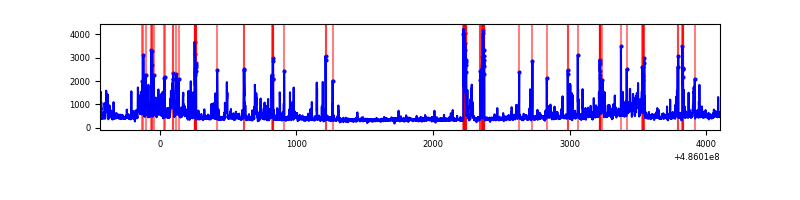 |
Top three noisy pixels from each quadrant. If the there are fewer than three noisy pixels in the level2.evt file, extra rows are filled as -1
| Pixel properties | Quadrant properties | ||||||
|---|---|---|---|---|---|---|---|
| Quadrant | DetID | PixID | Counts | Sigma | Mean | Median | Sigma |
| A | 4 | 249 | 218350 | 1963.58 | 446 | 435 | 111.0 |
| A | 11 | 3 | 181824 | 1634.46 | 446 | 435 | 111.0 |
| A | 15 | 250 | 109266 | 980.65 | 446 | 435 | 111.0 |
| B | 12 | 32 | 1386341 | 15378.16 | 417 | 403 | 90.1 |
| B | 7 | 0 | 685078 | 7597.05 | 417 | 403 | 90.1 |
| B | 0 | 213 | 385381 | 4271.66 | 417 | 403 | 90.1 |
| C | 15 | 158 | 7798652 | 249822.47 | 108 | 107 | 31.2 |
| C | 15 | 224 | 685920 | 21969.67 | 108 | 107 | 31.2 |
| C | 15 | 178 | 598586 | 19171.97 | 108 | 107 | 31.2 |
| D | 8 | 176 | 244727 | 2013.8 | 428 | 409 | 121.3 |
| D | 11 | 176 | 143576 | 1180.06 | 428 | 409 | 121.3 |
| D | 7 | 46 | 109706 | 900.88 | 428 | 409 | 121.3 |
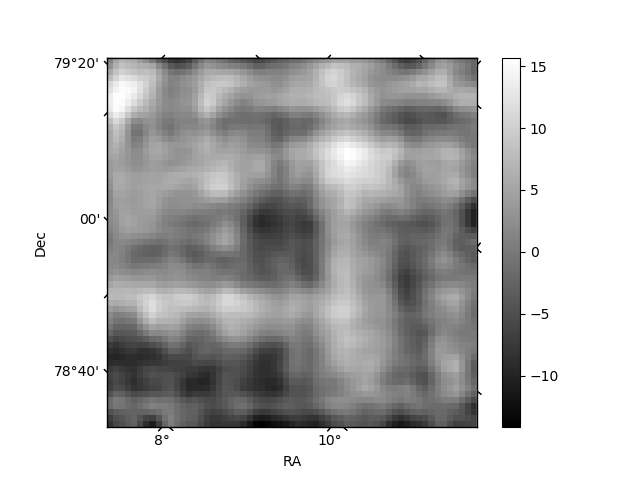
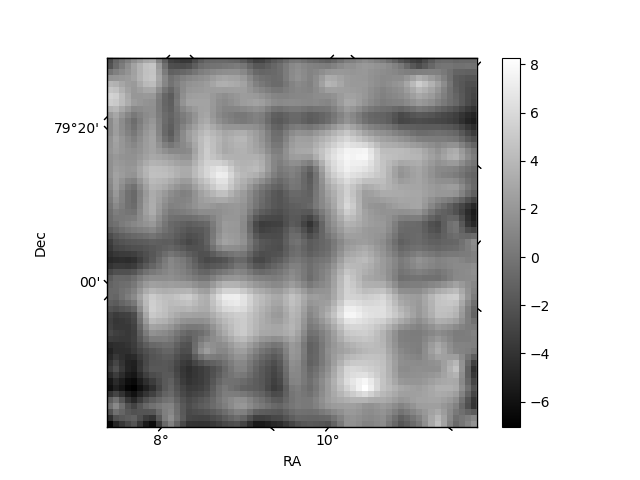
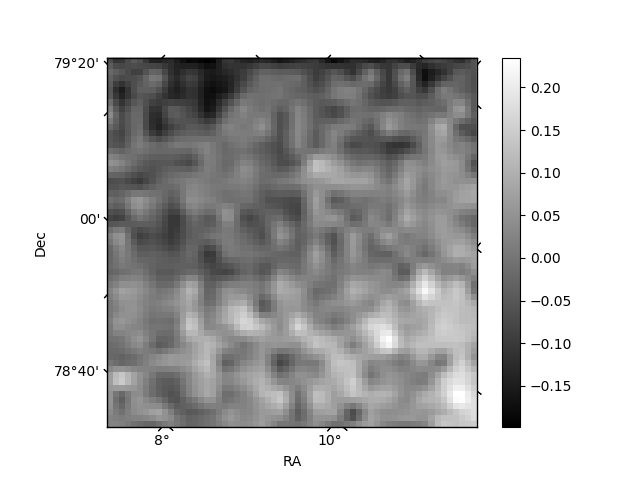
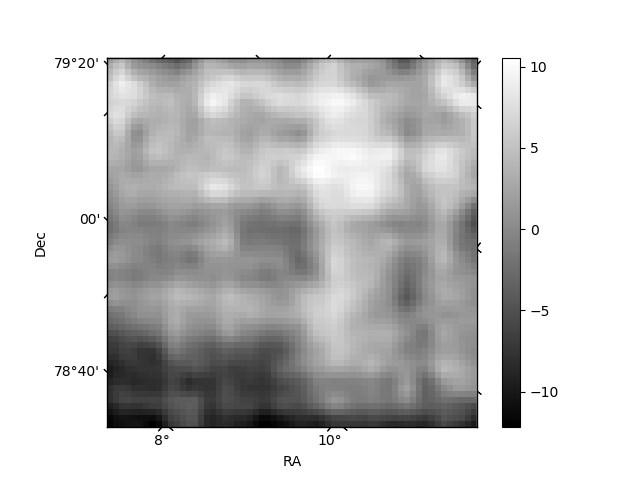
Histogram calculated using DETX and DETY for each event in the final _common_clean file
| Quadrant A | 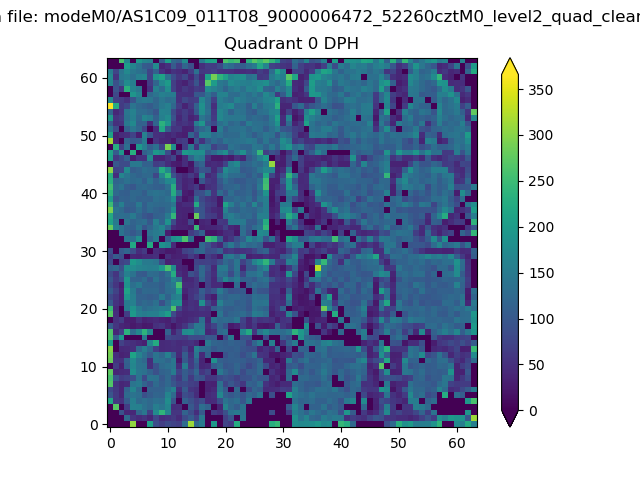 |
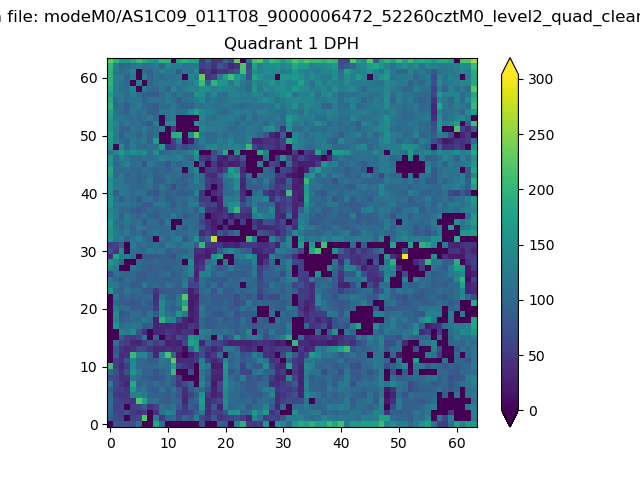 |
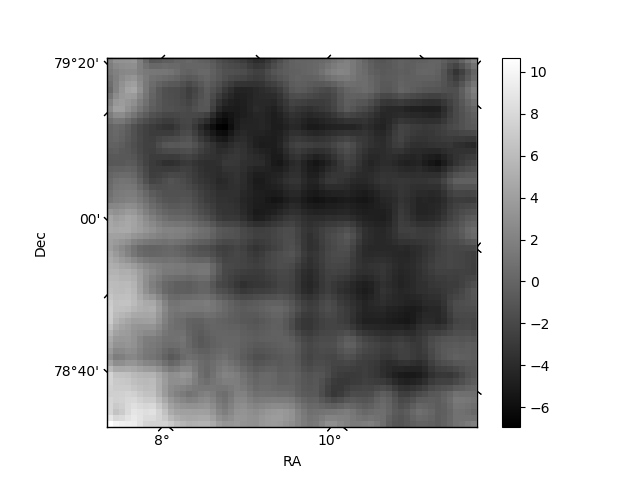
Quadrant B |
|---|---|---|---|
| Quadrant D | 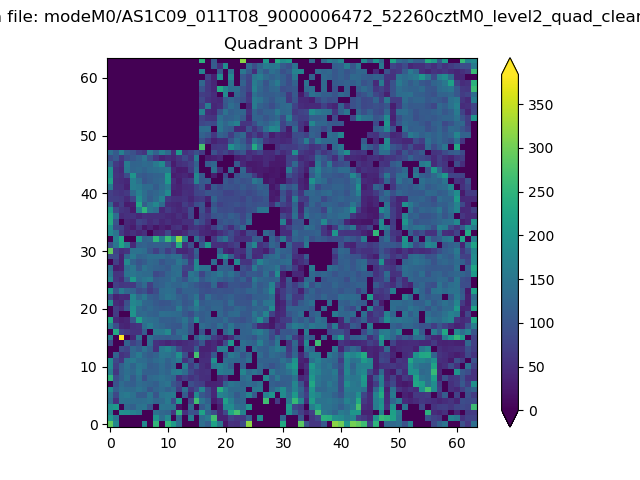 |
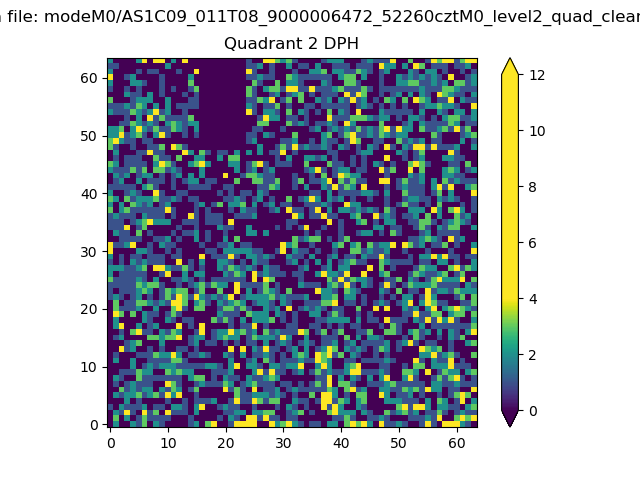 |
Quadrant C |
| Plot type | Count rate plots | Images |
|---|---|---|
| Comparison with Poisson distribution Blue bars denote a histogram of data divided into 1 sec bins. Red curve is a Poisson curve with rate = median count rate of data. |
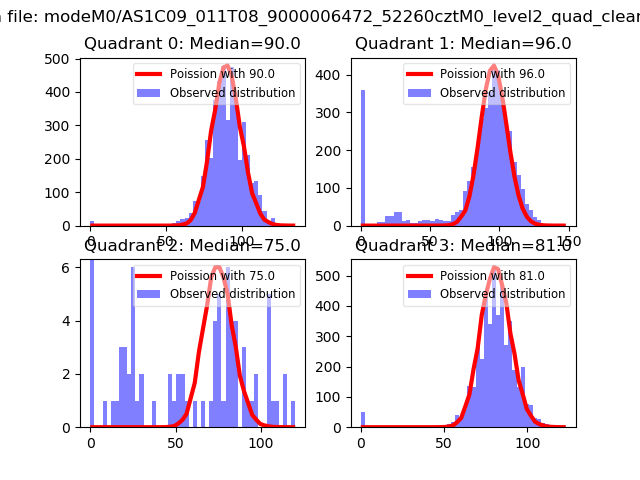 |
 |
| Quadrant-wise count rates Data is divided into 100 sec bins |
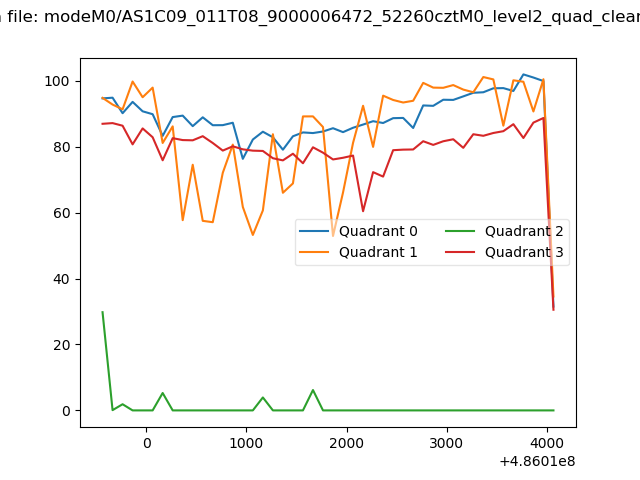 |
|
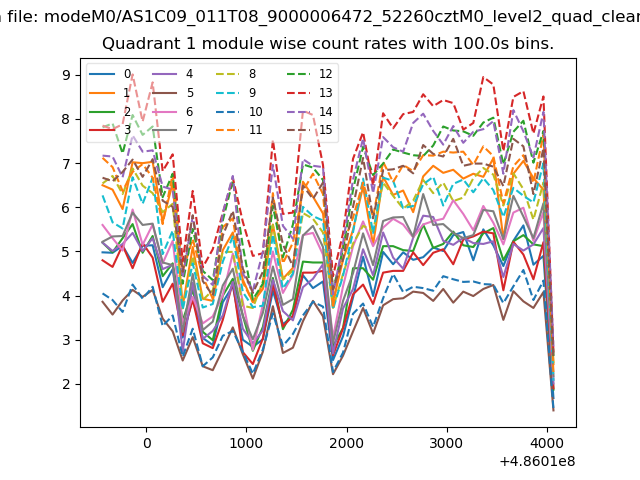
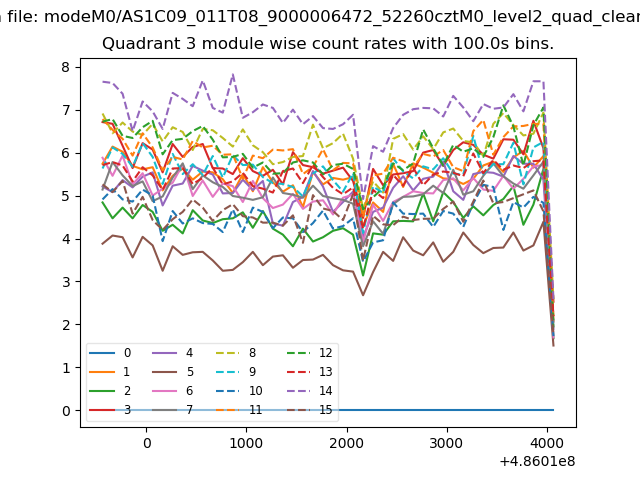
| Module-wise count rates for Quadrant A Data is divided into 100 sec bins |
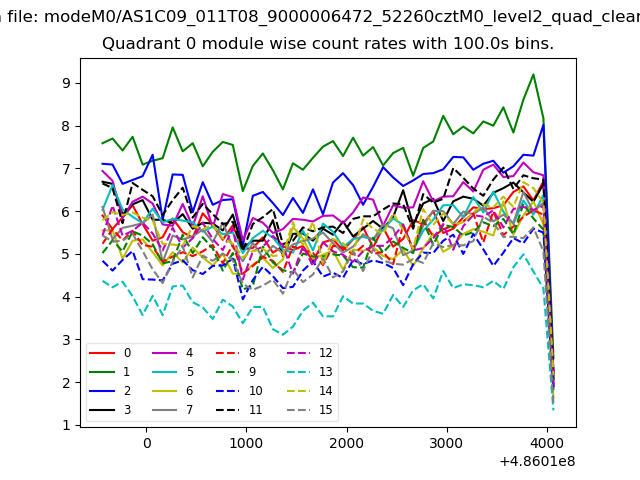 |
 |
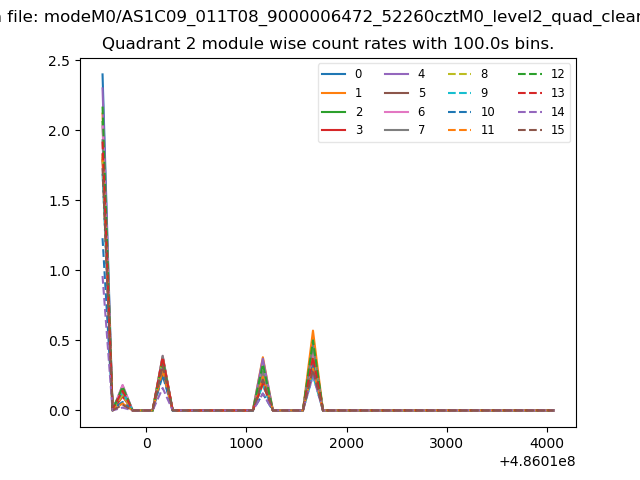
| Module-wise count rates for Quadrant B Data is divided into 100 sec bins |
 |
 |
| Module-wise count rates for Quadrant C Data is divided into 100 sec bins |
 |
 |
| Module-wise count rates for Quadrant D Data is divided into 100 sec bins |
 |
 |
| Parameter | Plot |
|---|---|
| CZT HV Monitor | 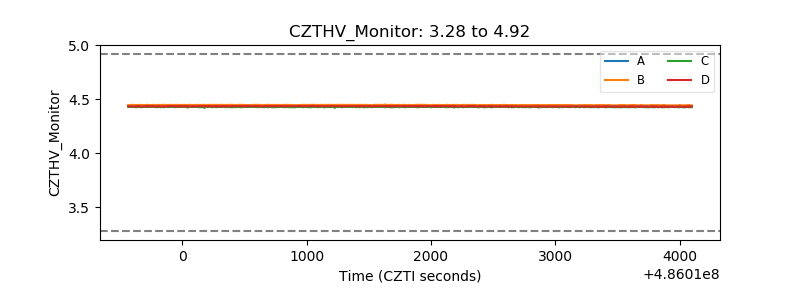 |
| D_VDD | 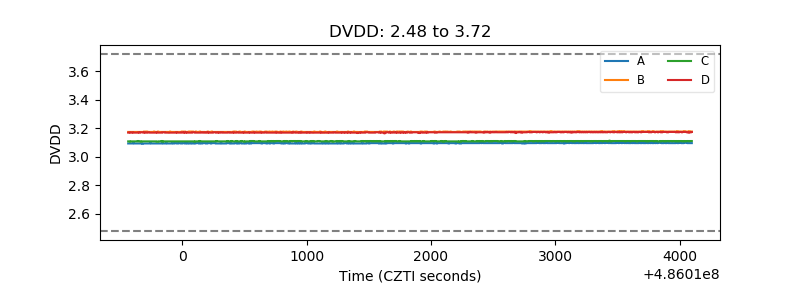 |
| Temperature 1 | 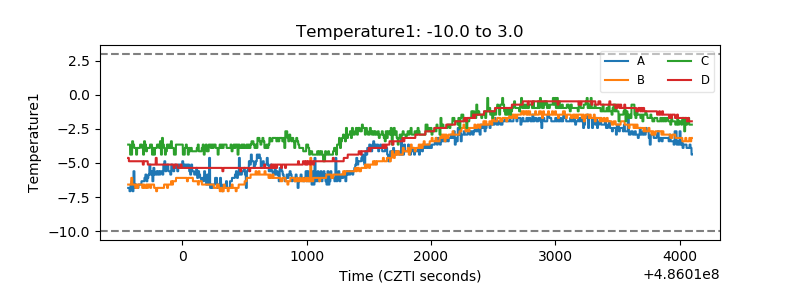 |
| Veto HV Monitor | 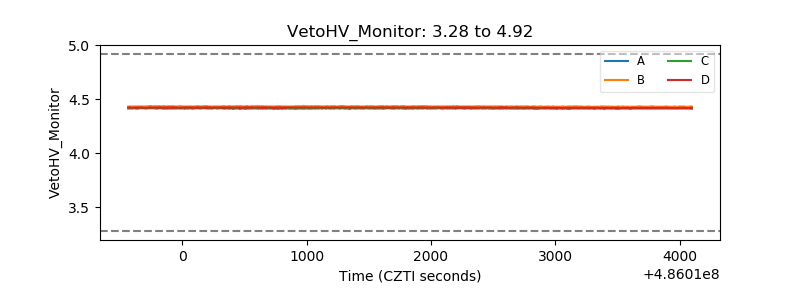 |
| Veto LLD | 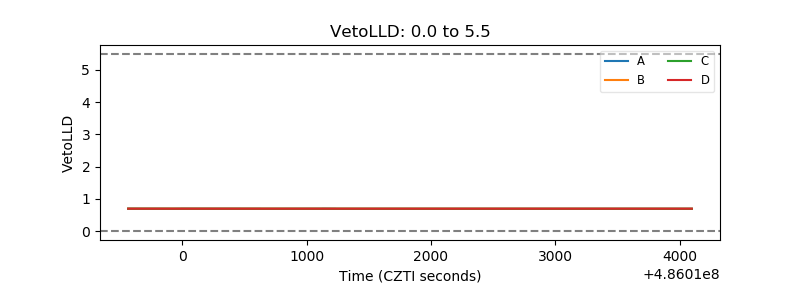 |
| Alpha Counter | 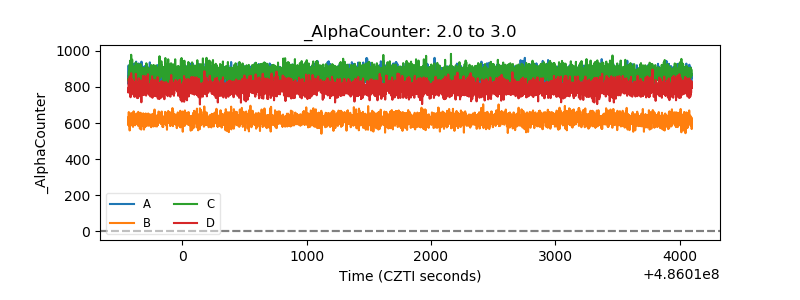 |
| _CPM_Rate | 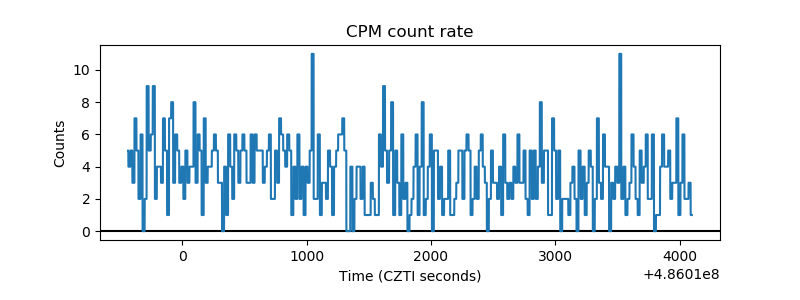 |
| CZT Counter | 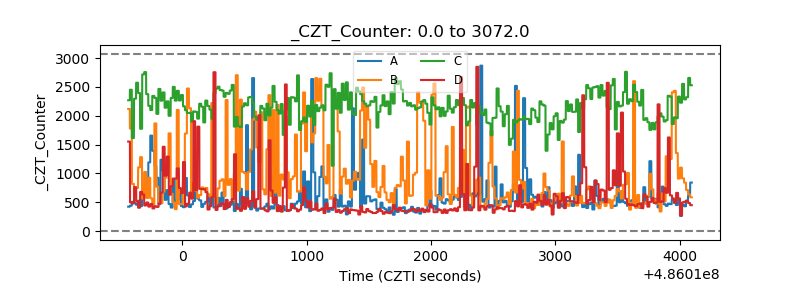 |
| +2.5 Volts monitor | 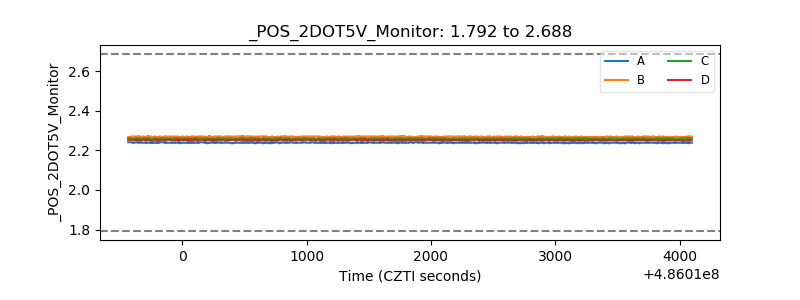 |
| +5 Volts monitor |  |
| _ROLL_ROT | 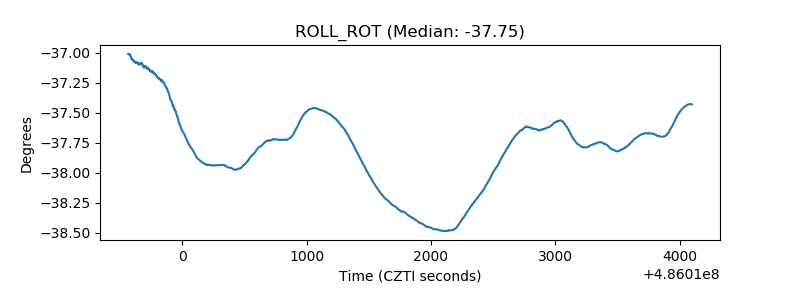 |
| _Roll_DEC | 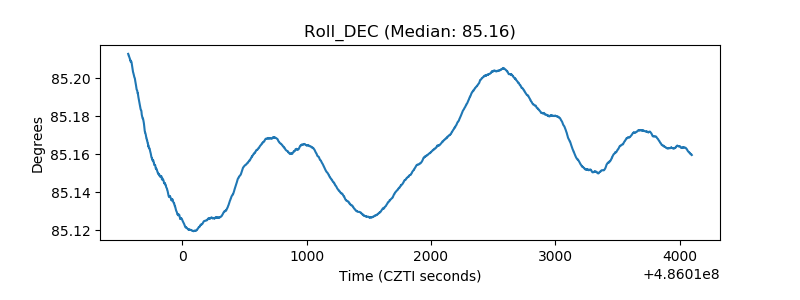 |
| _Roll_RA | 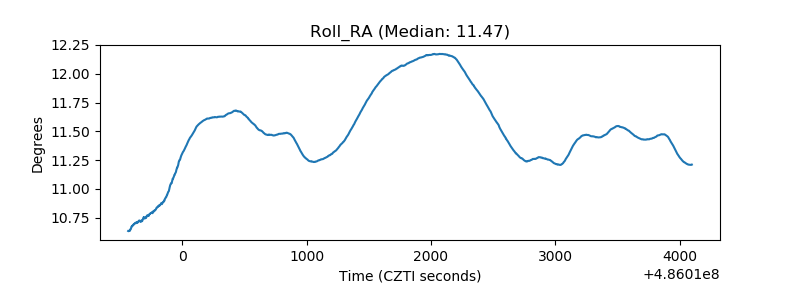 |
| Veto Counter | 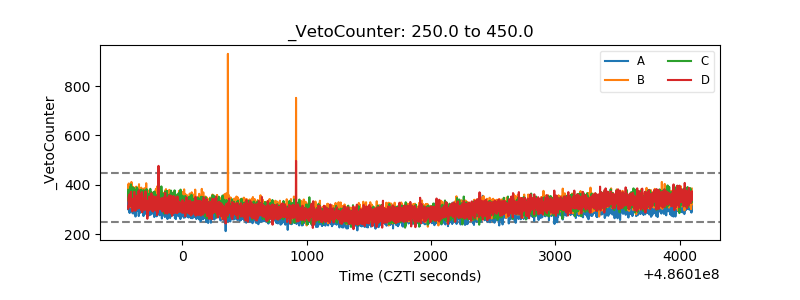 |