| Param | Original file | Final file |
|---|---|---|
| Filename | modeM0/AS1C09_011T05_9000006474cztM0_level2.fits | modeM0/AS1C09_011T05_9000006474cztM0_level2_quad_clean.evt |
| Size (bytes) | 2,172,648,960 | 1,049,552,640 |
| Size | 2.0 GB | 1000.9 MB |
| Events in quadrant A | 14,343,724 | 3,814,336 |
| Events in quadrant B | 13,141,380 | 3,653,984 |
| Events in quadrant C | 6,707,960 | 1,081,219 |
| Events in quadrant D | 10,683,674 | 2,458,734 |
| Mode M0 | |||
|---|---|---|---|
| Quadrant | BADHDUFLAG | Total packets | Discarded packets |
| A | 0 | 757190 | 0 |
| B | 0 | 1032544 | 0 |
| C | 0 | 1955739 | 0 |
| D | 0 | 1322606 | 0 |
| Mode SS | |||
|---|---|---|---|
| Quadrant | BADHDUFLAG | Total packets | Discarded packets |
| A | 0 | 6160 | 0 |
| B | 0 | 6158 | 0 |
| C | 0 | 6154 | 0 |
| D | 0 | 6158 | 0 |
| Mode M9 | |||
|---|---|---|---|
| Quadrant | BADHDUFLAG | Total packets | Discarded packets |
| A | 0 | 358 | 0 |
| B | 0 | 358 | 0 |
| C | 0 | 358 | 0 |
| D | 0 | 358 | 0 |
| Quadrant | Total seconds | Saturated seconds | Saturation percentage |
|---|---|---|---|
| A | 303075 | 12378 | 4.084138% |
| B | 303039 | 35340 | 11.661865% |
| C | 302933 | 219962 | 72.610775% |
| D | 303005 | 73611 | 24.293659% |
Noise dominated data is calculated using 1-second bins in cleaned event files. If a bin has >2000 counts, and if more than 50% of those come from <1% of pixels, then it is considered to be noise-dominated and hence unusable.
| Quadrant | # 1 sec bins | Bins with >0 counts | Bins with >2000 counts | High rate bins dominated by noise | Noise dominated (total time) | Noise dominated (detector-on time) | Marked lightcurve |
|---|---|---|---|---|---|---|---|
| A | 464726 | 302380 | 0 | 0 | 0.00% | 0.00% | 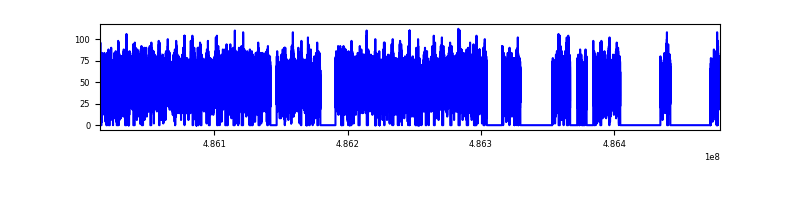 |
| B | 464726 | 302884 | 0 | 0 | 0.00% | 0.00% | 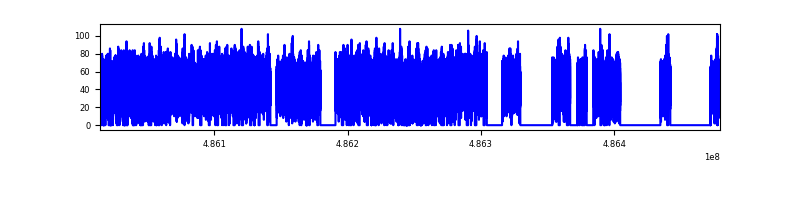 |
| C | 464725 | 277839 | 0 | 0 | 0.00% | 0.00% | 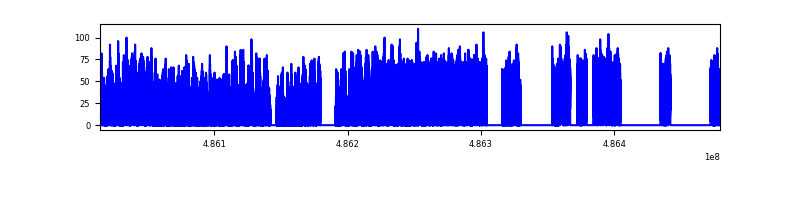 |
| D | 464725 | 300020 | 0 | 0 | 0.00% | 0.00% | 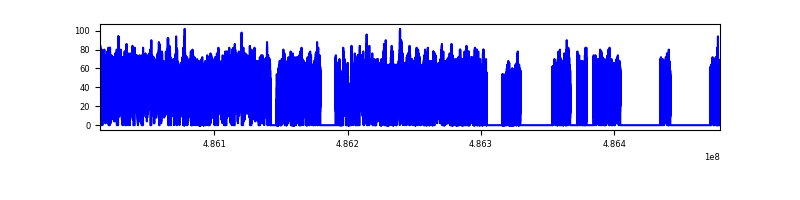 |
Top three noisy pixels from each quadrant. If the there are fewer than three noisy pixels in the level2.evt file, extra rows are filled as -1
| Pixel properties | Quadrant properties | ||||||
|---|---|---|---|---|---|---|---|
| Quadrant | DetID | PixID | Counts | Sigma | Mean | Median | Sigma |
| A | 14 | 188 | 16292 | 10.3 | 3802 | 3538 | 1238.1 |
| A | 9 | 255 | 15088 | 9.33 | 3802 | 3538 | 1238.1 |
| A | 14 | 204 | 13044 | 7.68 | 3802 | 3538 | 1238.1 |
| B | 2 | 9 | 15143 | 14.66 | 3492 | 3323 | 806.4 |
| B | 2 | 8 | 13983 | 13.22 | 3492 | 3323 | 806.4 |
| B | 9 | 173 | 10897 | 9.39 | 3492 | 3323 | 806.4 |
| C | 3 | 203 | 5418 | 6.16 | 1807 | 1651 | 612.0 |
| C | 2 | 31 | 5379 | 6.09 | 1807 | 1651 | 612.0 |
| C | 7 | 221 | 5375 | 6.09 | 1807 | 1651 | 612.0 |
| D | 6 | 218 | 14190 | 11.08 | 3065 | 2719 | 1035.0 |
| D | 15 | 11 | 10350 | 7.37 | 3065 | 2719 | 1035.0 |
| D | 6 | 207 | 9824 | 6.86 | 3065 | 2719 | 1035.0 |
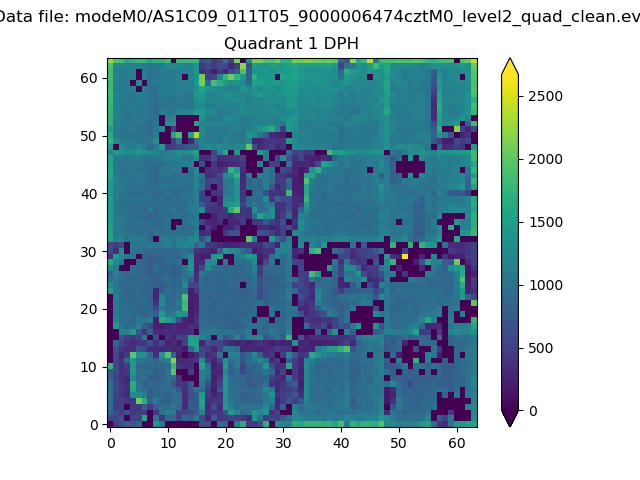
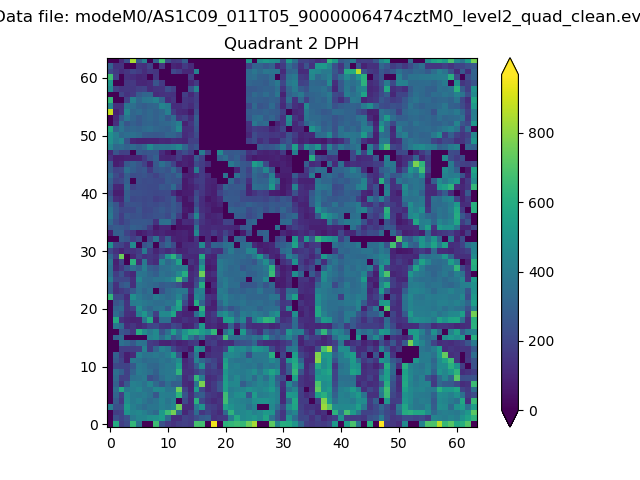
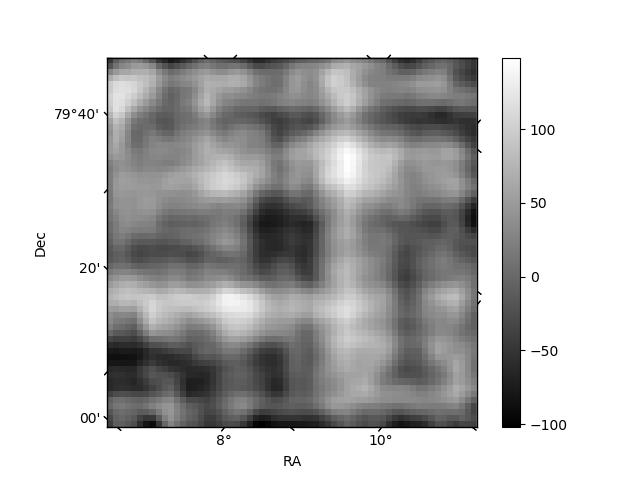
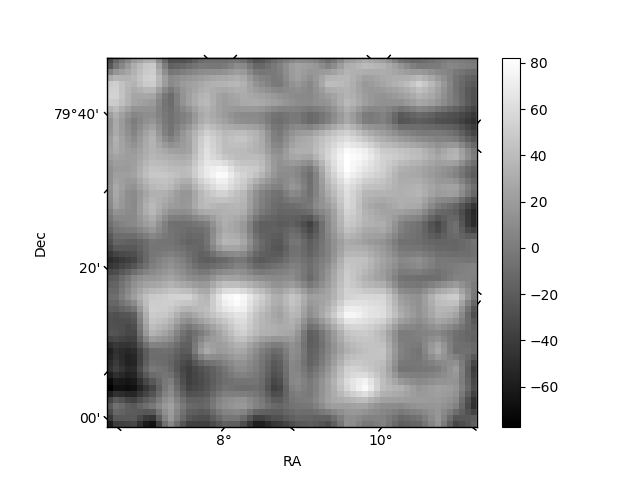
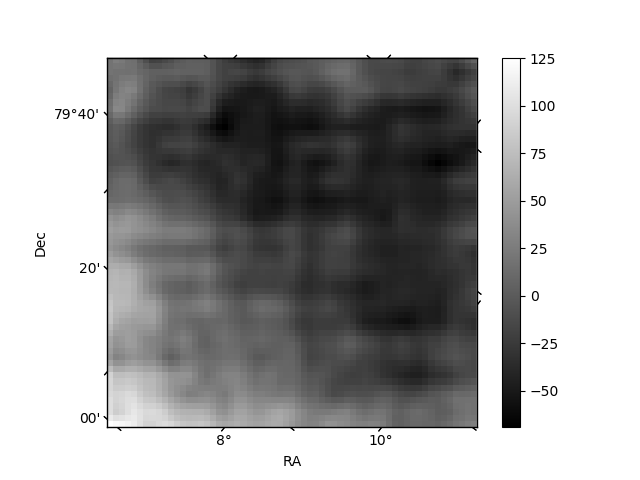
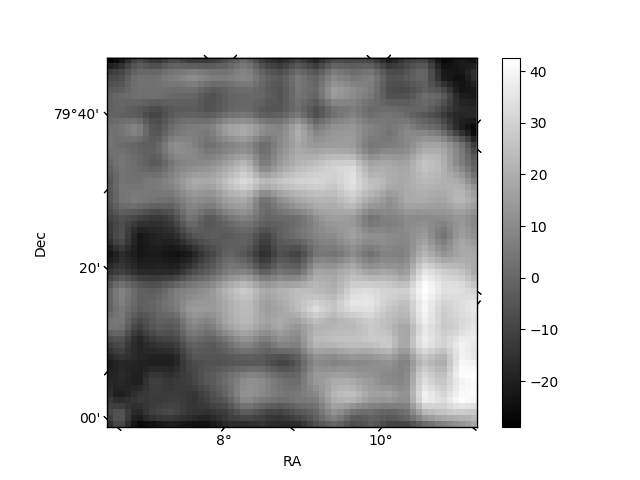
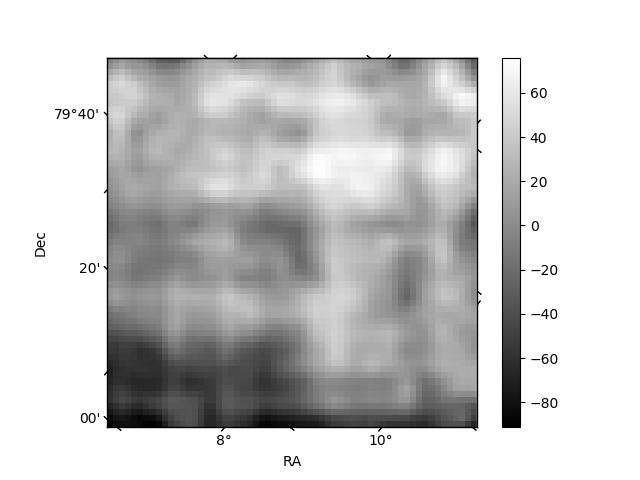
Histogram calculated using DETX and DETY for each event in the final _common_clean file
| Quadrant A |  |
 |
Quadrant B |
|---|---|---|---|
| Quadrant D | 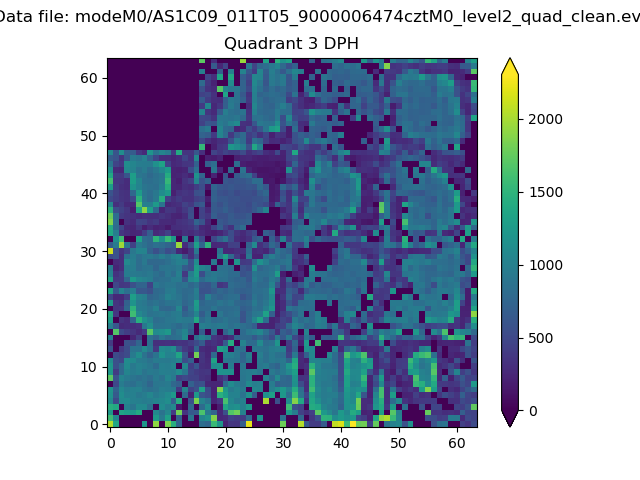 |
 |
Quadrant C |
| Plot type | Count rate plots | Images |
|---|---|---|
| Comparison with Poisson distribution Blue bars denote a histogram of data divided into 1 sec bins. Red curve is a Poisson curve with rate = median count rate of data. |
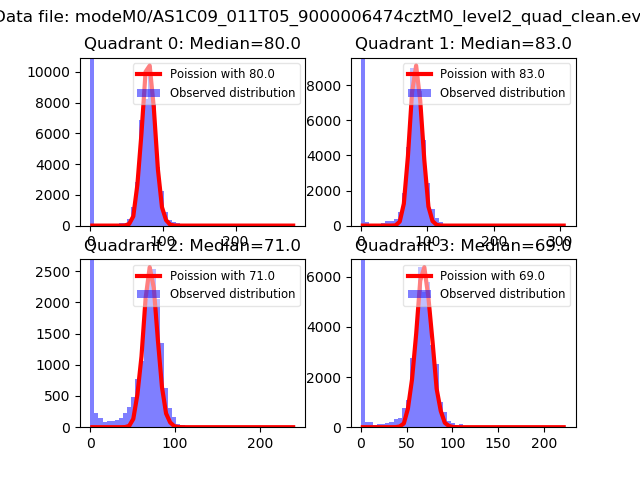 |
 |
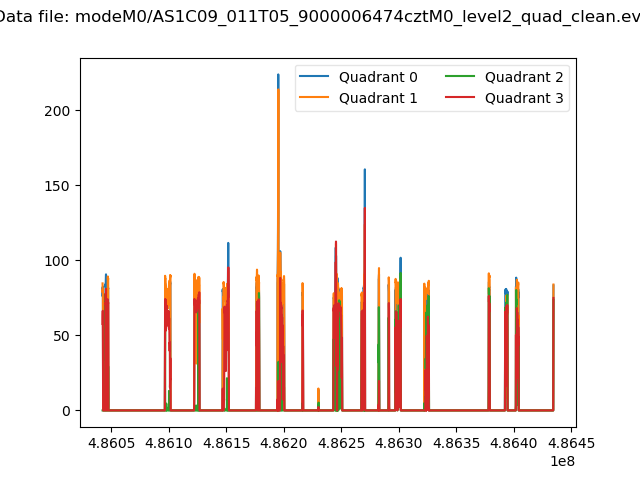
| Quadrant-wise count rates Data is divided into 100 sec bins |
 |
|
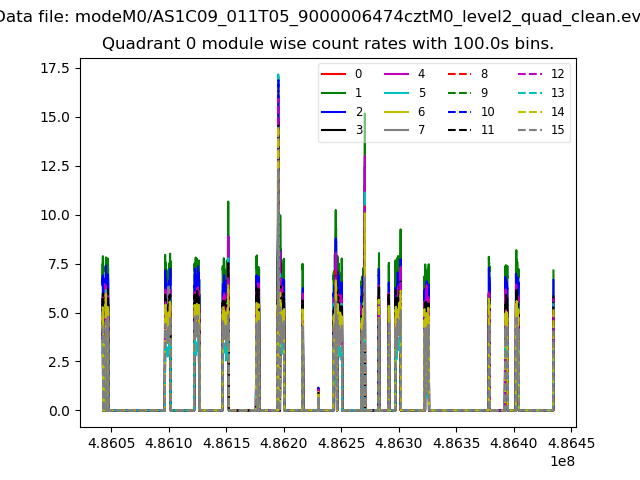
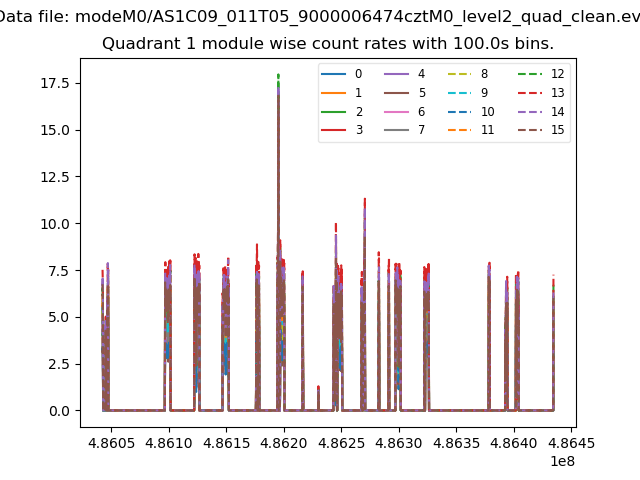
| Module-wise count rates for Quadrant A Data is divided into 100 sec bins |
 |
 |
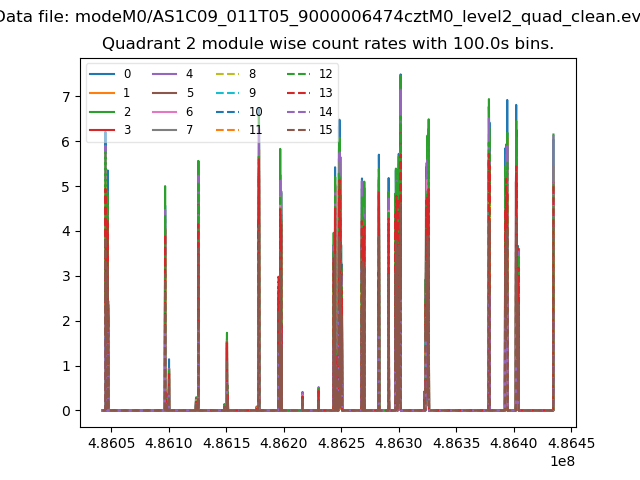
| Module-wise count rates for Quadrant B Data is divided into 100 sec bins |
 |
 |
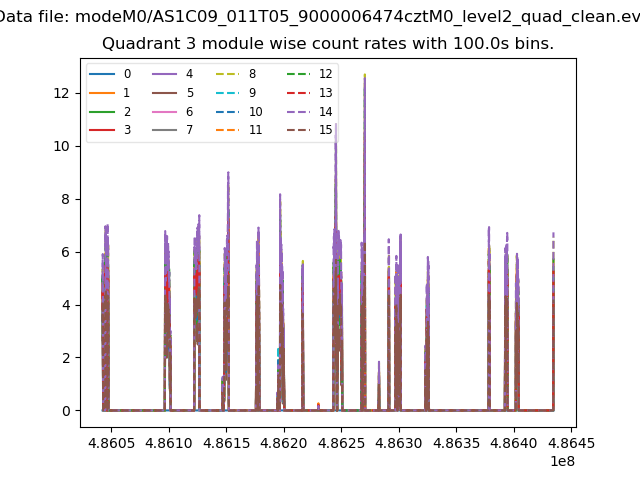
| Module-wise count rates for Quadrant C Data is divided into 100 sec bins |
 |
 |
| Module-wise count rates for Quadrant D Data is divided into 100 sec bins |
 |
 |
| Parameter | Plot |
|---|---|
| CZT HV Monitor | 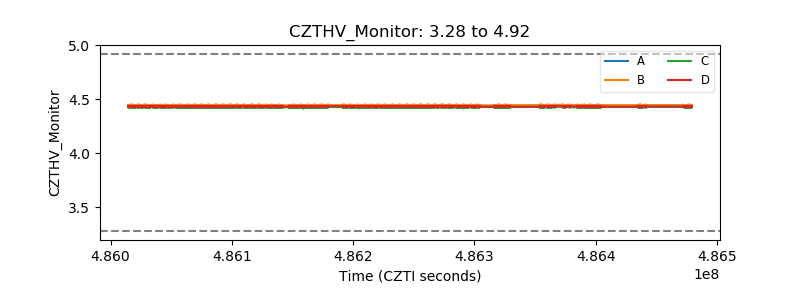 |
| D_VDD | 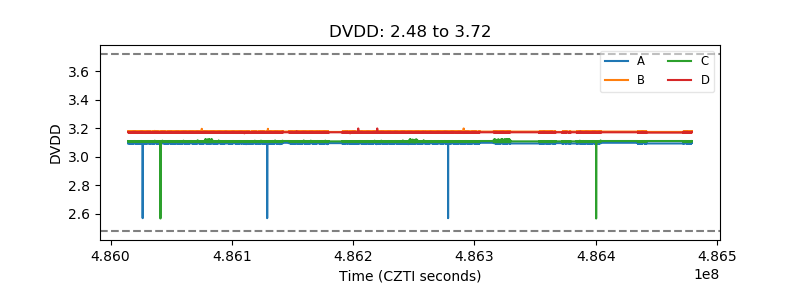 |
| Temperature 1 | 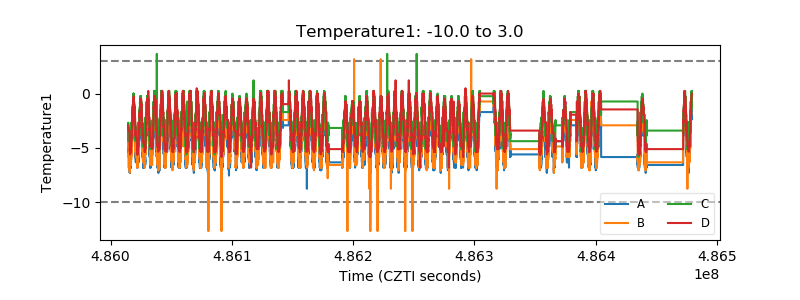 |
| Veto HV Monitor | 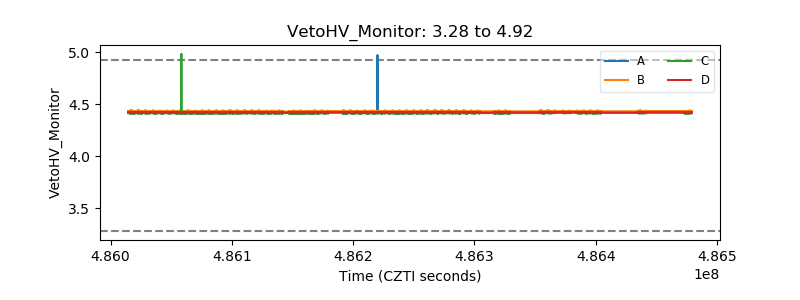 |
| Veto LLD | 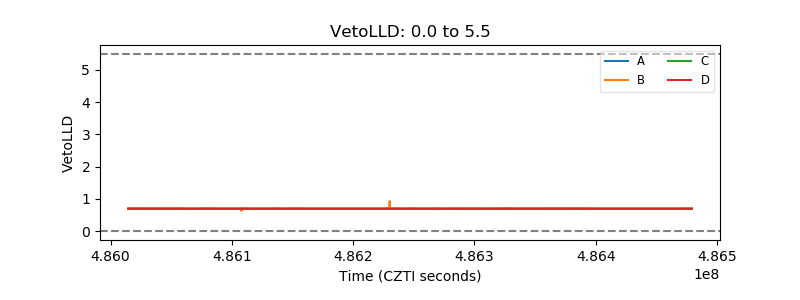 |
| Alpha Counter | 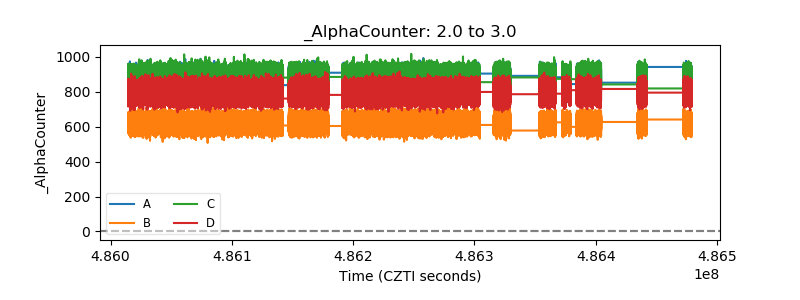 |
| _CPM_Rate |  |
| CZT Counter | 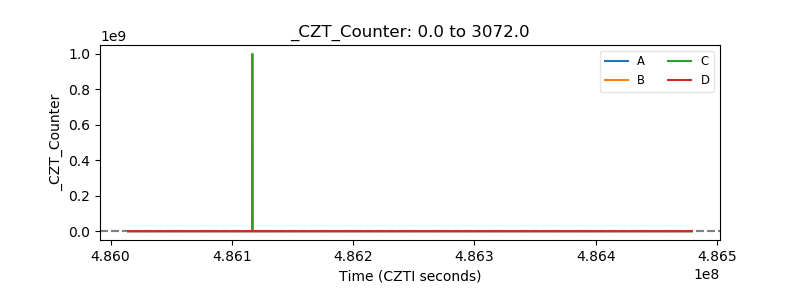 |
| +2.5 Volts monitor | 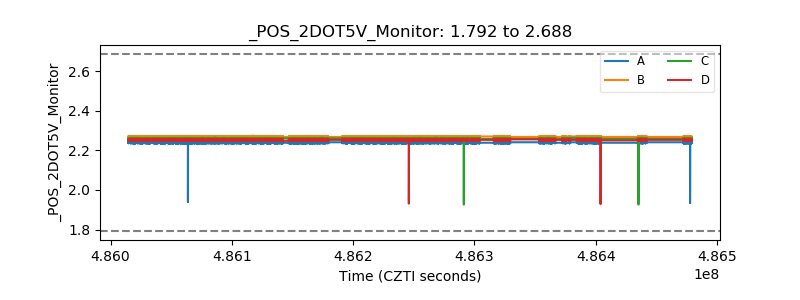 |
| +5 Volts monitor | 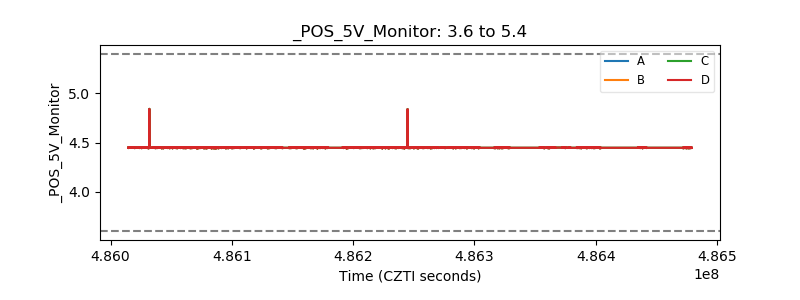 |
| _ROLL_ROT | 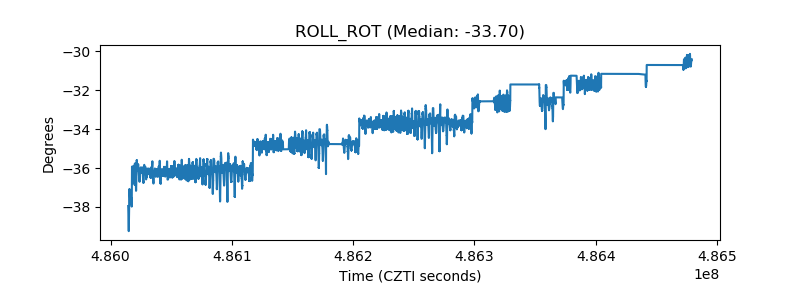 |
| _Roll_DEC | 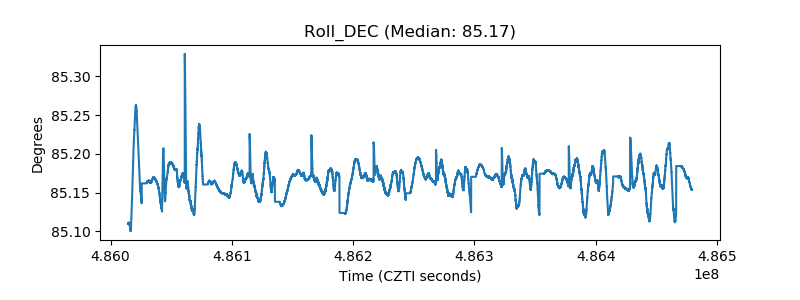 |
| _Roll_RA | 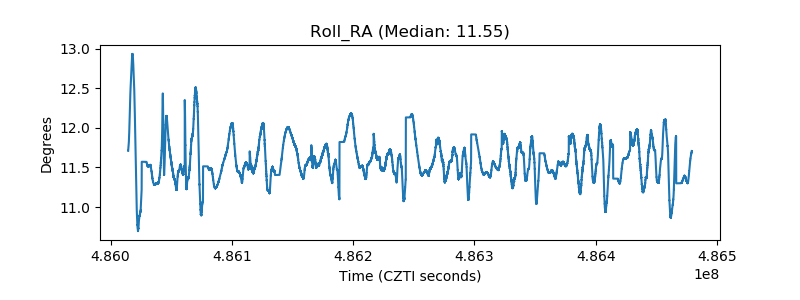 |
| Veto Counter | 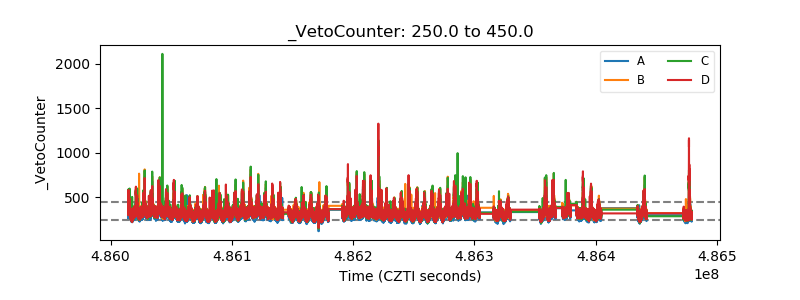 |