| Param | Original file | Final file |
|---|---|---|
| Filename | modeM0/AS1C09_011T05_9000006474_52262cztM0_level2.fits | modeM0/AS1C09_011T05_9000006474_52262cztM0_level2_quad_clean.evt |
| Size (bytes) | 807,796,800 | 61,951,680 |
| Size | 770.4 MB | 59.1 MB |
| Events in quadrant A | 3,853,126 | 521,072 |
| Events in quadrant B | 7,287,315 | 427,881 |
| Events in quadrant C | 13,497,401 | 37,653 |
| Events in quadrant D | 4,809,174 | 479,103 |
| Mode M0 | |||
|---|---|---|---|
| Quadrant | BADHDUFLAG | Total packets | Discarded packets |
| A | 0 | 15827 | 1 |
| B | 0 | 25701 | 8 |
| C | 0 | 44036 | 1 |
| D | 0 | 18410 | 1 |
| Mode SS | |||
|---|---|---|---|
| Quadrant | BADHDUFLAG | Total packets | Discarded packets |
| A | 0 | 120 | 0 |
| B | 0 | 120 | 0 |
| C | 0 | 120 | 0 |
| D | 0 | 120 | 0 |
| Mode M9 | |||
|---|---|---|---|
| Quadrant | BADHDUFLAG | Total packets | Discarded packets |
| A | 0 | 10 | 0 |
| B | 0 | 10 | 0 |
| C | 0 | 10 | 0 |
| D | 0 | 10 | 0 |
| Quadrant | Total seconds | Saturated seconds | Saturation percentage |
|---|---|---|---|
| A | 5862 | 369 | 6.294780% |
| B | 5861 | 1774 | 30.267872% |
| C | 5861 | 5536 | 94.454871% |
| D | 5861 | 288 | 4.913837% |
Noise dominated data is calculated using 1-second bins in cleaned event files. If a bin has >2000 counts, and if more than 50% of those come from <1% of pixels, then it is considered to be noise-dominated and hence unusable.
| Quadrant | # 1 sec bins | Bins with >0 counts | Bins with >2000 counts | High rate bins dominated by noise | Noise dominated (total time) | Noise dominated (detector-on time) | Marked lightcurve |
|---|---|---|---|---|---|---|---|
| A | 6867 | 5863 | 270 | 270 | 3.93% | 4.61% | 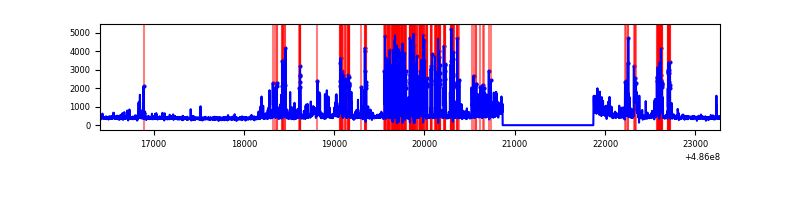 |
| B | 6866 | 5858 | 1235 | 1235 | 17.99% | 21.08% | 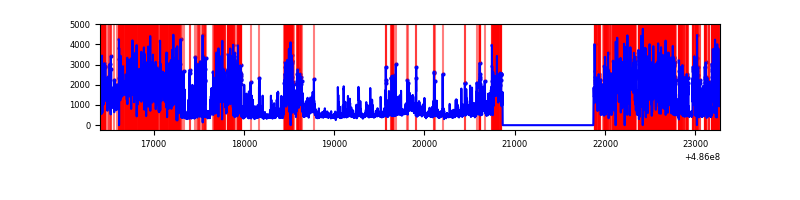 |
| C | 6866 | 5859 | 4505 | 4505 | 65.61% | 76.89% | 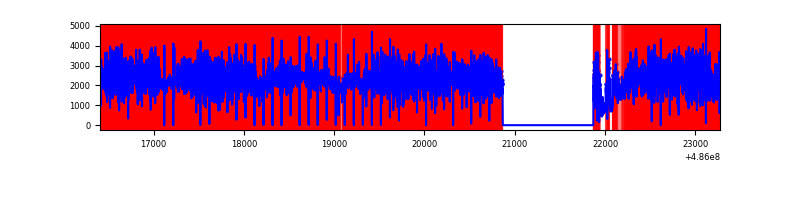 |
| D | 6866 | 5862 | 298 | 298 | 4.34% | 5.08% | 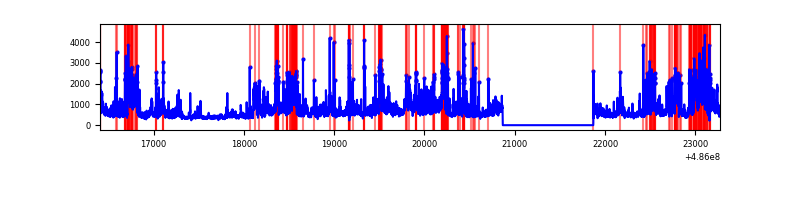 |
Top three noisy pixels from each quadrant. If the there are fewer than three noisy pixels in the level2.evt file, extra rows are filled as -1
| Pixel properties | Quadrant properties | ||||||
|---|---|---|---|---|---|---|---|
| Quadrant | DetID | PixID | Counts | Sigma | Mean | Median | Sigma |
| A | 11 | 3 | 736370 | 5037.76 | 588 | 575 | 146.1 |
| A | 4 | 249 | 327415 | 2237.77 | 588 | 575 | 146.1 |
| A | 6 | 145 | 157431 | 1073.94 | 588 | 575 | 146.1 |
| B | 12 | 32 | 3430244 | 31576.72 | 508 | 491 | 108.6 |
| B | 10 | 254 | 826125 | 7601.37 | 508 | 491 | 108.6 |
| B | 4 | 171 | 203881 | 1872.55 | 508 | 491 | 108.6 |
| C | 15 | 158 | 9791074 | 153671.57 | 229 | 228 | 63.7 |
| C | 15 | 224 | 1313513 | 20612.58 | 229 | 228 | 63.7 |
| C | 15 | 178 | 817250 | 12823.51 | 229 | 228 | 63.7 |
| D | 6 | 42 | 1309236 | 8081.51 | 570 | 543 | 161.9 |
| D | 11 | 176 | 393618 | 2427.34 | 570 | 543 | 161.9 |
| D | 8 | 176 | 273649 | 1686.5 | 570 | 543 | 161.9 |
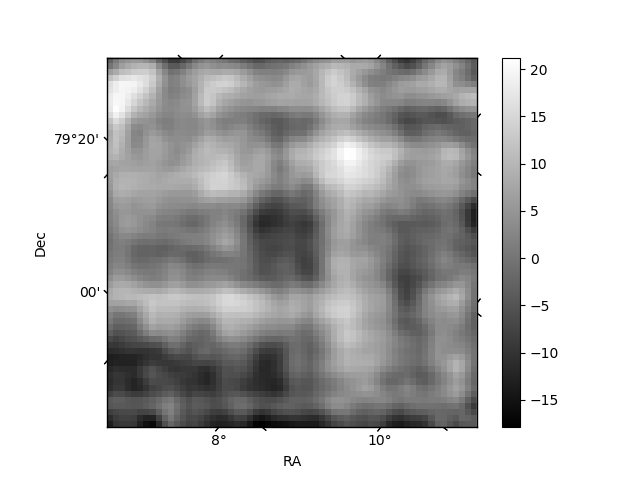
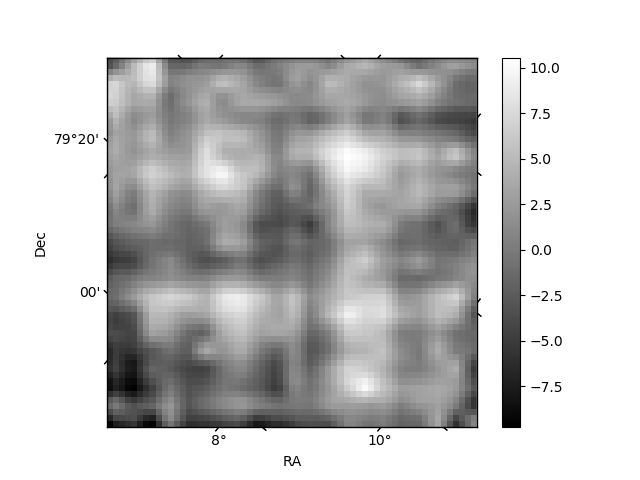
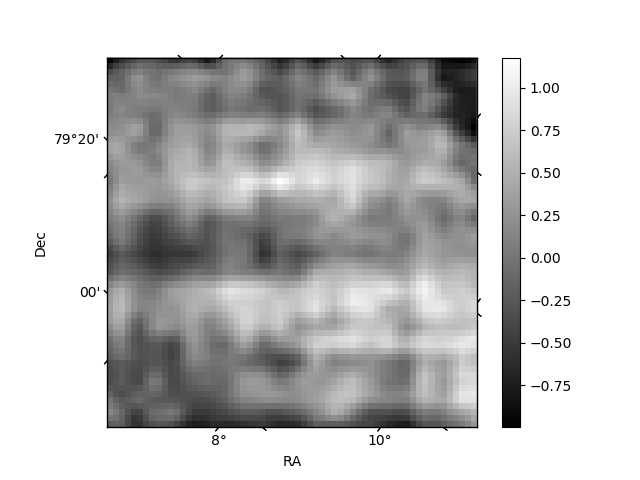
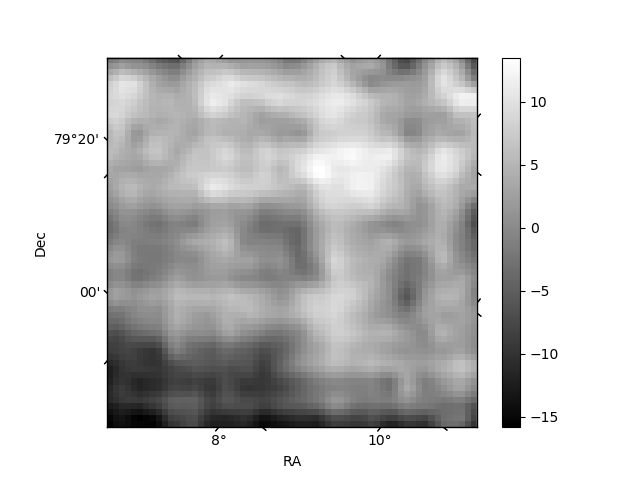
Histogram calculated using DETX and DETY for each event in the final _common_clean file
| Quadrant A | 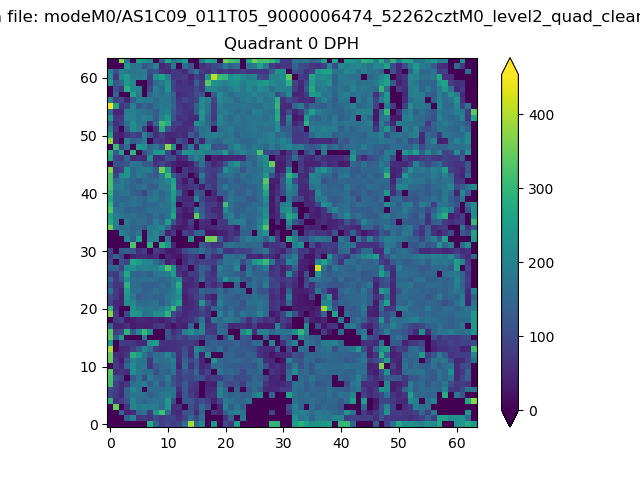 |
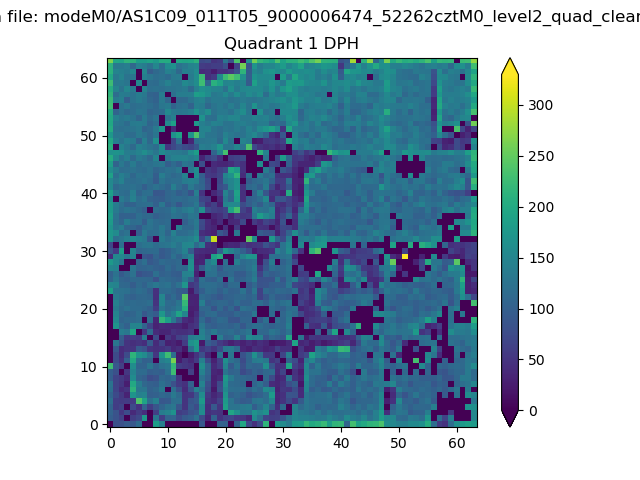 |
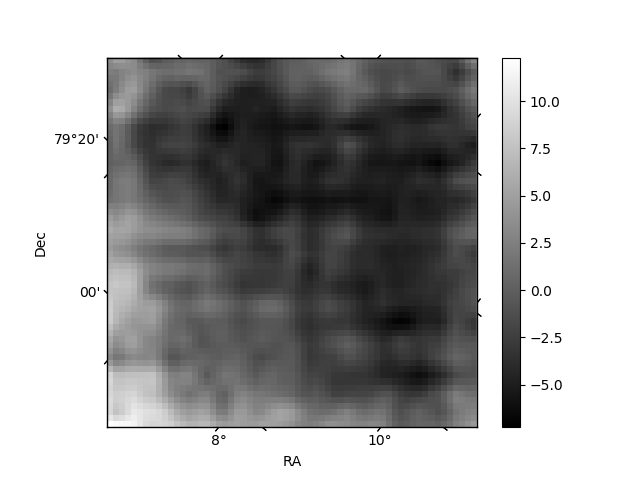
Quadrant B |
|---|---|---|---|
| Quadrant D | 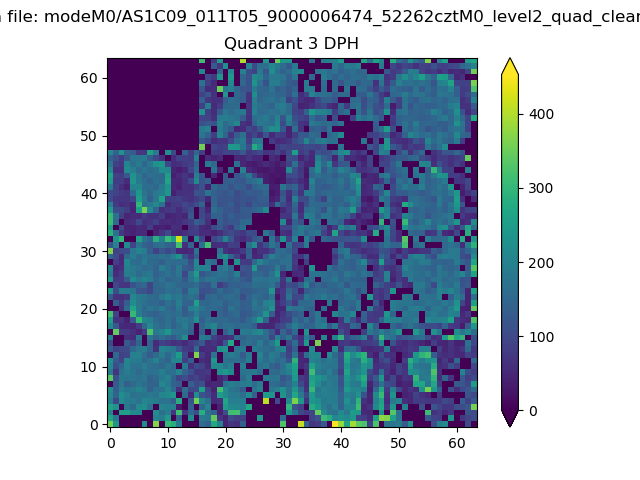 |
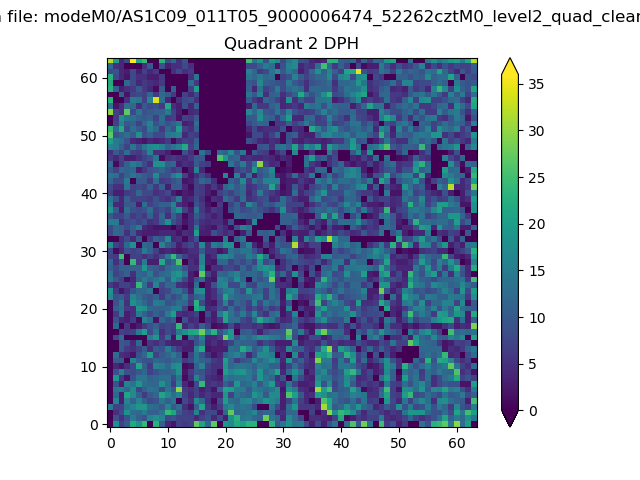 |
Quadrant C |
| Plot type | Count rate plots | Images |
|---|---|---|
| Comparison with Poisson distribution Blue bars denote a histogram of data divided into 1 sec bins. Red curve is a Poisson curve with rate = median count rate of data. |
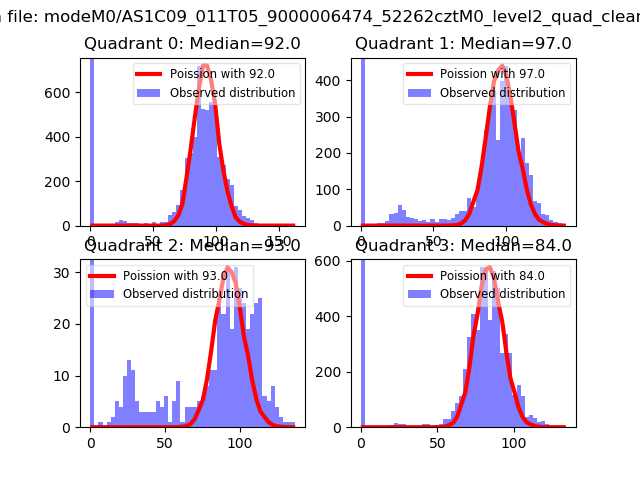 |
 |
| Quadrant-wise count rates Data is divided into 100 sec bins |
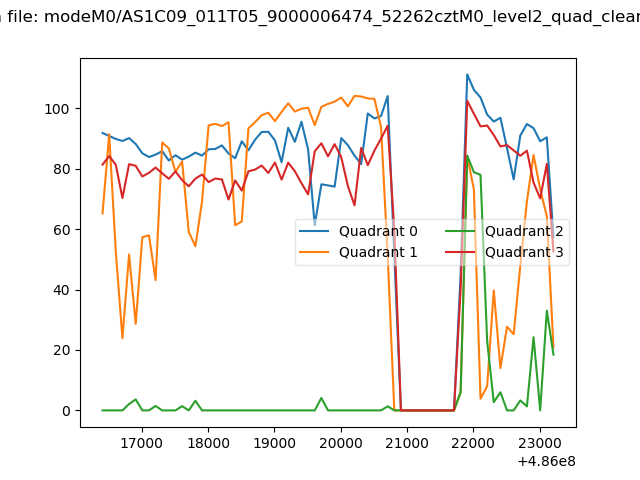 |
|
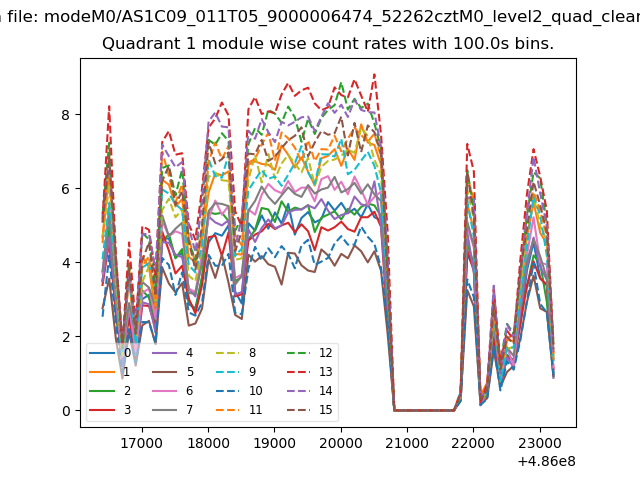
| Module-wise count rates for Quadrant A Data is divided into 100 sec bins |
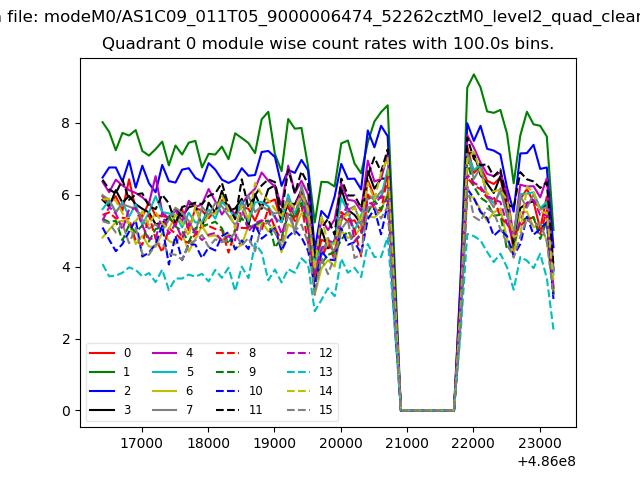 |
 |
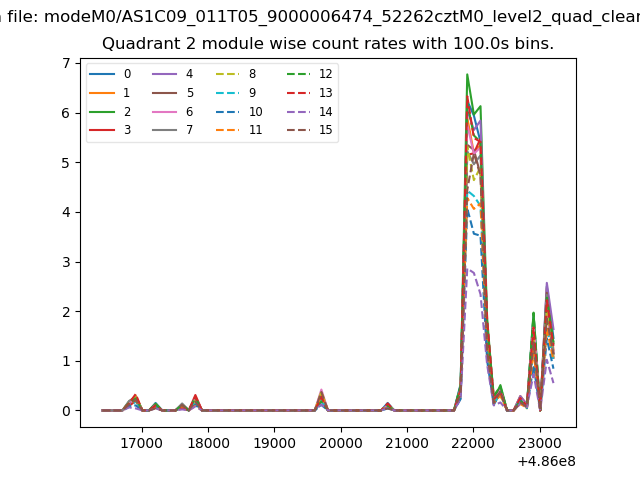
| Module-wise count rates for Quadrant B Data is divided into 100 sec bins |
 |
 |
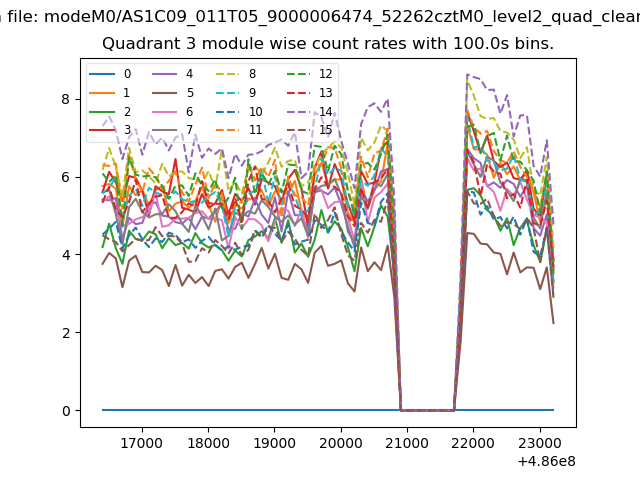
| Module-wise count rates for Quadrant C Data is divided into 100 sec bins |
 |
 |
| Module-wise count rates for Quadrant D Data is divided into 100 sec bins |
 |
 |
| Parameter | Plot |
|---|---|
| CZT HV Monitor | 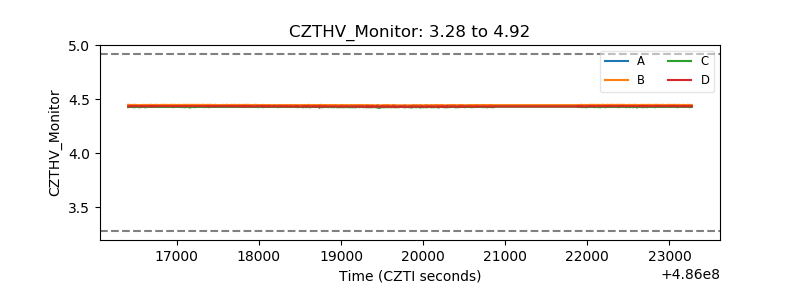 |
| D_VDD | 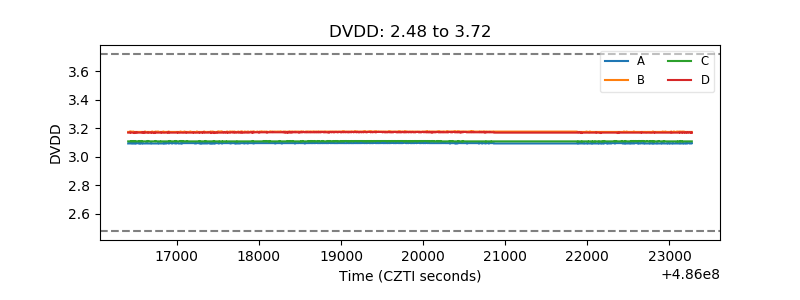 |
| Temperature 1 | 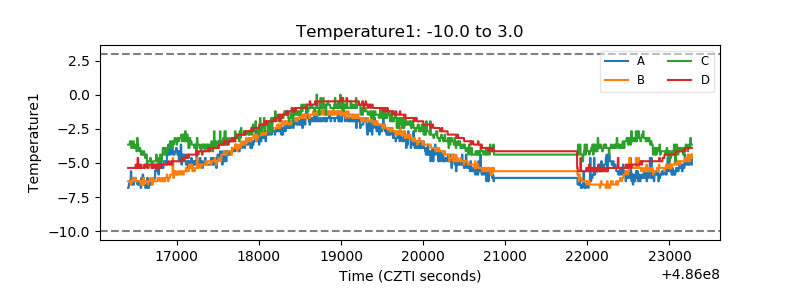 |
| Veto HV Monitor | 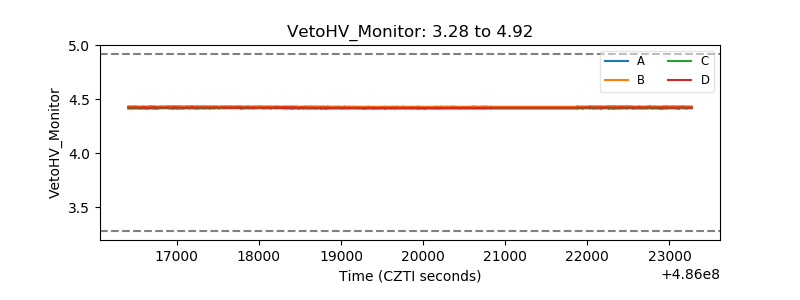 |
| Veto LLD | 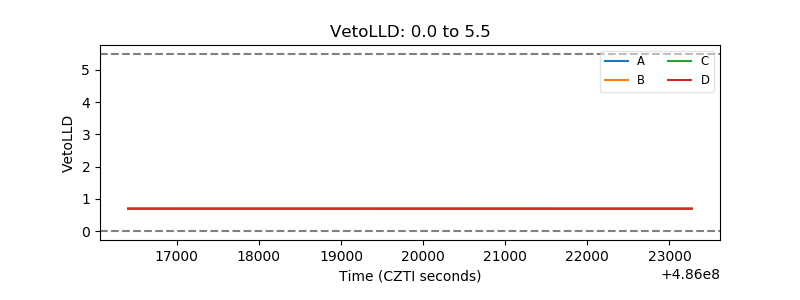 |
| Alpha Counter | 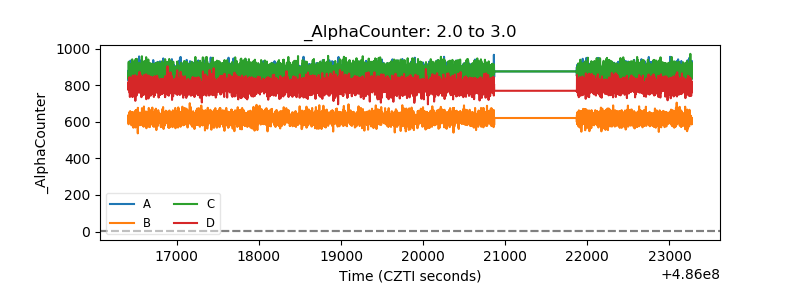 |
| _CPM_Rate | 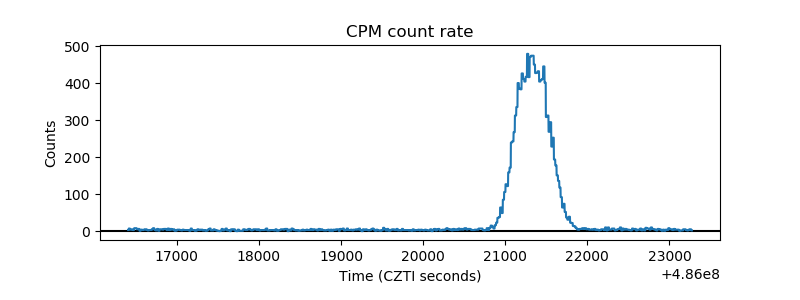 |
| CZT Counter | 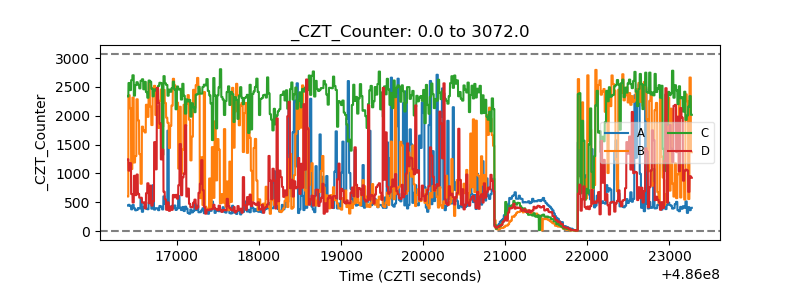 |
| +2.5 Volts monitor |  |
| +5 Volts monitor |  |
| _ROLL_ROT | 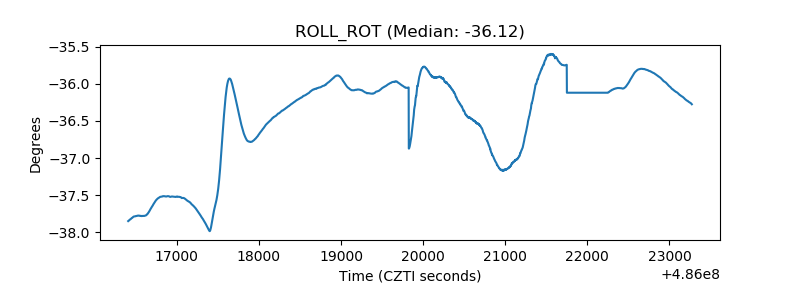 |
| _Roll_DEC | 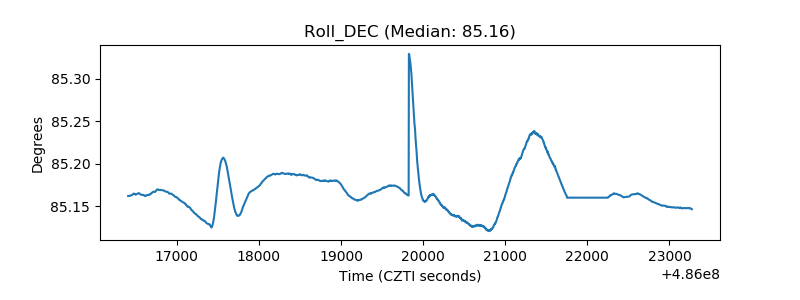 |
| _Roll_RA | 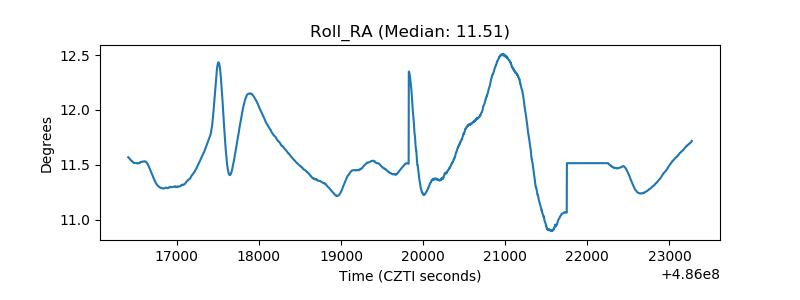 |
| Veto Counter | 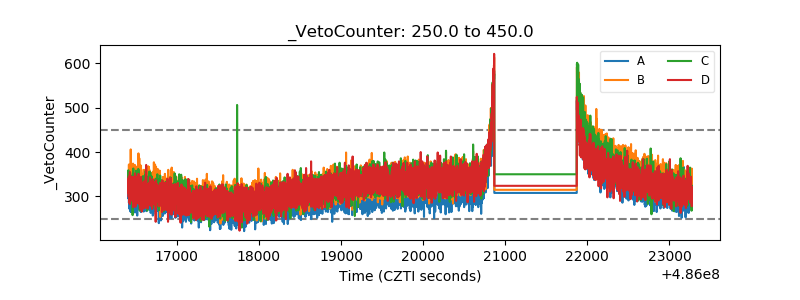 |