| Param | Original file | Final file |
|---|---|---|
| Filename | modeM0/AS1C09_011T05_9000006474_52263cztM0_level2.fits | modeM0/AS1C09_011T05_9000006474_52263cztM0_level2_quad_clean.evt |
| Size (bytes) | 822,525,120 | 67,763,520 |
| Size | 784.4 MB | 64.6 MB |
| Events in quadrant A | 3,969,340 | 571,689 |
| Events in quadrant B | 6,884,768 | 500,984 |
| Events in quadrant C | 14,174,922 | 30,564 |
| Events in quadrant D | 4,938,699 | 517,508 |
| Mode M0 | |||
|---|---|---|---|
| Quadrant | BADHDUFLAG | Total packets | Discarded packets |
| A | 0 | 16203 | 1 |
| B | 0 | 24724 | 1 |
| C | 0 | 46260 | 2 |
| D | 0 | 18956 | 1 |
| Mode SS | |||
|---|---|---|---|
| Quadrant | BADHDUFLAG | Total packets | Discarded packets |
| A | 0 | 124 | 0 |
| B | 0 | 124 | 0 |
| C | 0 | 124 | 0 |
| D | 0 | 124 | 0 |
| Mode M9 | |||
|---|---|---|---|
| Quadrant | BADHDUFLAG | Total packets | Discarded packets |
| A | 0 | 11 | 0 |
| B | 0 | 11 | 0 |
| C | 0 | 11 | 0 |
| D | 0 | 11 | 0 |
| Quadrant | Total seconds | Saturated seconds | Saturation percentage |
|---|---|---|---|
| A | 6177 | 299 | 4.840537% |
| B | 6177 | 1485 | 24.040797% |
| C | 6176 | 5946 | 96.275907% |
| D | 6177 | 270 | 4.371054% |
Noise dominated data is calculated using 1-second bins in cleaned event files. If a bin has >2000 counts, and if more than 50% of those come from <1% of pixels, then it is considered to be noise-dominated and hence unusable.
| Quadrant | # 1 sec bins | Bins with >0 counts | Bins with >2000 counts | High rate bins dominated by noise | Noise dominated (total time) | Noise dominated (detector-on time) | Marked lightcurve |
|---|---|---|---|---|---|---|---|
| A | 7242 | 6178 | 177 | 177 | 2.44% | 2.87% | 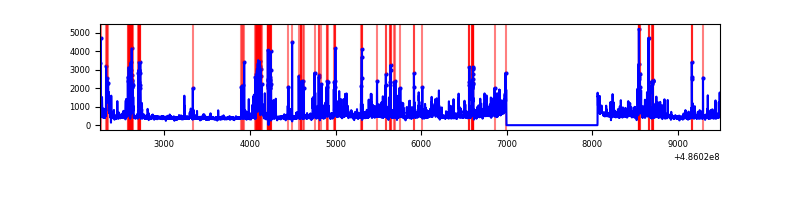 |
| B | 7242 | 6178 | 1003 | 1003 | 13.85% | 16.24% | 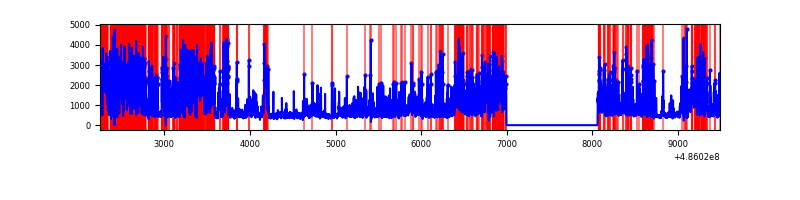 |
| C | 7241 | 6174 | 4706 | 4706 | 64.99% | 76.22% | 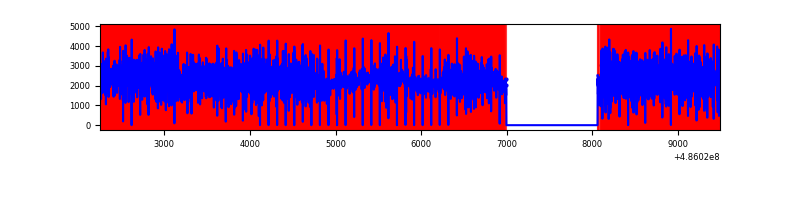 |
| D | 7242 | 6178 | 284 | 284 | 3.92% | 4.60% | 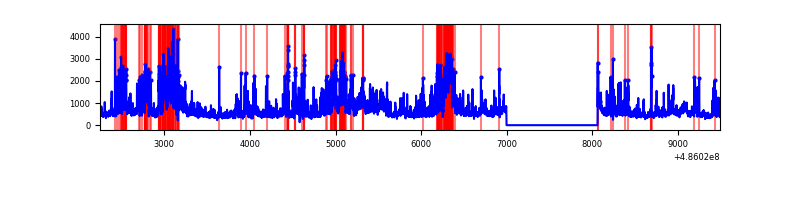 |
Top three noisy pixels from each quadrant. If the there are fewer than three noisy pixels in the level2.evt file, extra rows are filled as -1
| Pixel properties | Quadrant properties | ||||||
|---|---|---|---|---|---|---|---|
| Quadrant | DetID | PixID | Counts | Sigma | Mean | Median | Sigma |
| A | 4 | 249 | 237822 | 1507.2 | 635 | 620 | 157.4 |
| A | 15 | 174 | 211440 | 1339.56 | 635 | 620 | 157.4 |
| A | 6 | 145 | 184558 | 1168.75 | 635 | 620 | 157.4 |
| B | 12 | 32 | 2967717 | 24339.59 | 566 | 547 | 121.9 |
| B | 10 | 44 | 372786 | 3053.46 | 566 | 547 | 121.9 |
| B | 4 | 171 | 310618 | 2543.5 | 566 | 547 | 121.9 |
| C | 15 | 158 | 10535528 | 150067.35 | 246 | 243 | 70.2 |
| C | 15 | 224 | 1631327 | 23233.59 | 246 | 243 | 70.2 |
| C | 15 | 178 | 486773 | 6930.26 | 246 | 243 | 70.2 |
| D | 6 | 42 | 1316168 | 7527.41 | 614 | 588 | 174.8 |
| D | 8 | 176 | 366251 | 2092.23 | 614 | 588 | 174.8 |
| D | 7 | 96 | 328585 | 1876.71 | 614 | 588 | 174.8 |
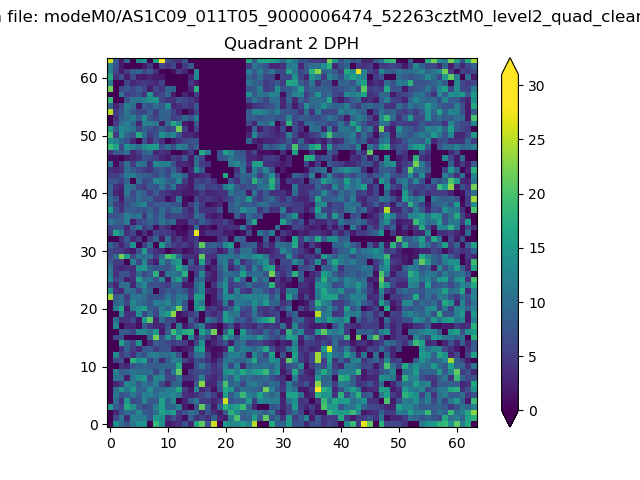
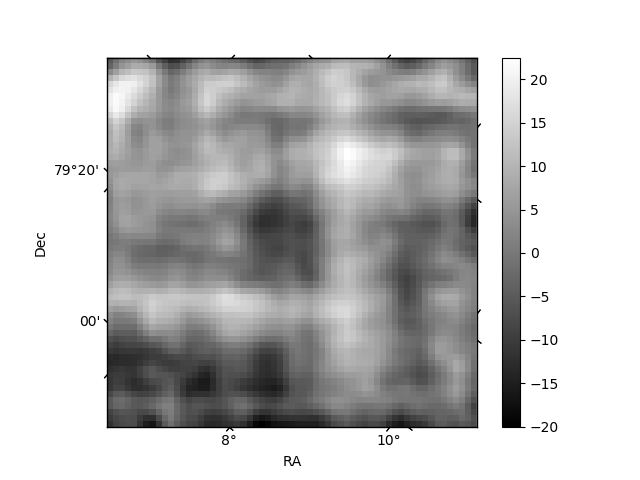
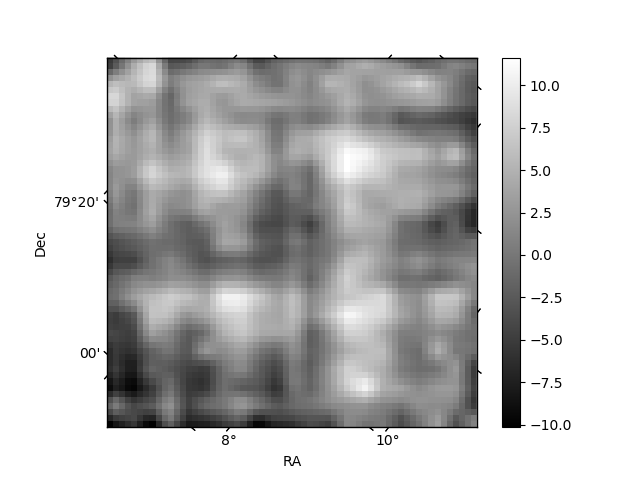
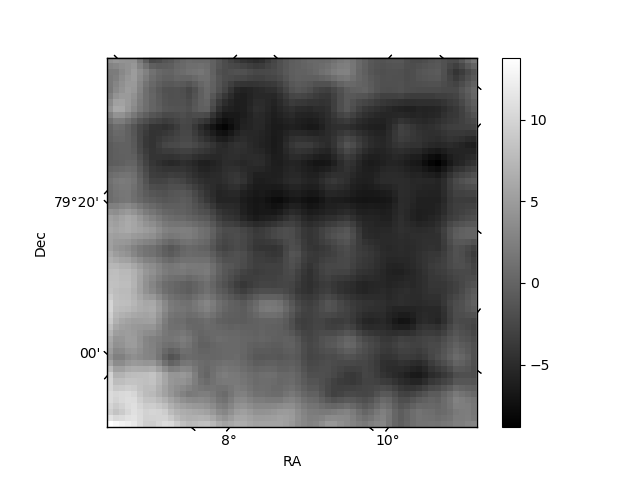
Histogram calculated using DETX and DETY for each event in the final _common_clean file
| Quadrant A | 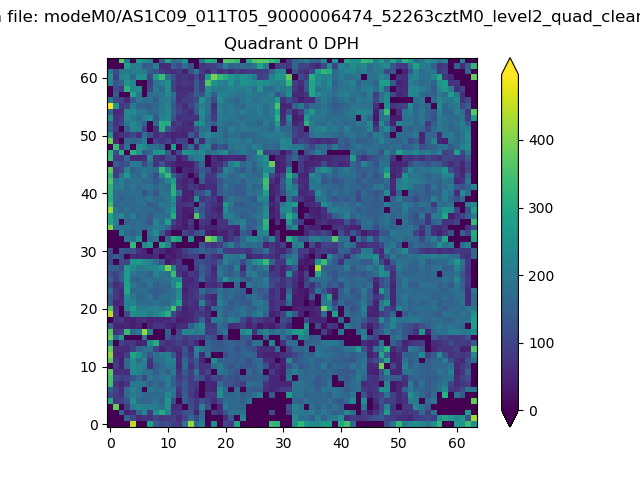 |
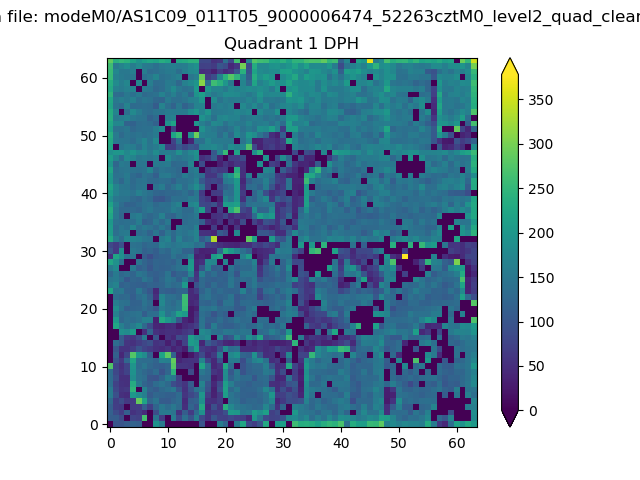 |
Quadrant B |
|---|---|---|---|
| Quadrant D | 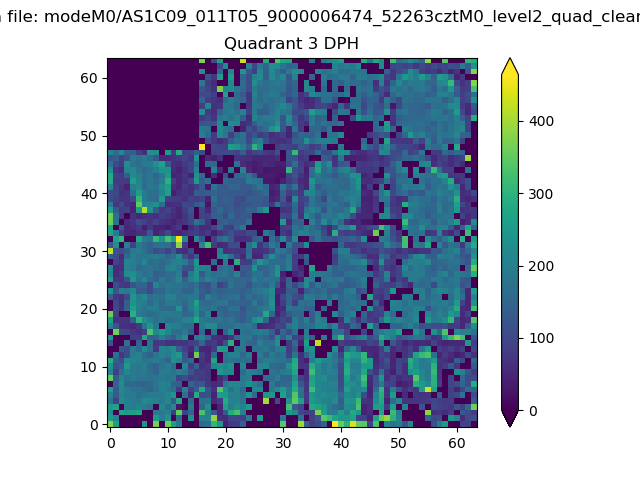 |
 |
Quadrant C |
| Plot type | Count rate plots | Images |
|---|---|---|
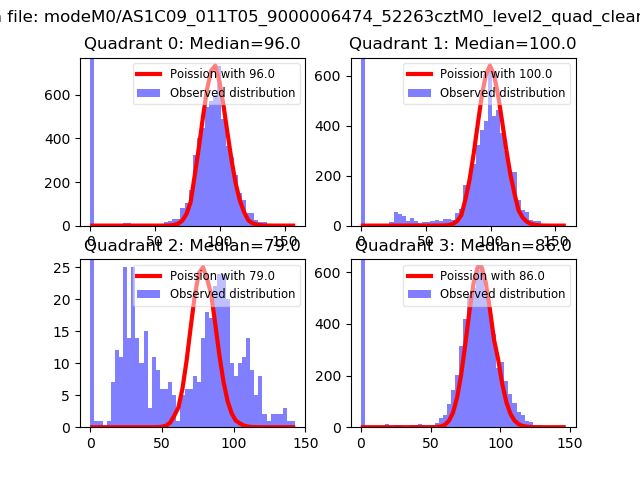
| Comparison with Poisson distribution Blue bars denote a histogram of data divided into 1 sec bins. Red curve is a Poisson curve with rate = median count rate of data. |
 |
 |
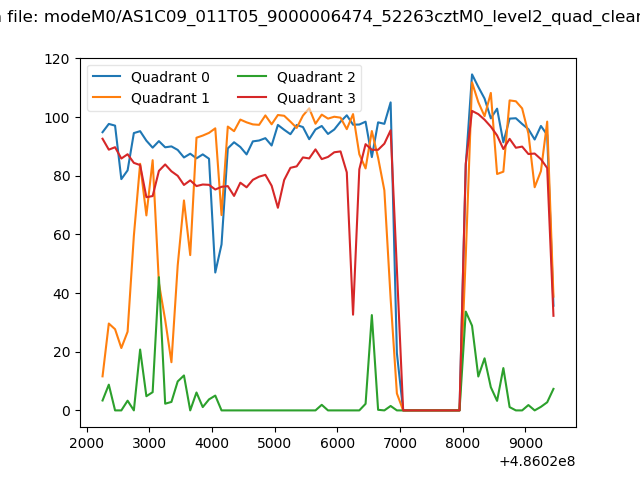
| Quadrant-wise count rates Data is divided into 100 sec bins |
 |
|
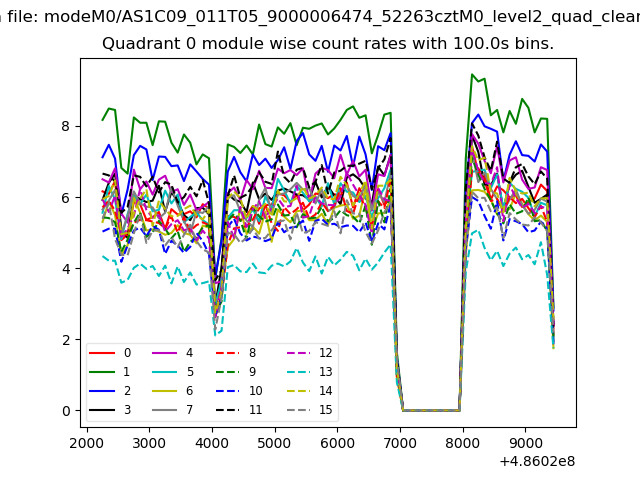
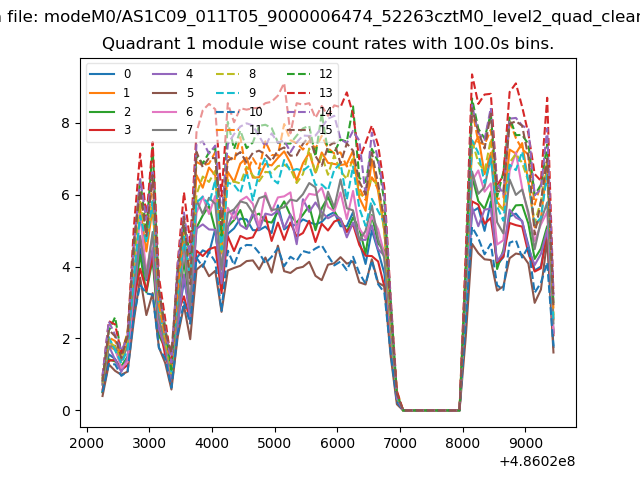
| Module-wise count rates for Quadrant A Data is divided into 100 sec bins |
 |
 |
| Module-wise count rates for Quadrant B Data is divided into 100 sec bins |
 |
 |
| Module-wise count rates for Quadrant C Data is divided into 100 sec bins |
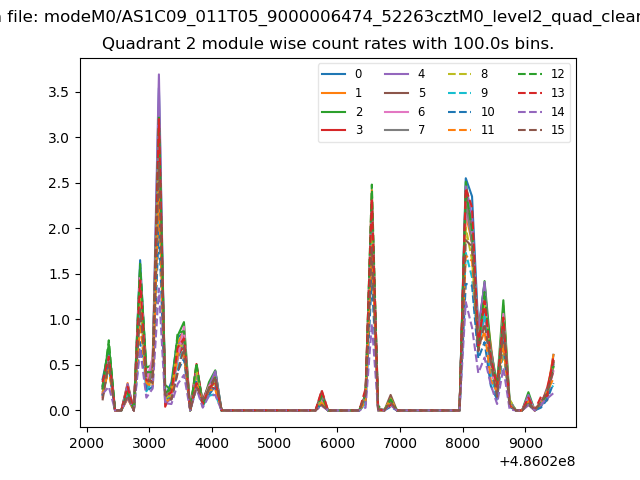 |
 |
| Module-wise count rates for Quadrant D Data is divided into 100 sec bins |
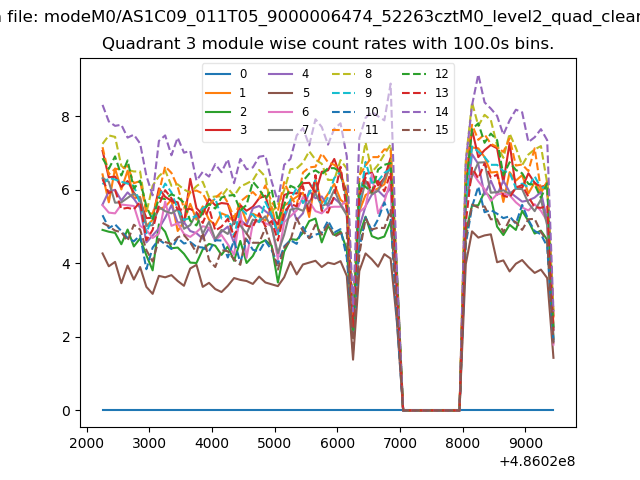 |
 |
| Parameter | Plot |
|---|---|
| CZT HV Monitor | 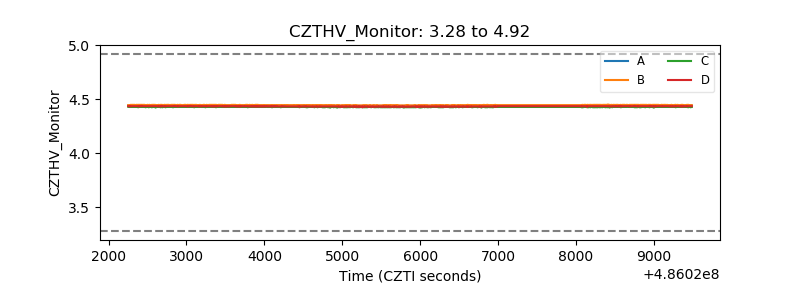 |
| D_VDD | 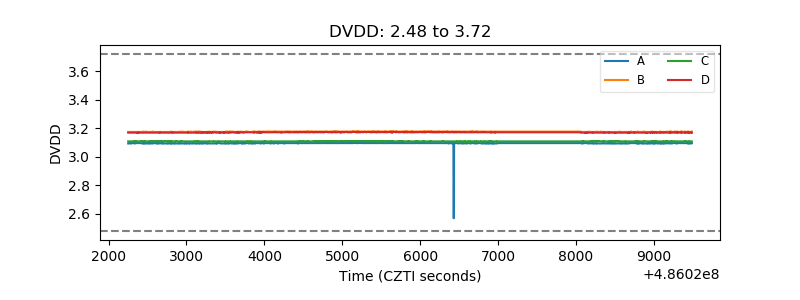 |
| Temperature 1 | 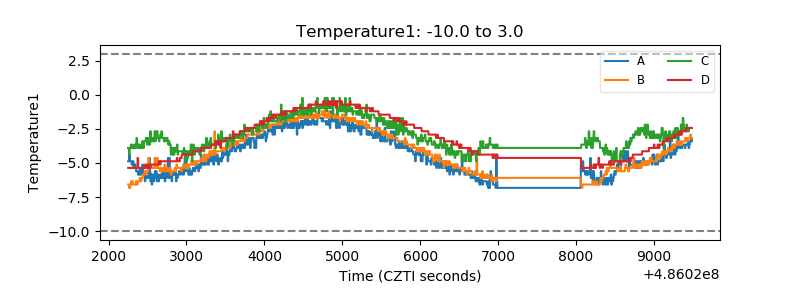 |
| Veto HV Monitor | 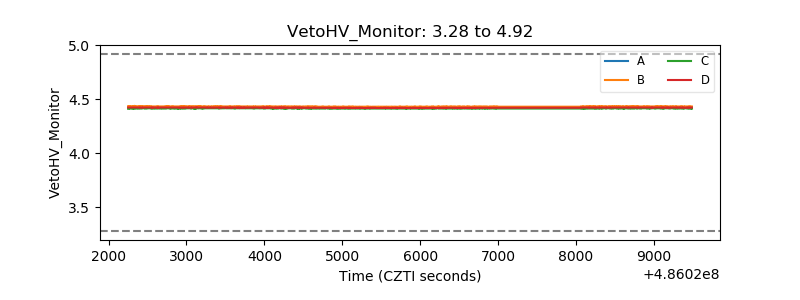 |
| Veto LLD | 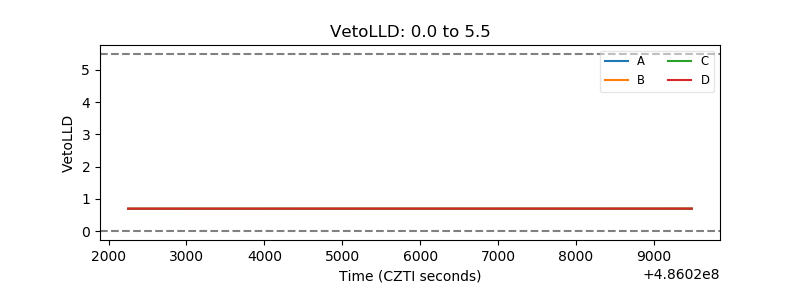 |
| Alpha Counter | 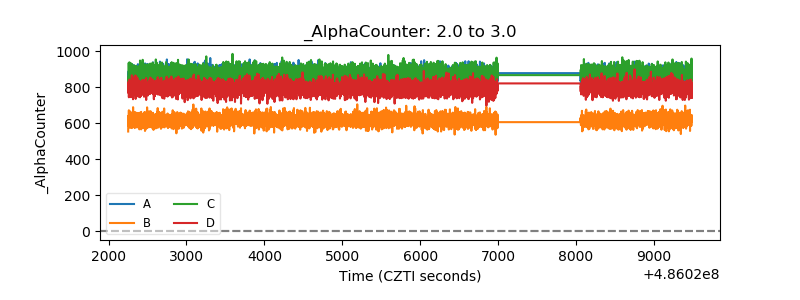 |
| _CPM_Rate | 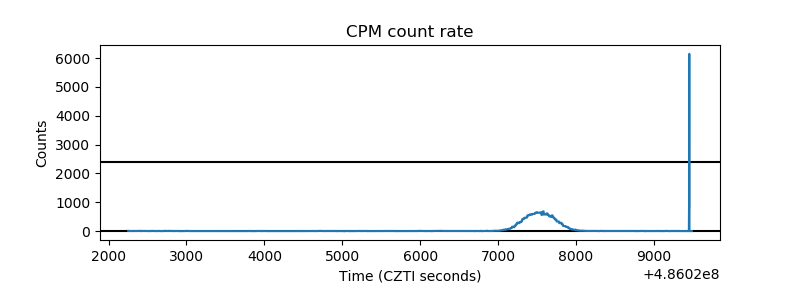 |
| CZT Counter | 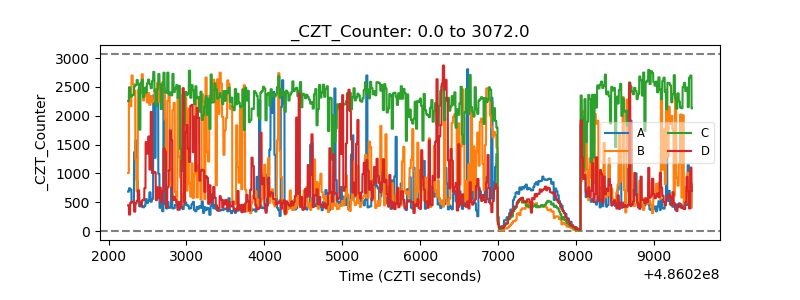 |
| +2.5 Volts monitor | 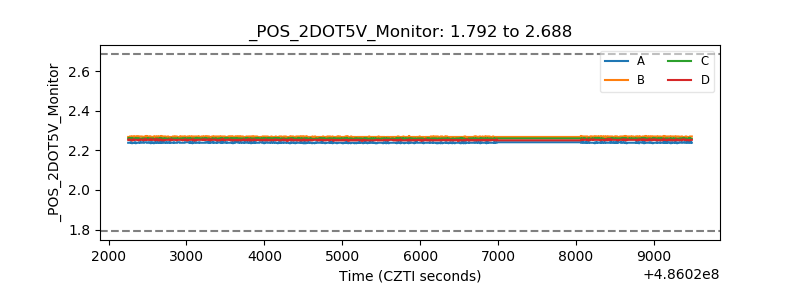 |
| +5 Volts monitor | 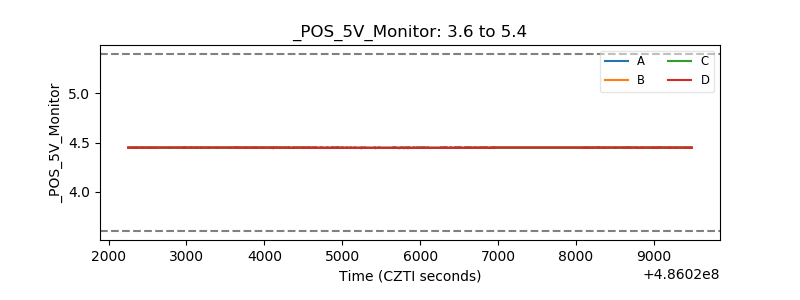 |
| _ROLL_ROT | 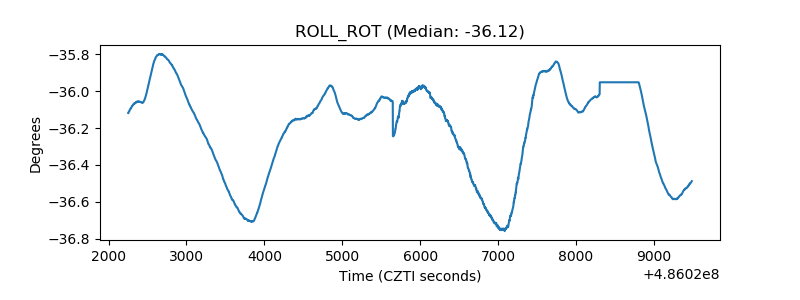 |
| _Roll_DEC | 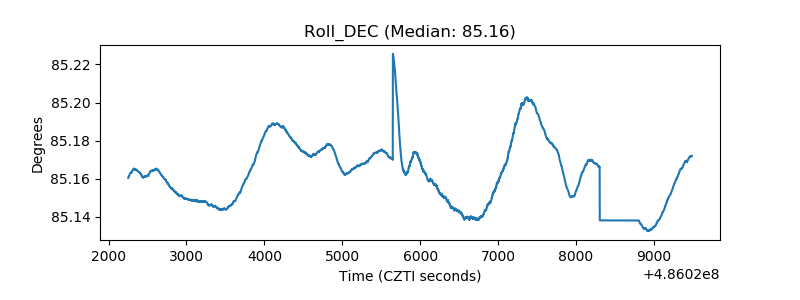 |
| _Roll_RA | 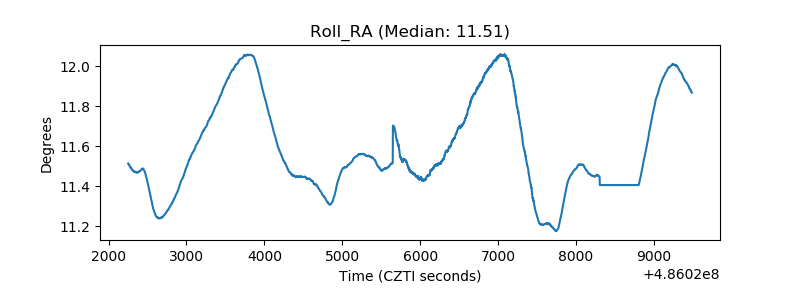 |
| Veto Counter | 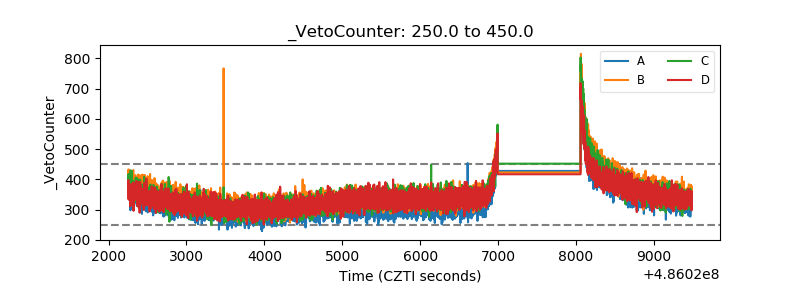 |