| Param | Original file | Final file |
|---|---|---|
| Filename | modeM0/AS1C09_011T05_9000006474_52264cztM0_level2.fits | modeM0/AS1C09_011T05_9000006474_52264cztM0_level2_quad_clean.evt |
| Size (bytes) | 726,667,200 | 66,703,680 |
| Size | 693.0 MB | 63.6 MB |
| Events in quadrant A | 3,369,614 | 554,563 |
| Events in quadrant B | 6,142,140 | 488,976 |
| Events in quadrant C | 12,769,399 | 85,829 |
| Events in quadrant D | 4,169,496 | 486,939 |
| Mode M0 | |||
|---|---|---|---|
| Quadrant | BADHDUFLAG | Total packets | Discarded packets |
| A | 0 | 13913 | 1 |
| B | 0 | 22224 | 1 |
| C | 0 | 41839 | 1 |
| D | 0 | 16384 | 1 |
| Mode SS | |||
|---|---|---|---|
| Quadrant | BADHDUFLAG | Total packets | Discarded packets |
| A | 0 | 118 | 0 |
| B | 0 | 118 | 0 |
| C | 0 | 118 | 0 |
| D | 0 | 118 | 0 |
| Mode M9 | |||
|---|---|---|---|
| Quadrant | BADHDUFLAG | Total packets | Discarded packets |
| A | 0 | 11 | 0 |
| B | 0 | 11 | 0 |
| C | 0 | 11 | 0 |
| D | 0 | 11 | 0 |
| Quadrant | Total seconds | Saturated seconds | Saturation percentage |
|---|---|---|---|
| A | 5764 | 153 | 2.654407% |
| B | 5765 | 1309 | 22.705984% |
| C | 5765 | 5045 | 87.510841% |
| D | 5765 | 280 | 4.856895% |
Noise dominated data is calculated using 1-second bins in cleaned event files. If a bin has >2000 counts, and if more than 50% of those come from <1% of pixels, then it is considered to be noise-dominated and hence unusable.
| Quadrant | # 1 sec bins | Bins with >0 counts | Bins with >2000 counts | High rate bins dominated by noise | Noise dominated (total time) | Noise dominated (detector-on time) | Marked lightcurve |
|---|---|---|---|---|---|---|---|
| A | 6884 | 5765 | 73 | 73 | 1.06% | 1.27% | 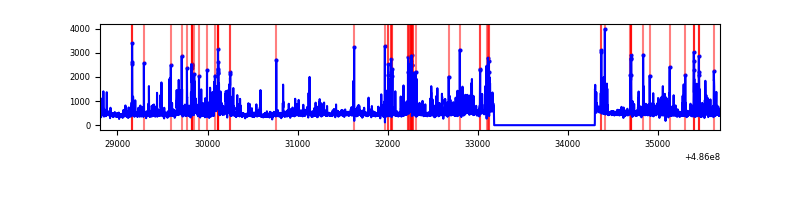 |
| B | 6885 | 5766 | 777 | 777 | 11.29% | 13.48% | 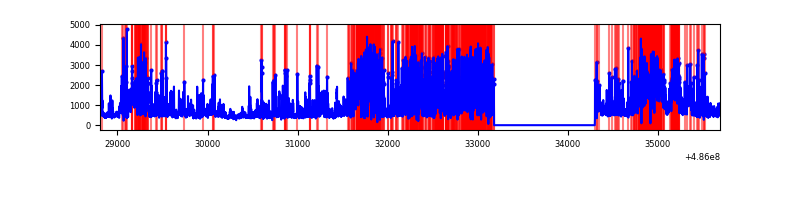 |
| C | 6884 | 5764 | 4188 | 4188 | 60.84% | 72.66% | 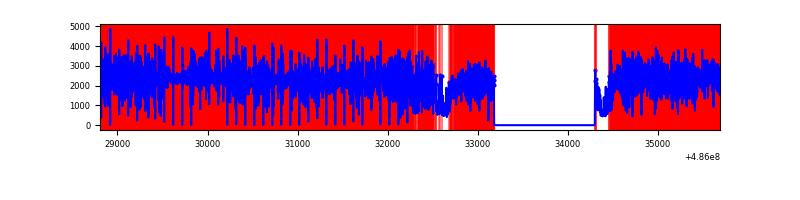 |
| D | 6885 | 5766 | 214 | 214 | 3.11% | 3.71% | 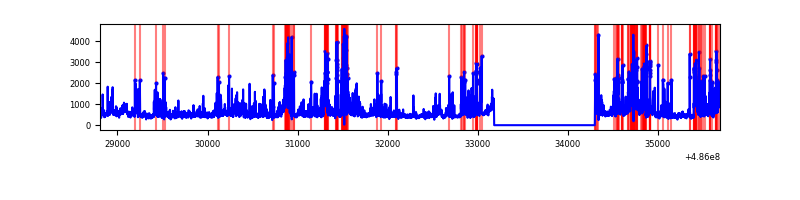 |
Top three noisy pixels from each quadrant. If the there are fewer than three noisy pixels in the level2.evt file, extra rows are filled as -1
| Pixel properties | Quadrant properties | ||||||
|---|---|---|---|---|---|---|---|
| Quadrant | DetID | PixID | Counts | Sigma | Mean | Median | Sigma |
| A | 15 | 250 | 174595 | 1146.88 | 607 | 592 | 151.7 |
| A | 11 | 3 | 151884 | 997.19 | 607 | 592 | 151.7 |
| A | 4 | 249 | 122315 | 802.3 | 607 | 592 | 151.7 |
| B | 12 | 32 | 2262592 | 19749.31 | 540 | 522 | 114.5 |
| B | 10 | 254 | 563851 | 4918.22 | 540 | 522 | 114.5 |
| B | 1 | 255 | 211400 | 1841.1 | 540 | 522 | 114.5 |
| C | 15 | 158 | 9079178 | 117848.11 | 277 | 274 | 77.0 |
| C | 15 | 224 | 1165480 | 15124.88 | 277 | 274 | 77.0 |
| C | 15 | 178 | 503266 | 6529.05 | 277 | 274 | 77.0 |
| D | 8 | 176 | 621034 | 3779.18 | 578 | 552 | 164.2 |
| D | 11 | 176 | 414979 | 2524.16 | 578 | 552 | 164.2 |
| D | 3 | 12 | 256312 | 1557.76 | 578 | 552 | 164.2 |
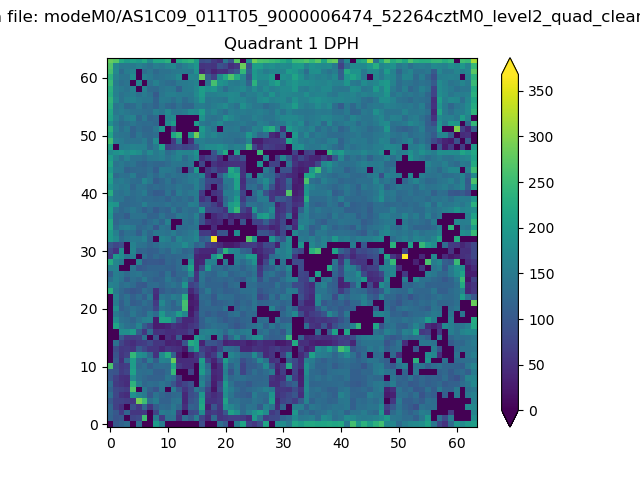
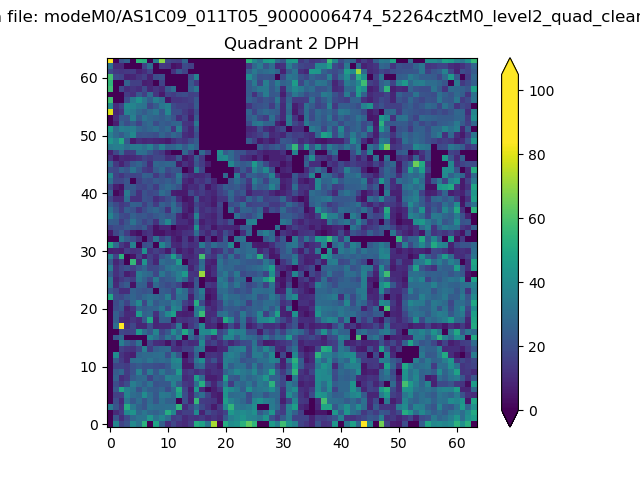
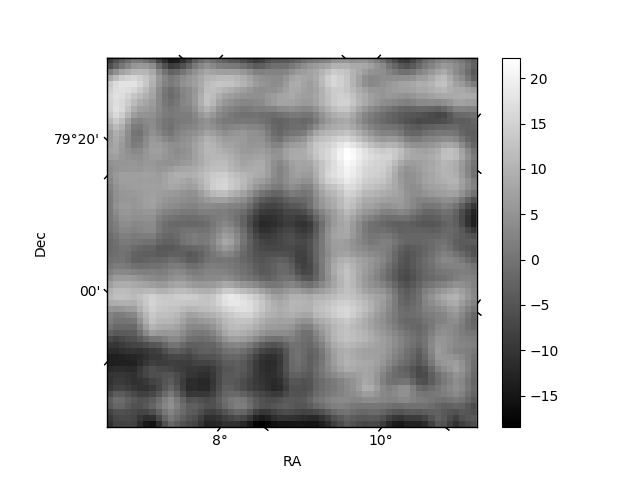
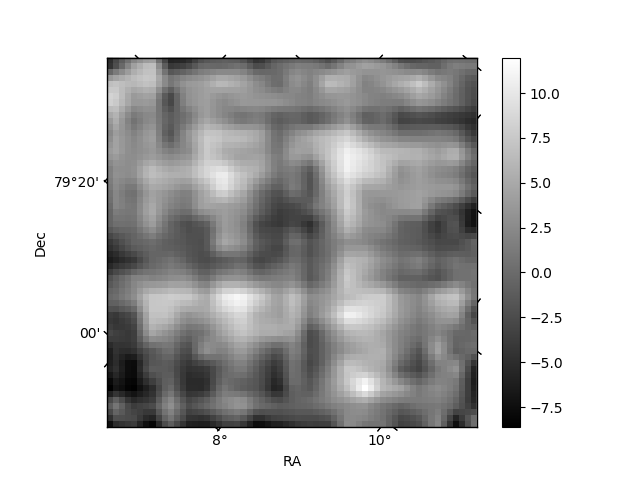
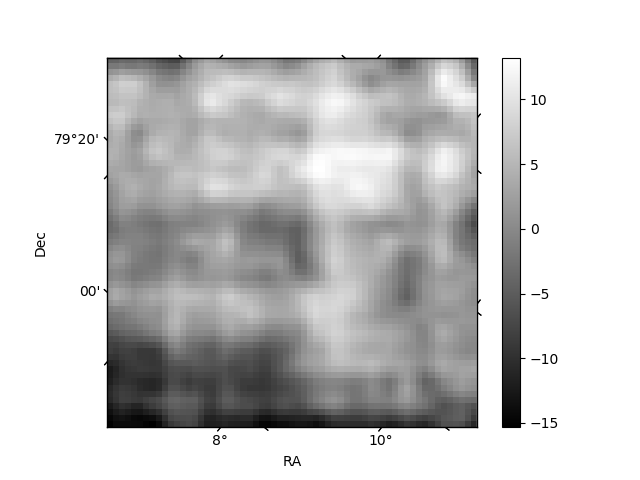
Histogram calculated using DETX and DETY for each event in the final _common_clean file
| Quadrant A |  |
 |
Quadrant B |
|---|---|---|---|
| Quadrant D | 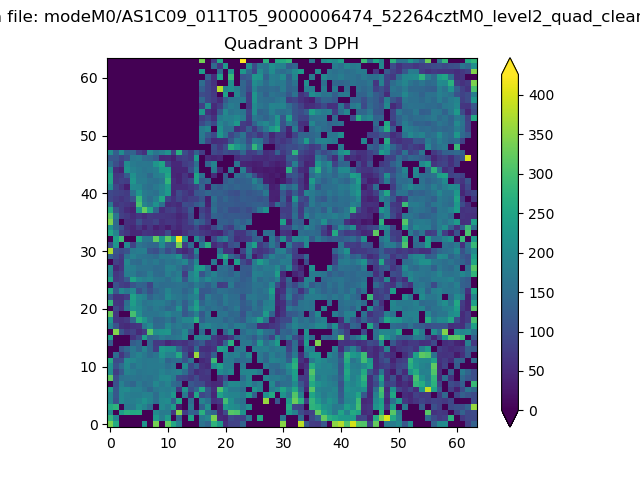 |
 |
Quadrant C |
| Plot type | Count rate plots | Images |
|---|---|---|
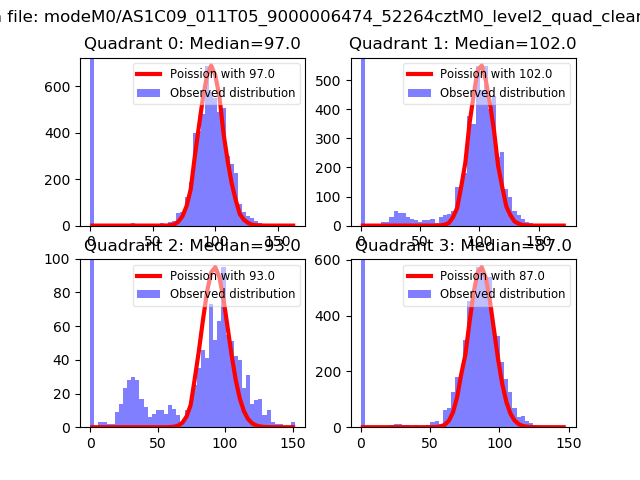
| Comparison with Poisson distribution Blue bars denote a histogram of data divided into 1 sec bins. Red curve is a Poisson curve with rate = median count rate of data. |
 |
 |
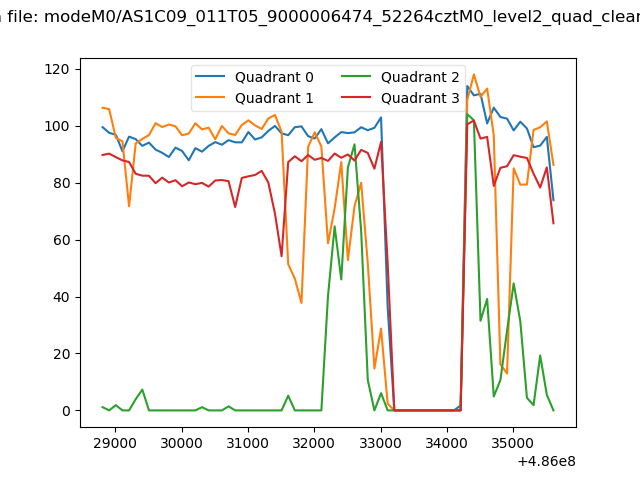
| Quadrant-wise count rates Data is divided into 100 sec bins |
 |
|
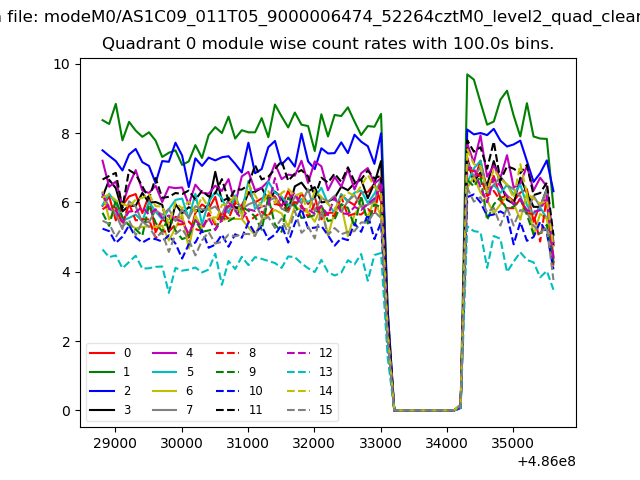
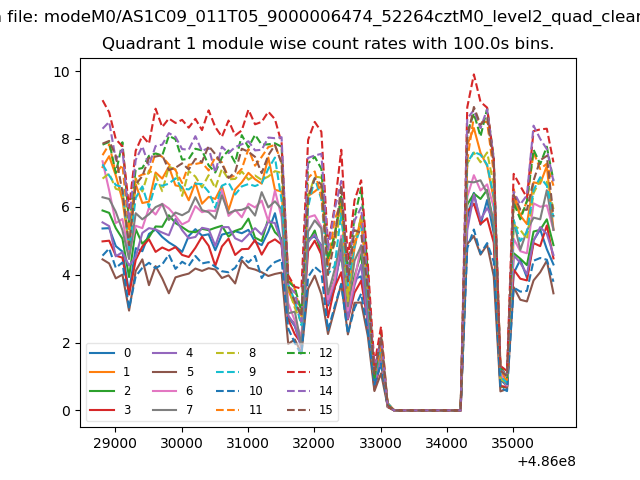
| Module-wise count rates for Quadrant A Data is divided into 100 sec bins |
 |
 |
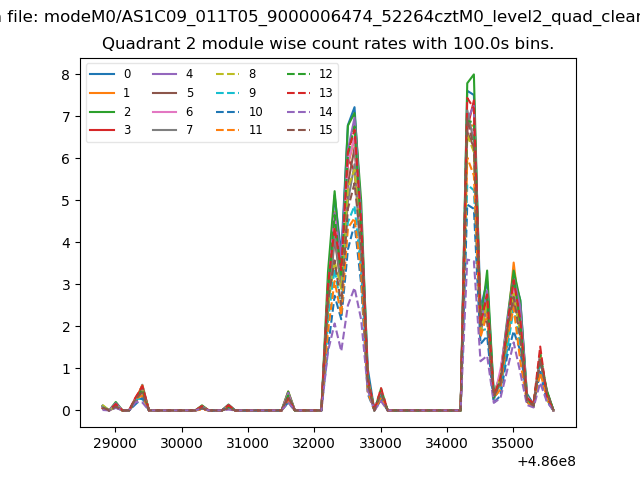
| Module-wise count rates for Quadrant B Data is divided into 100 sec bins |
 |
 |
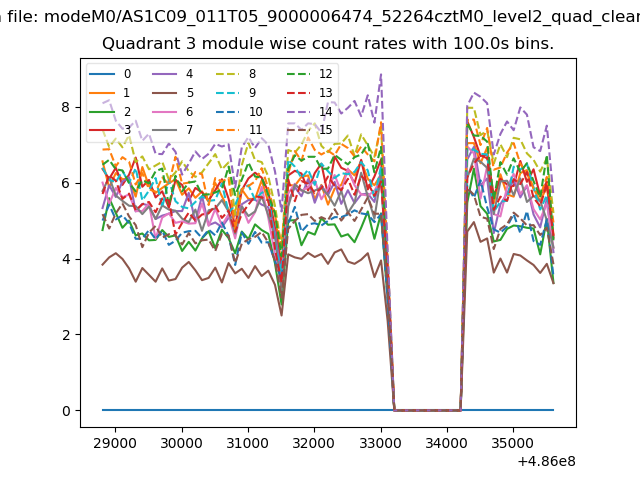
| Module-wise count rates for Quadrant C Data is divided into 100 sec bins |
 |
 |
| Module-wise count rates for Quadrant D Data is divided into 100 sec bins |
 |
 |
| Parameter | Plot |
|---|---|
| CZT HV Monitor | 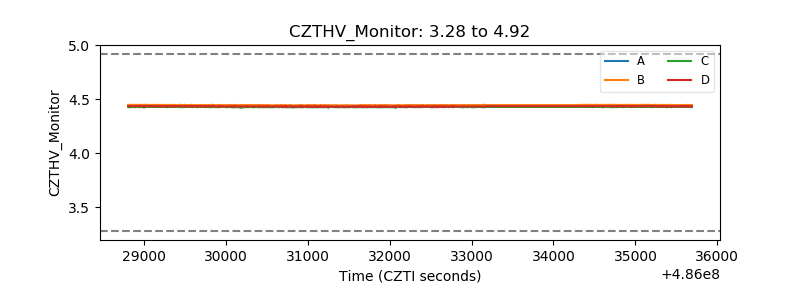 |
| D_VDD | 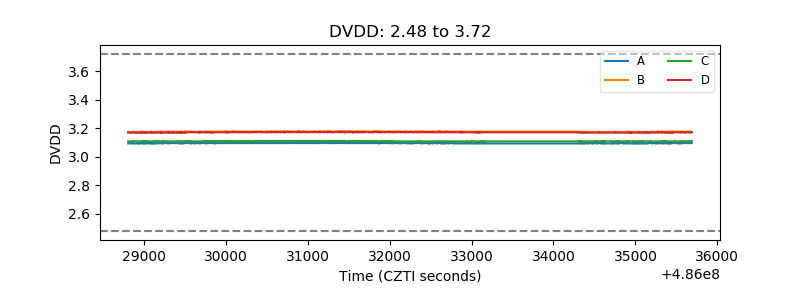 |
| Temperature 1 | 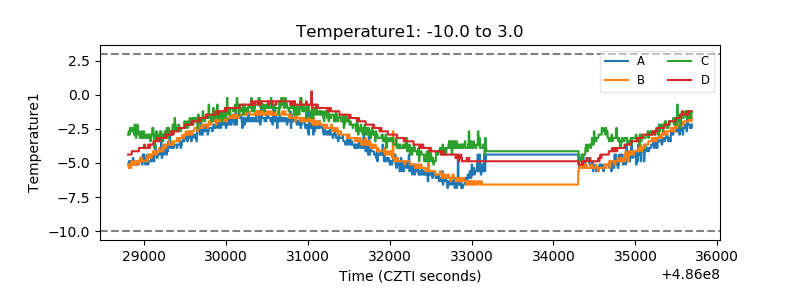 |
| Veto HV Monitor | 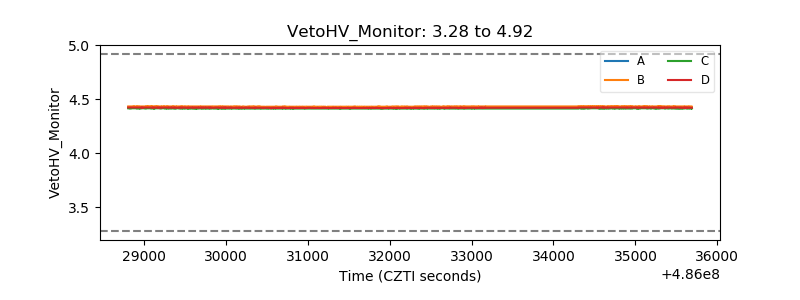 |
| Veto LLD | 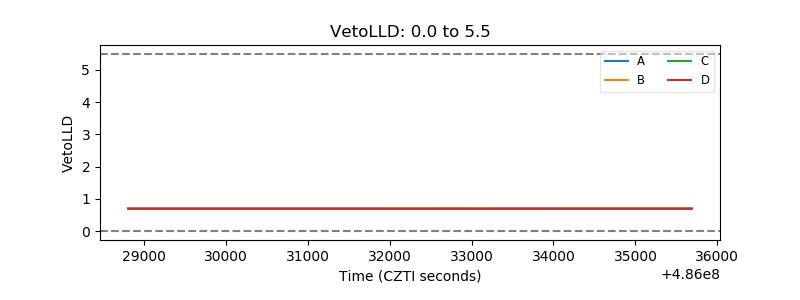 |
| Alpha Counter |  |
| _CPM_Rate | 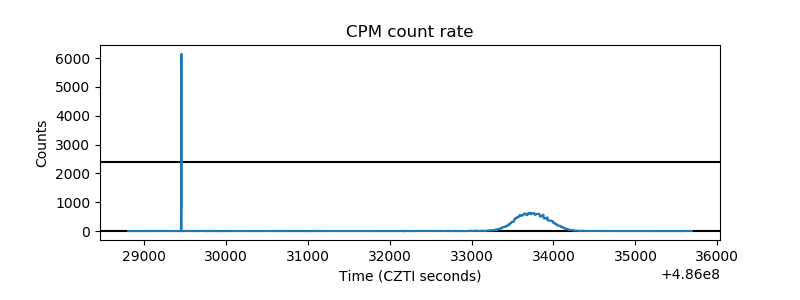 |
| CZT Counter | 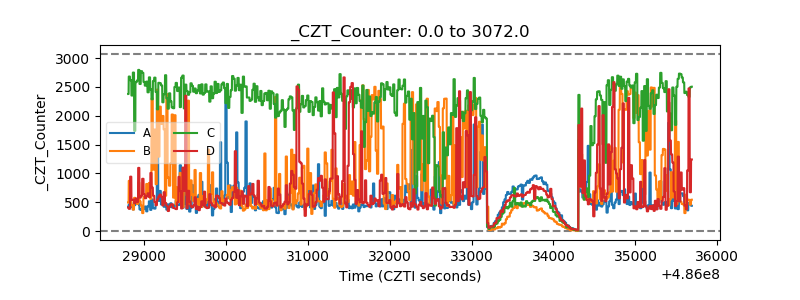 |
| +2.5 Volts monitor |  |
| +5 Volts monitor |  |
| _ROLL_ROT | 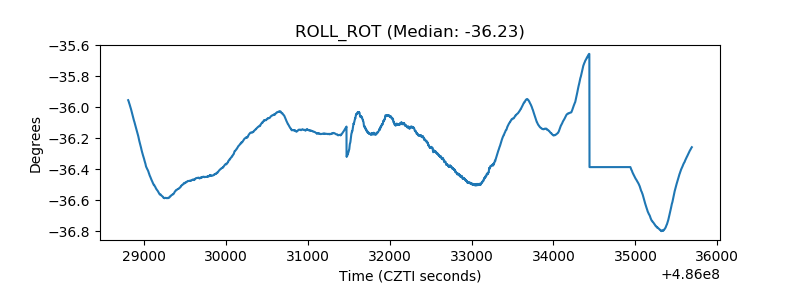 |
| _Roll_DEC | 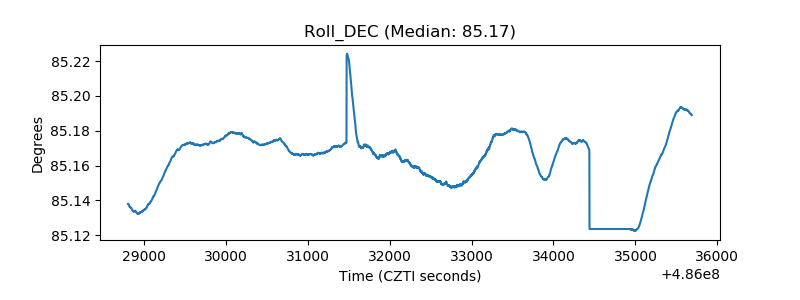 |
| _Roll_RA | 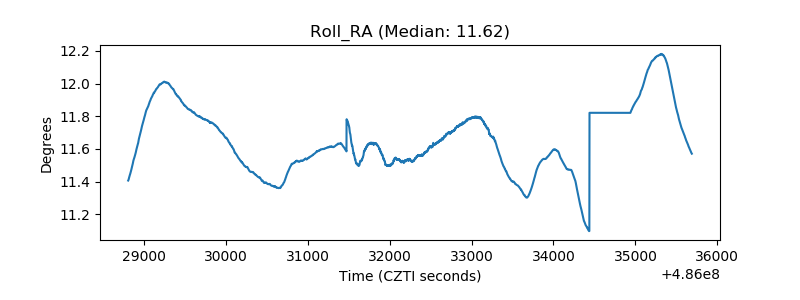 |
| Veto Counter | 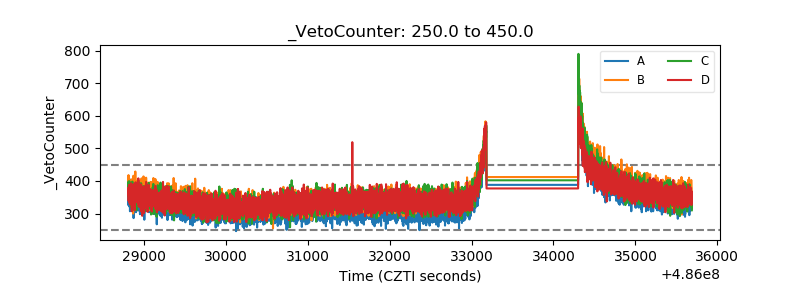 |