| Param | Original file | Final file |
|---|---|---|
| Filename | modeM0/AS1C09_011T05_9000006474_52265cztM0_level2.fits | modeM0/AS1C09_011T05_9000006474_52265cztM0_level2_quad_clean.evt |
| Size (bytes) | 699,122,880 | 71,562,240 |
| Size | 666.7 MB | 68.2 MB |
| Events in quadrant A | 3,695,090 | 551,330 |
| Events in quadrant B | 6,405,941 | 506,871 |
| Events in quadrant C | 11,344,571 | 198,420 |
| Events in quadrant D | 3,977,216 | 499,151 |
| Mode M0 | |||
|---|---|---|---|
| Quadrant | BADHDUFLAG | Total packets | Discarded packets |
| A | 0 | 15057 | 1 |
| B | 0 | 23102 | 1 |
| C | 0 | 37682 | 1 |
| D | 0 | 15856 | 1 |
| Mode SS | |||
|---|---|---|---|
| Quadrant | BADHDUFLAG | Total packets | Discarded packets |
| A | 0 | 120 | 0 |
| B | 0 | 120 | 0 |
| C | 0 | 120 | 0 |
| D | 0 | 120 | 0 |
| Mode M9 | |||
|---|---|---|---|
| Quadrant | BADHDUFLAG | Total packets | Discarded packets |
| A | 0 | 11 | 0 |
| B | 0 | 11 | 0 |
| C | 0 | 11 | 0 |
| D | 0 | 11 | 0 |
| Quadrant | Total seconds | Saturated seconds | Saturation percentage |
|---|---|---|---|
| A | 5877 | 327 | 5.564063% |
| B | 5877 | 1180 | 20.078271% |
| C | 5877 | 4033 | 68.623447% |
| D | 5878 | 257 | 4.372235% |
Noise dominated data is calculated using 1-second bins in cleaned event files. If a bin has >2000 counts, and if more than 50% of those come from <1% of pixels, then it is considered to be noise-dominated and hence unusable.
| Quadrant | # 1 sec bins | Bins with >0 counts | Bins with >2000 counts | High rate bins dominated by noise | Noise dominated (total time) | Noise dominated (detector-on time) | Marked lightcurve |
|---|---|---|---|---|---|---|---|
| A | 7007 | 5878 | 231 | 231 | 3.30% | 3.93% | 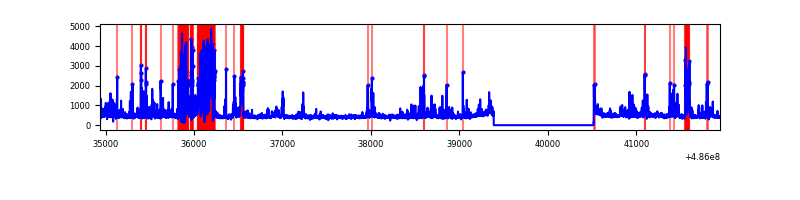 |
| B | 7007 | 5878 | 762 | 762 | 10.87% | 12.96% | 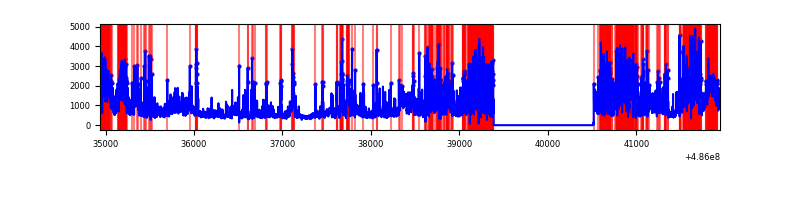 |
| C | 7006 | 5877 | 3220 | 3220 | 45.96% | 54.79% | 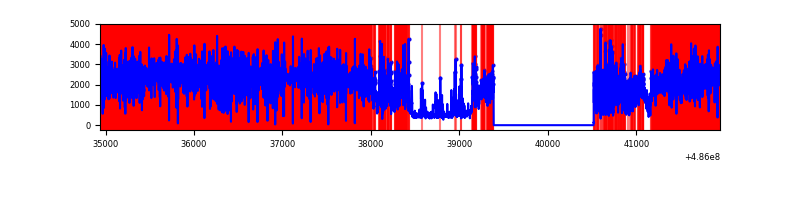 |
| D | 7008 | 5879 | 170 | 170 | 2.43% | 2.89% | 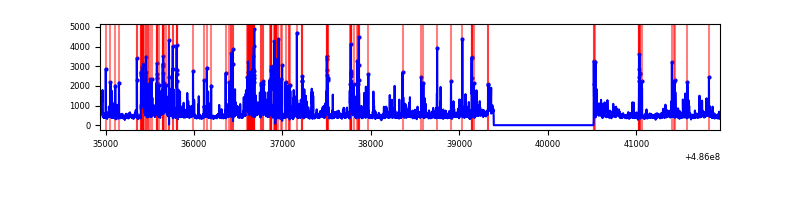 |
Top three noisy pixels from each quadrant. If the there are fewer than three noisy pixels in the level2.evt file, extra rows are filled as -1
| Pixel properties | Quadrant properties | ||||||
|---|---|---|---|---|---|---|---|
| Quadrant | DetID | PixID | Counts | Sigma | Mean | Median | Sigma |
| A | 4 | 249 | 496538 | 3269.62 | 606 | 593 | 151.7 |
| A | 13 | 248 | 146226 | 960.12 | 606 | 593 | 151.7 |
| A | 11 | 3 | 110695 | 725.87 | 606 | 593 | 151.7 |
| B | 12 | 32 | 1586119 | 13379.02 | 552 | 534 | 118.5 |
| B | 10 | 254 | 956389 | 8065.42 | 552 | 534 | 118.5 |
| B | 0 | 216 | 362781 | 3056.61 | 552 | 534 | 118.5 |
| C | 15 | 158 | 7757952 | 75123.51 | 373 | 369 | 103.3 |
| C | 15 | 224 | 1040186 | 10069.46 | 373 | 369 | 103.3 |
| C | 4 | 5 | 232181 | 2244.84 | 373 | 369 | 103.3 |
| D | 8 | 176 | 822243 | 4835.73 | 593 | 565 | 169.9 |
| D | 11 | 176 | 160472 | 941.08 | 593 | 565 | 169.9 |
| D | 7 | 96 | 116639 | 683.11 | 593 | 565 | 169.9 |
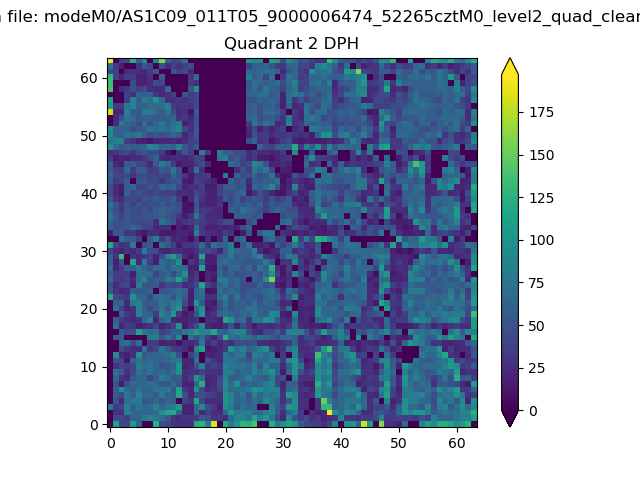
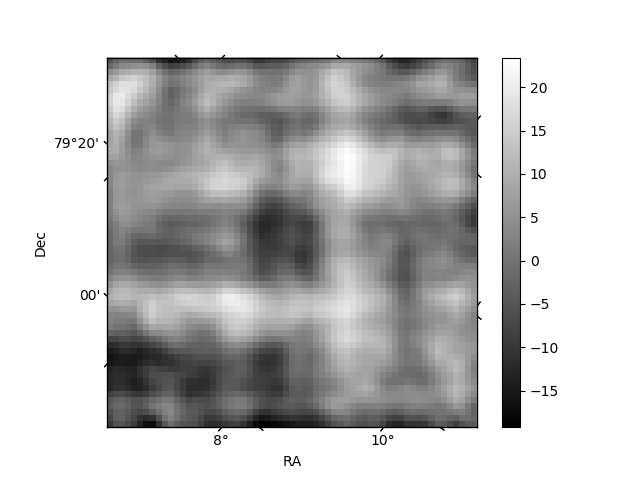
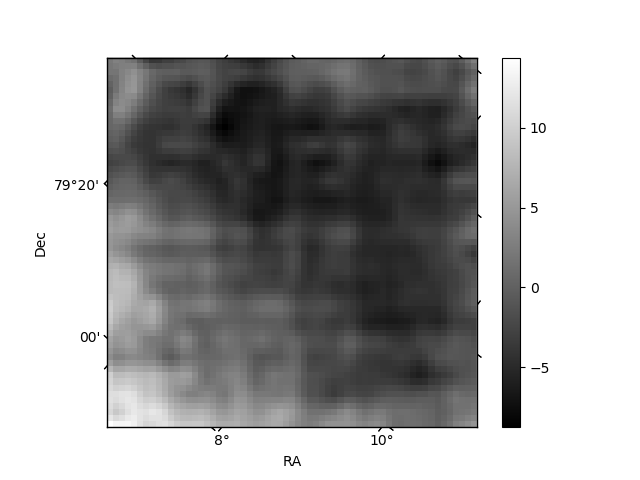
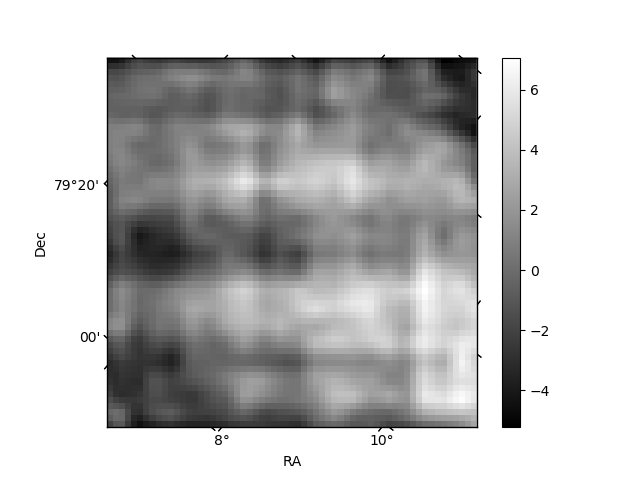
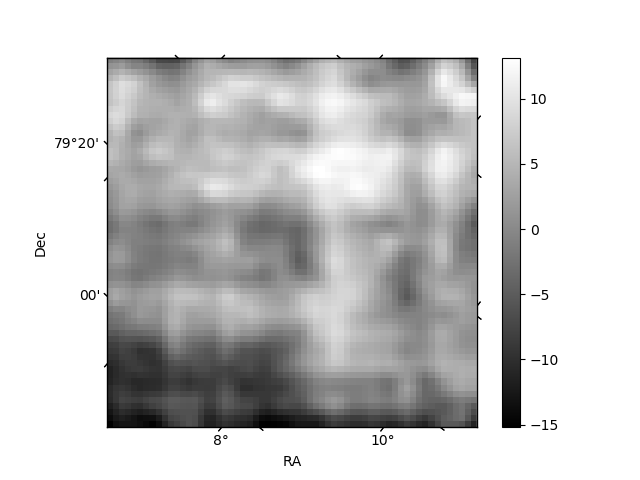
Histogram calculated using DETX and DETY for each event in the final _common_clean file
| Quadrant A | 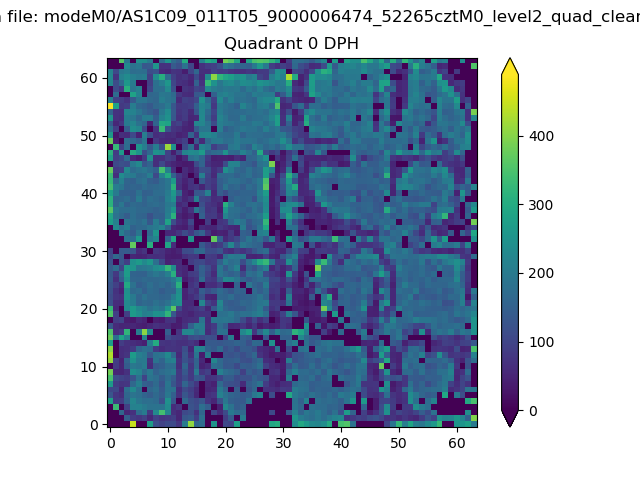 |
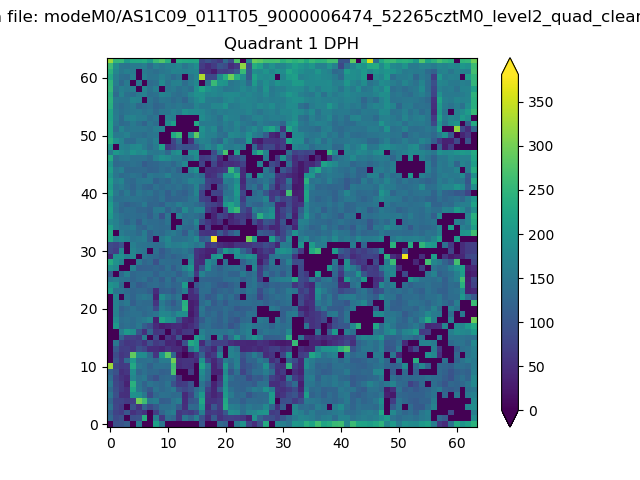 |
Quadrant B |
|---|---|---|---|
| Quadrant D | 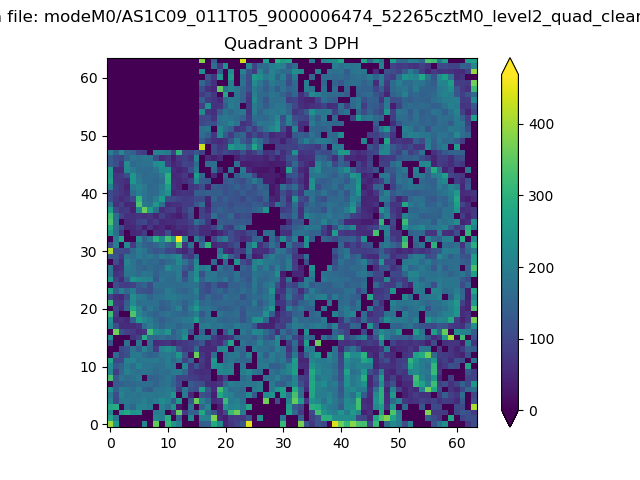 |
 |
Quadrant C |
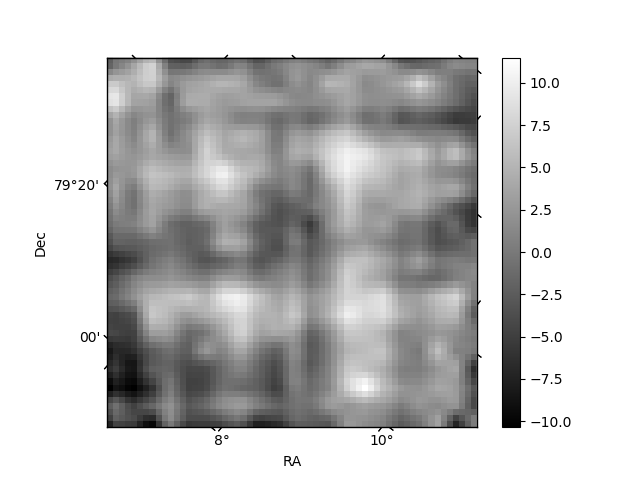
| Plot type | Count rate plots | Images |
|---|---|---|
| Comparison with Poisson distribution Blue bars denote a histogram of data divided into 1 sec bins. Red curve is a Poisson curve with rate = median count rate of data. |
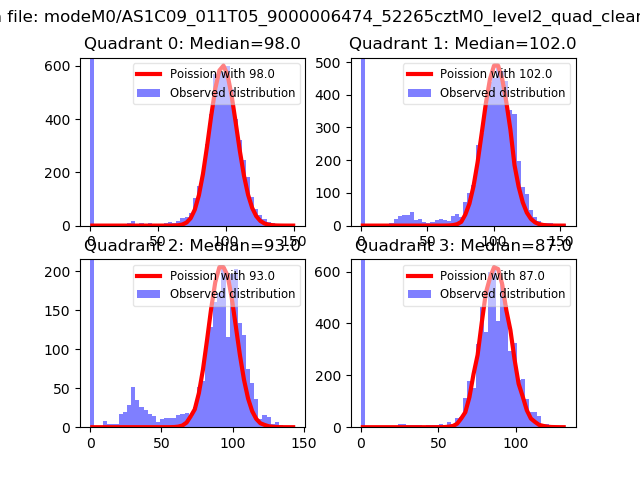 |
 |
| Quadrant-wise count rates Data is divided into 100 sec bins |
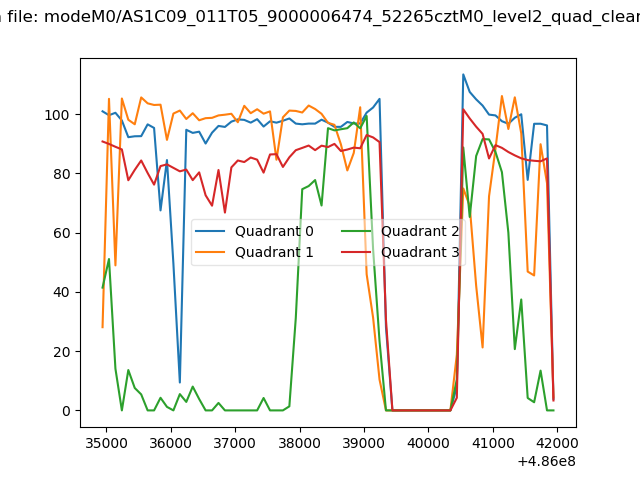 |
|
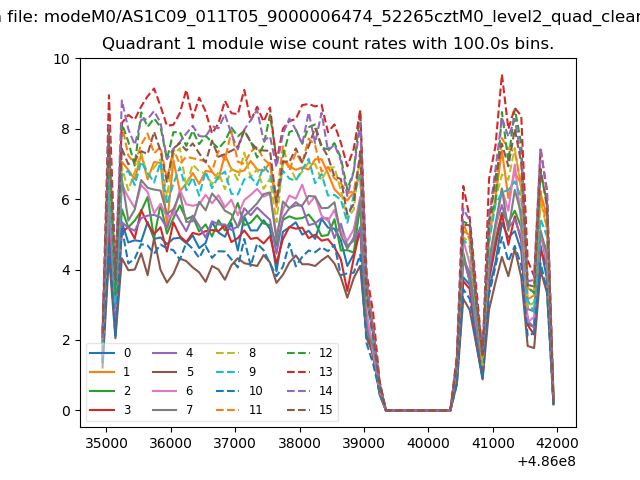
| Module-wise count rates for Quadrant A Data is divided into 100 sec bins |
 |
 |
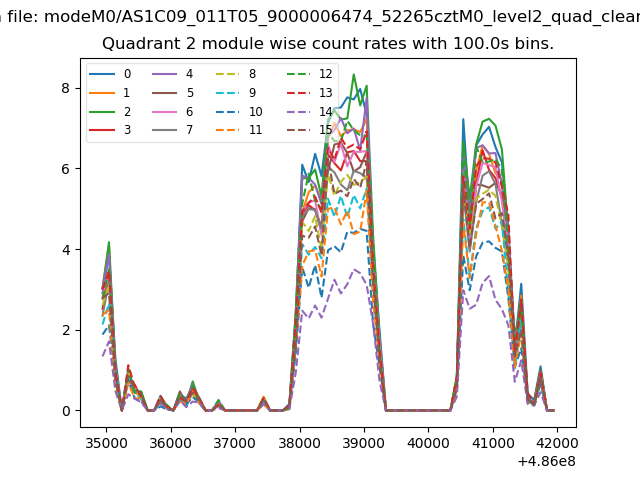
| Module-wise count rates for Quadrant B Data is divided into 100 sec bins |
 |
 |
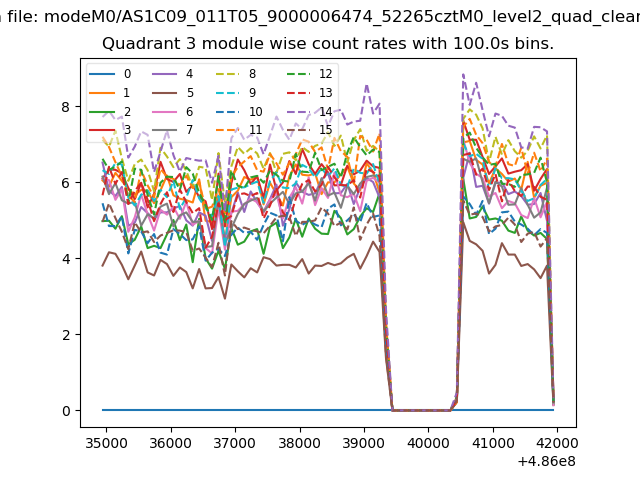
| Module-wise count rates for Quadrant C Data is divided into 100 sec bins |
 |
 |
| Module-wise count rates for Quadrant D Data is divided into 100 sec bins |
 |
 |
| Parameter | Plot |
|---|---|
| CZT HV Monitor | 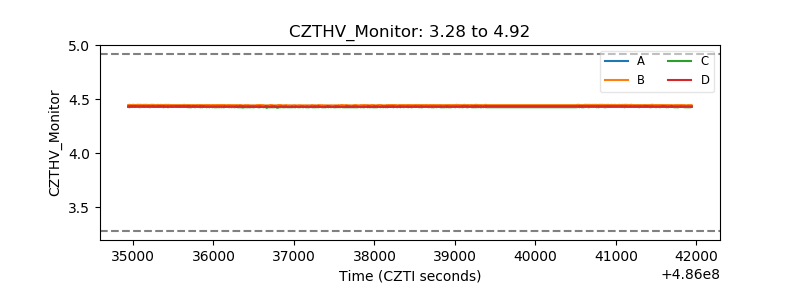 |
| D_VDD | 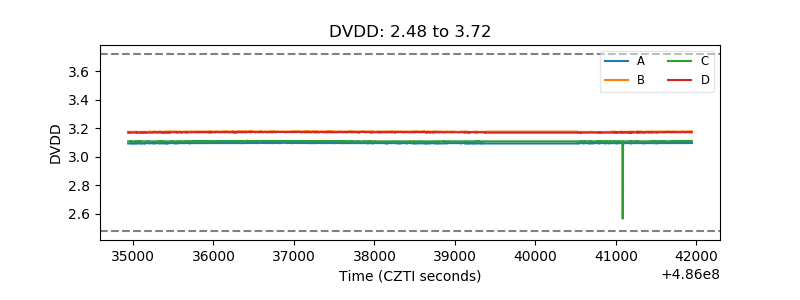 |
| Temperature 1 | 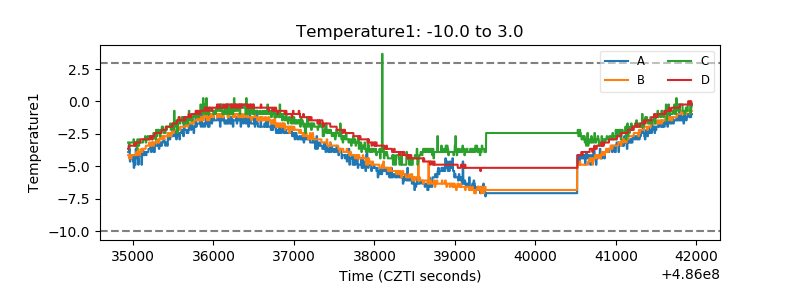 |
| Veto HV Monitor |  |
| Veto LLD | 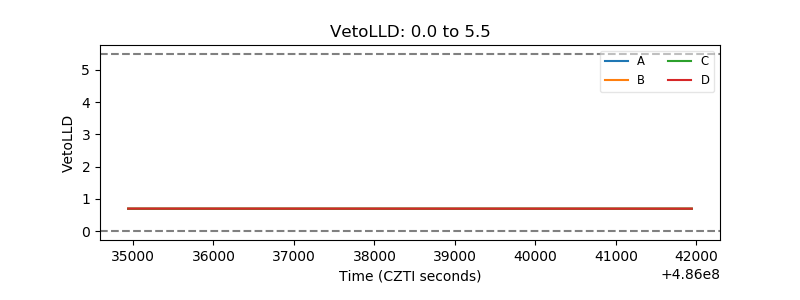 |
| Alpha Counter | 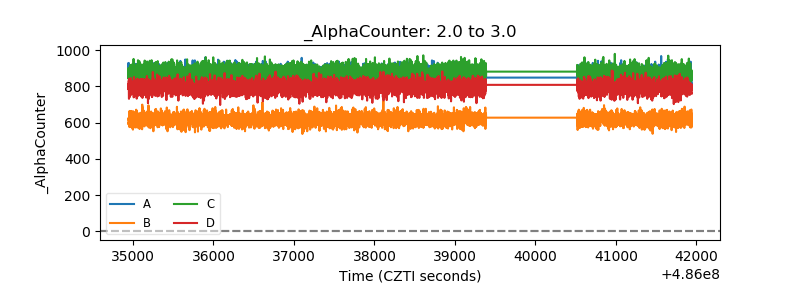 |
| _CPM_Rate | 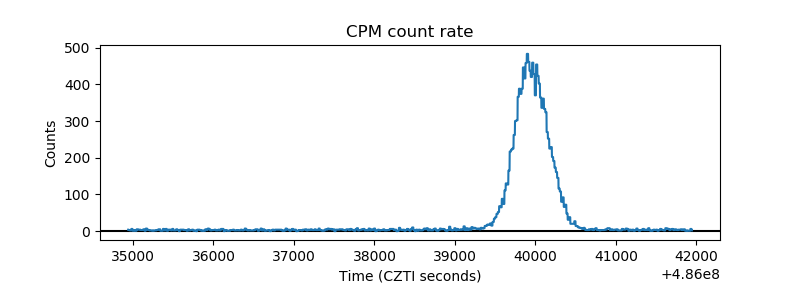 |
| CZT Counter | 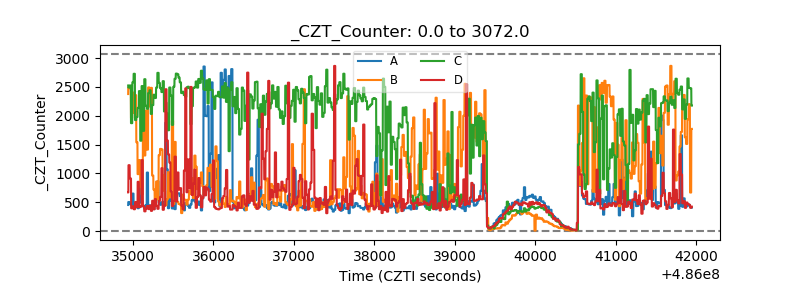 |
| +2.5 Volts monitor |  |
| +5 Volts monitor |  |
| _ROLL_ROT | 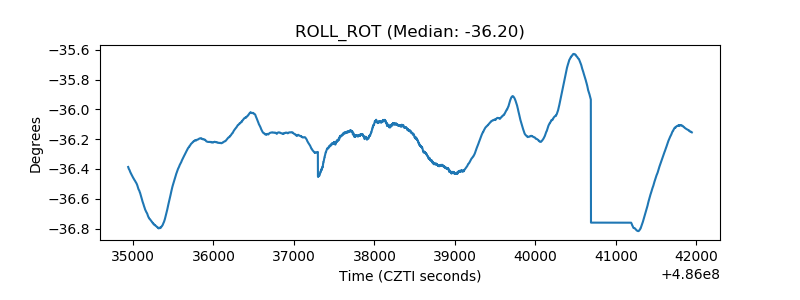 |
| _Roll_DEC | 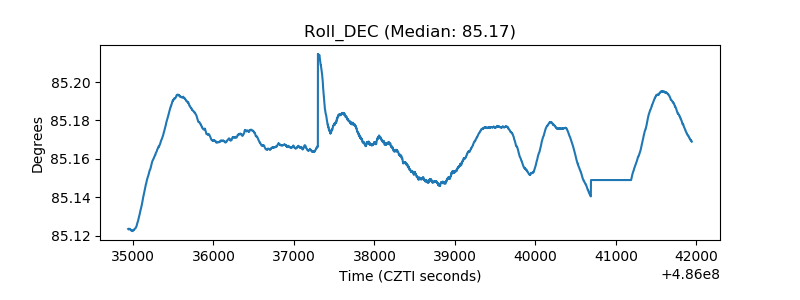 |
| _Roll_RA | 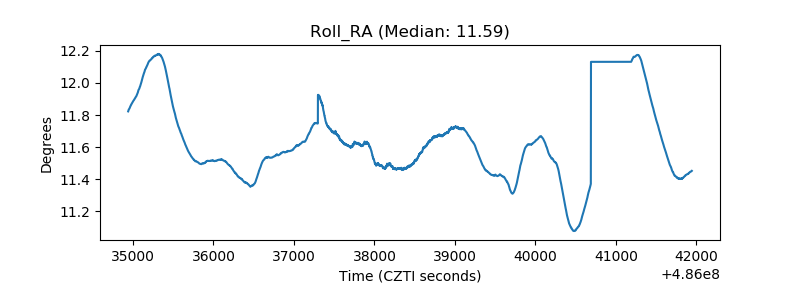 |
| Veto Counter | 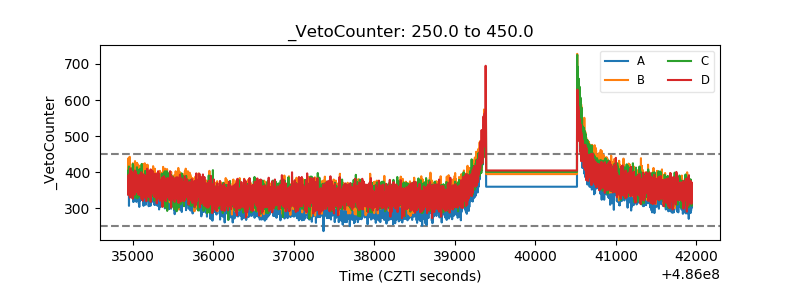 |