| Param | Original file | Final file |
|---|---|---|
| Filename | modeM0/AS1C09_011T05_9000006474_52266cztM0_level2.fits | modeM0/AS1C09_011T05_9000006474_52266cztM0_level2_quad_clean.evt |
| Size (bytes) | 762,099,840 | 74,237,760 |
| Size | 726.8 MB | 70.8 MB |
| Events in quadrant A | 3,821,195 | 576,620 |
| Events in quadrant B | 7,303,615 | 536,782 |
| Events in quadrant C | 12,207,879 | 182,967 |
| Events in quadrant D | 4,395,976 | 517,652 |
| Mode M0 | |||
|---|---|---|---|
| Quadrant | BADHDUFLAG | Total packets | Discarded packets |
| A | 0 | 15677 | 2 |
| B | 0 | 26035 | 1 |
| C | 0 | 40511 | 7 |
| D | 0 | 17405 | 1 |
| Mode SS | |||
|---|---|---|---|
| Quadrant | BADHDUFLAG | Total packets | Discarded packets |
| A | 0 | 126 | 0 |
| B | 0 | 126 | 0 |
| C | 0 | 126 | 0 |
| D | 0 | 126 | 0 |
| Mode M9 | |||
|---|---|---|---|
| Quadrant | BADHDUFLAG | Total packets | Discarded packets |
| A | 0 | 11 | 0 |
| B | 0 | 11 | 0 |
| C | 0 | 11 | 0 |
| D | 0 | 11 | 0 |
| Quadrant | Total seconds | Saturated seconds | Saturation percentage |
|---|---|---|---|
| A | 6210 | 296 | 4.766506% |
| B | 6210 | 1275 | 20.531401% |
| C | 6210 | 4525 | 72.866345% |
| D | 6210 | 257 | 4.138486% |
Noise dominated data is calculated using 1-second bins in cleaned event files. If a bin has >2000 counts, and if more than 50% of those come from <1% of pixels, then it is considered to be noise-dominated and hence unusable.
| Quadrant | # 1 sec bins | Bins with >0 counts | Bins with >2000 counts | High rate bins dominated by noise | Noise dominated (total time) | Noise dominated (detector-on time) | Marked lightcurve |
|---|---|---|---|---|---|---|---|
| A | 7256 | 6212 | 177 | 177 | 2.44% | 2.85% | 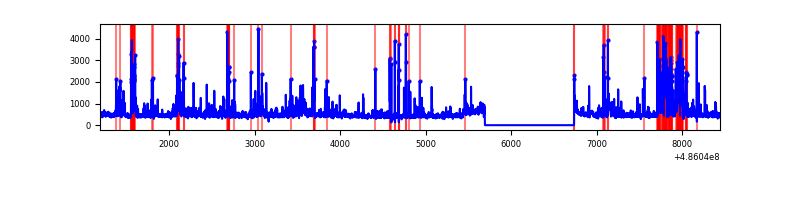 |
| B | 7256 | 6212 | 804 | 804 | 11.08% | 12.94% | 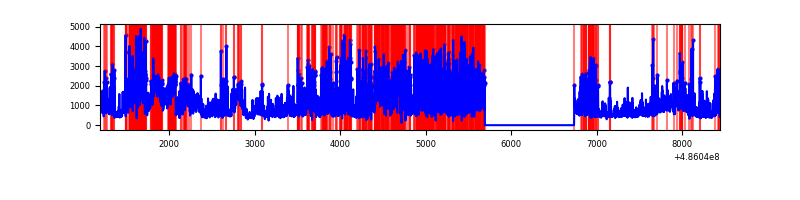 |
| C | 7255 | 6211 | 3501 | 3501 | 48.26% | 56.37% | 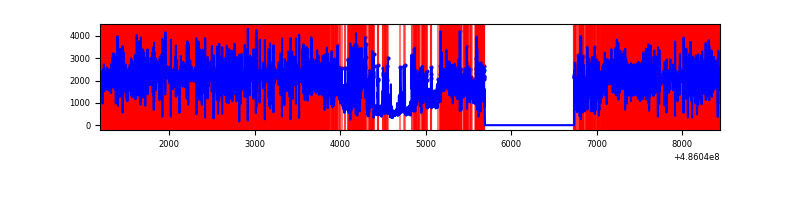 |
| D | 7255 | 6211 | 205 | 205 | 2.83% | 3.30% | 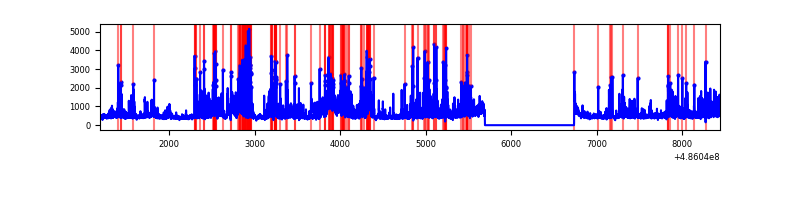 |
Top three noisy pixels from each quadrant. If the there are fewer than three noisy pixels in the level2.evt file, extra rows are filled as -1
| Pixel properties | Quadrant properties | ||||||
|---|---|---|---|---|---|---|---|
| Quadrant | DetID | PixID | Counts | Sigma | Mean | Median | Sigma |
| A | 4 | 249 | 370862 | 2318.82 | 643 | 628 | 159.7 |
| A | 13 | 248 | 246435 | 1539.52 | 643 | 628 | 159.7 |
| A | 15 | 174 | 129458 | 806.88 | 643 | 628 | 159.7 |
| B | 12 | 32 | 1778314 | 14221.88 | 589 | 571 | 125.0 |
| B | 10 | 254 | 1697470 | 13575.13 | 589 | 571 | 125.0 |
| B | 0 | 216 | 329780 | 2633.66 | 589 | 571 | 125.0 |
| C | 15 | 158 | 7573680 | 73430.36 | 373 | 370 | 103.1 |
| C | 15 | 224 | 2013288 | 19517.13 | 373 | 370 | 103.1 |
| C | 15 | 159 | 202225 | 1957.17 | 373 | 370 | 103.1 |
| D | 8 | 176 | 846353 | 4790.57 | 622 | 594 | 176.5 |
| D | 11 | 176 | 330873 | 1870.78 | 622 | 594 | 176.5 |
| D | 12 | 128 | 147161 | 830.19 | 622 | 594 | 176.5 |
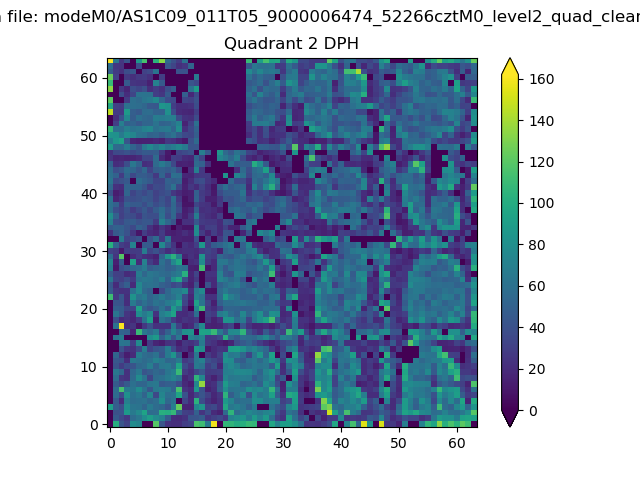
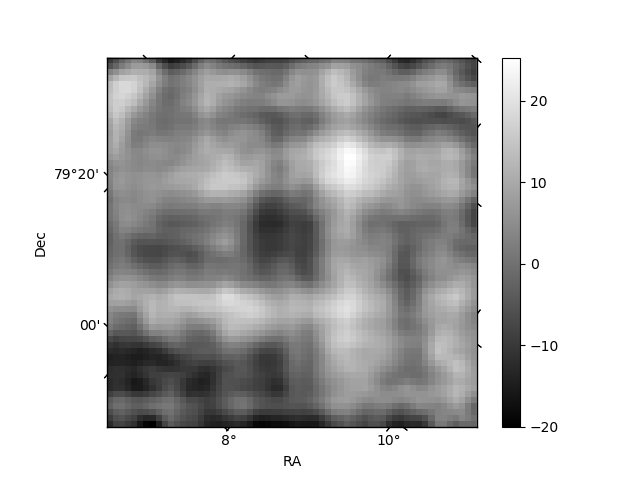
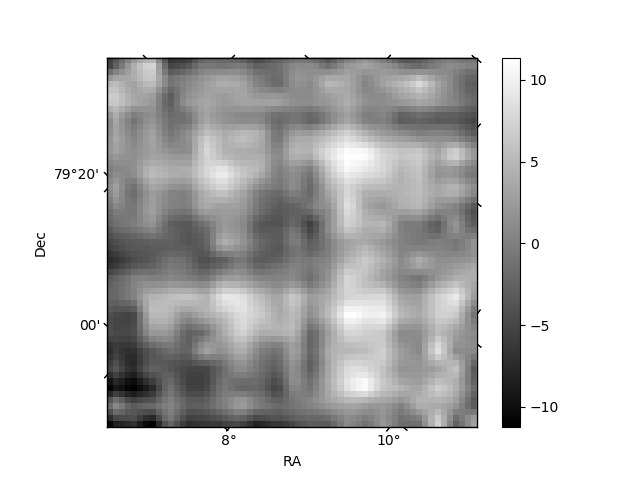
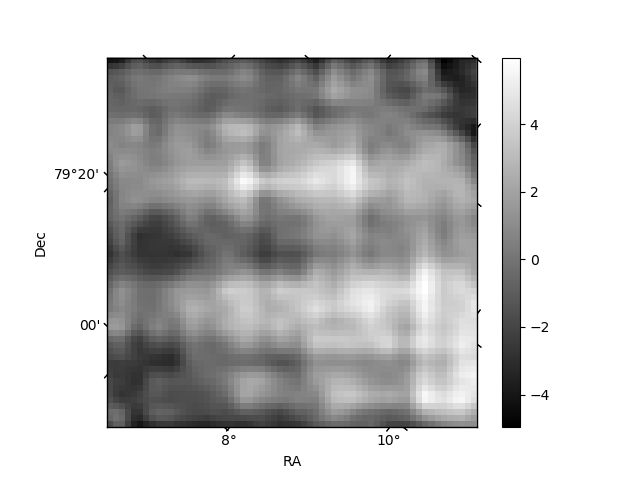
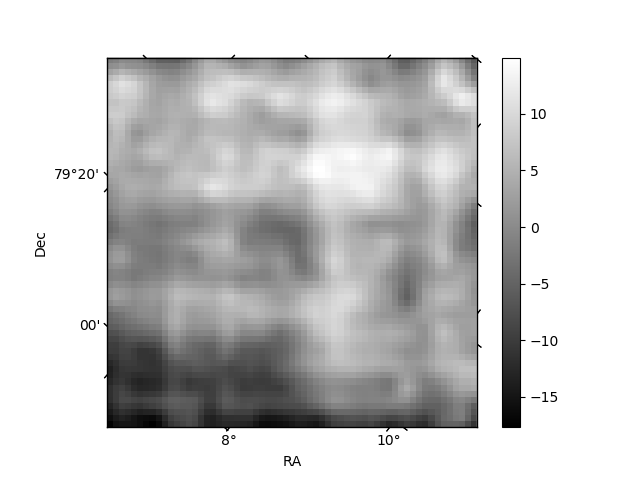
Histogram calculated using DETX and DETY for each event in the final _common_clean file
| Quadrant A | 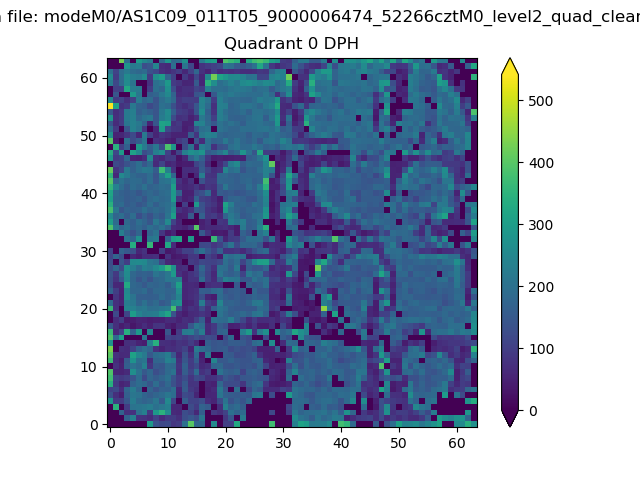 |
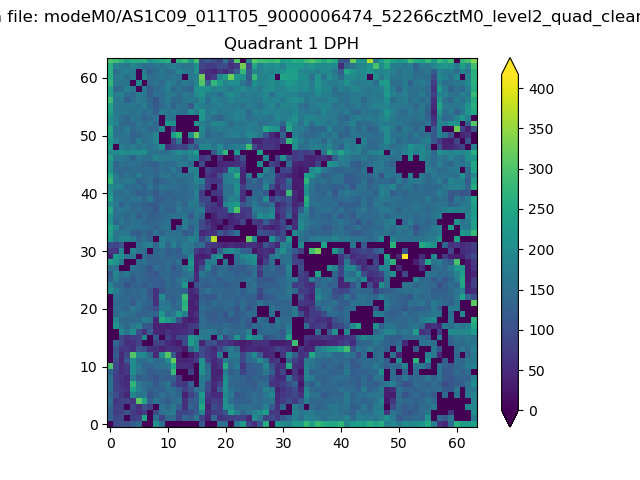 |
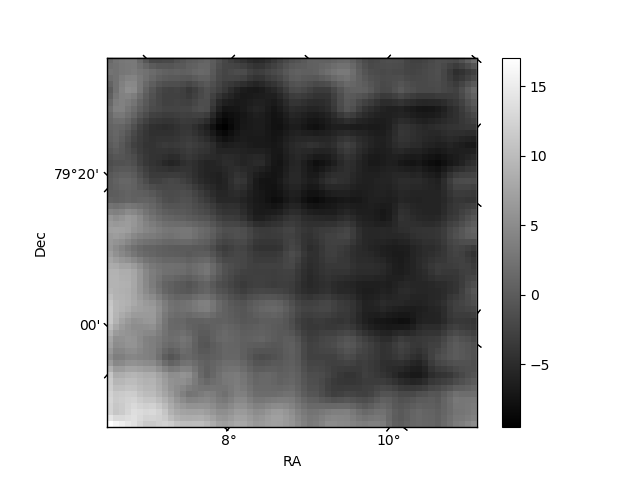
Quadrant B |
|---|---|---|---|
| Quadrant D | 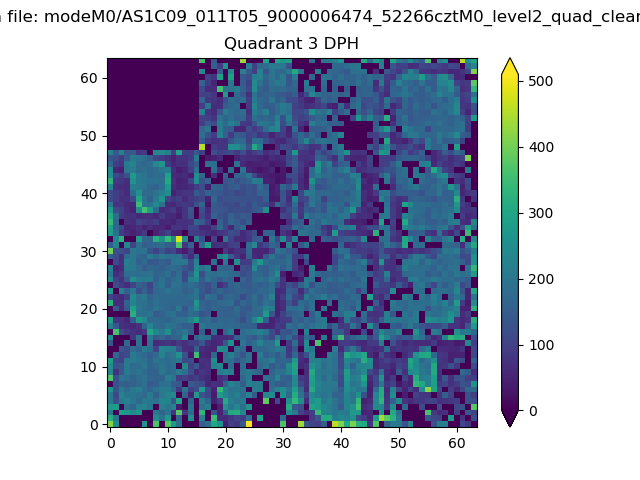 |
 |
Quadrant C |
| Plot type | Count rate plots | Images |
|---|---|---|
| Comparison with Poisson distribution Blue bars denote a histogram of data divided into 1 sec bins. Red curve is a Poisson curve with rate = median count rate of data. |
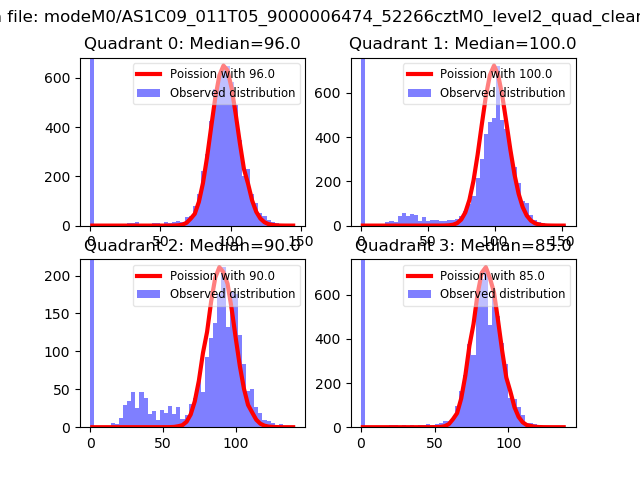 |
 |
| Quadrant-wise count rates Data is divided into 100 sec bins |
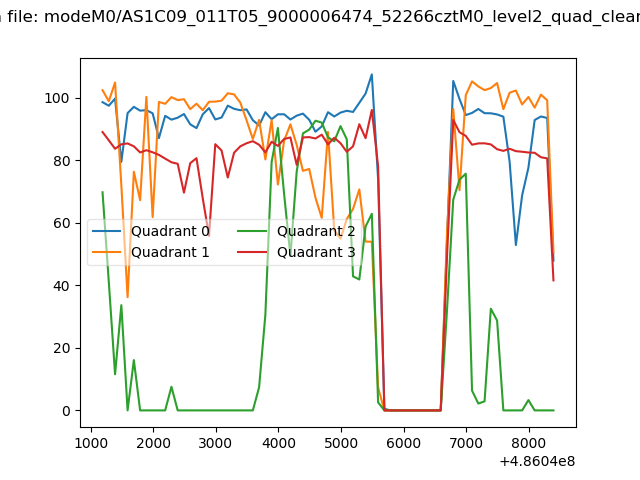 |
|
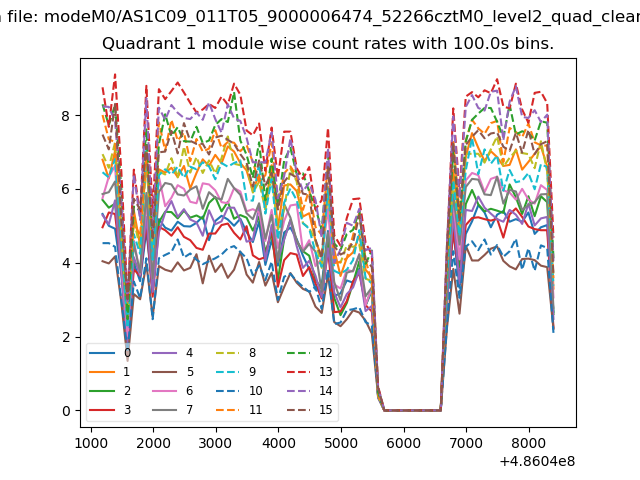
| Module-wise count rates for Quadrant A Data is divided into 100 sec bins |
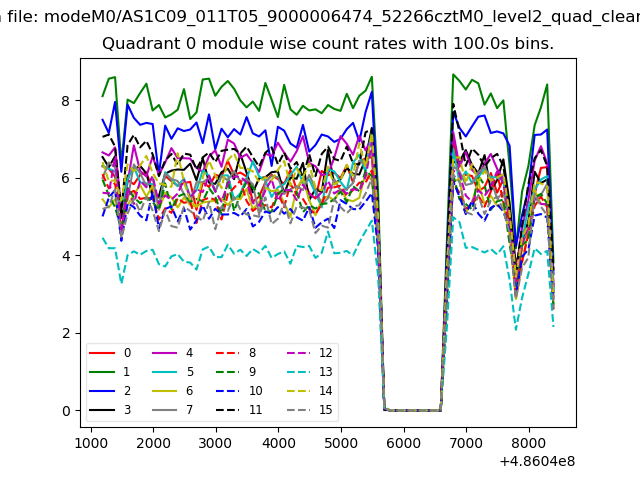 |
 |
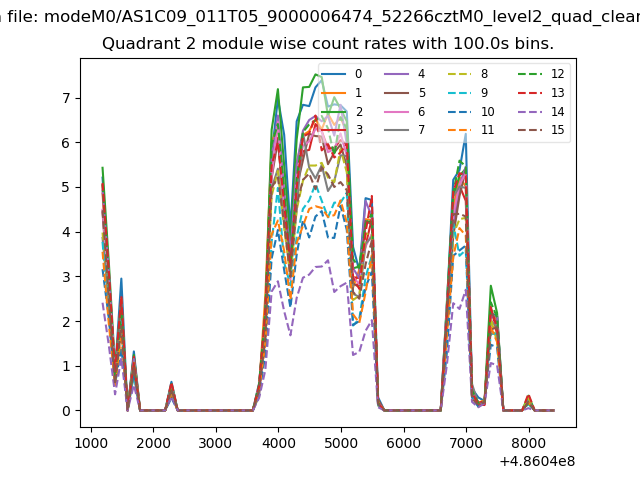
| Module-wise count rates for Quadrant B Data is divided into 100 sec bins |
 |
 |
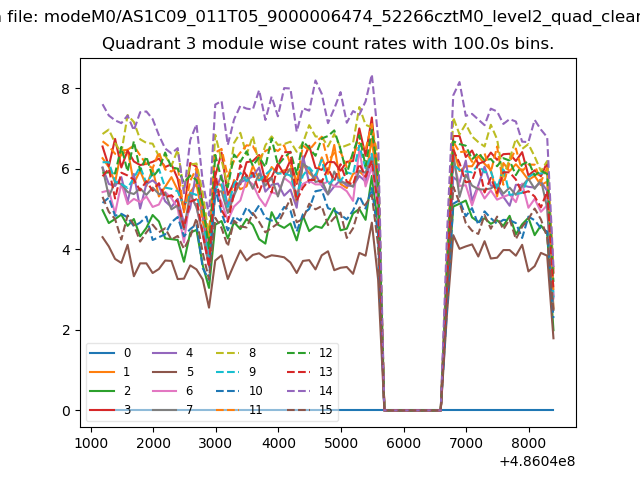
| Module-wise count rates for Quadrant C Data is divided into 100 sec bins |
 |
 |
| Module-wise count rates for Quadrant D Data is divided into 100 sec bins |
 |
 |
| Parameter | Plot |
|---|---|
| CZT HV Monitor | 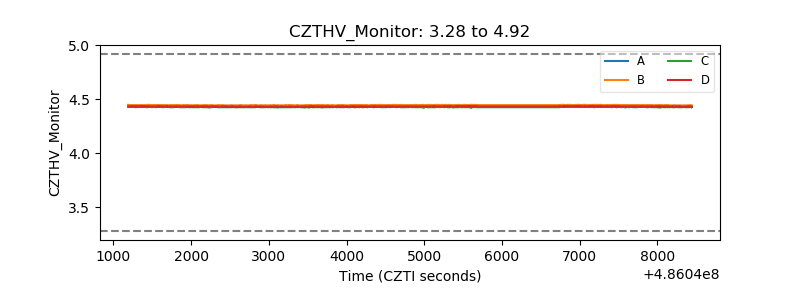 |
| D_VDD | 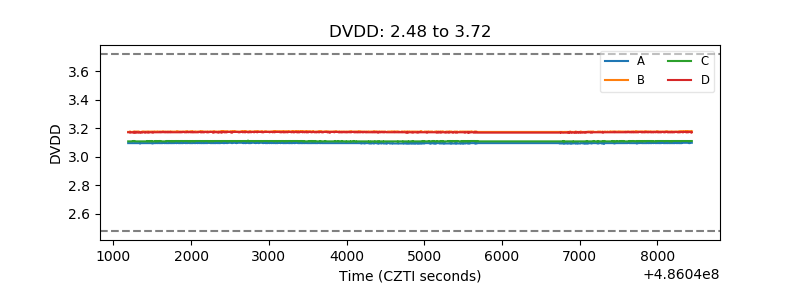 |
| Temperature 1 | 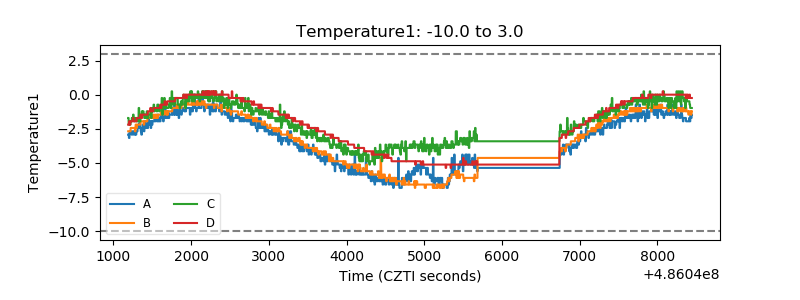 |
| Veto HV Monitor |  |
| Veto LLD | 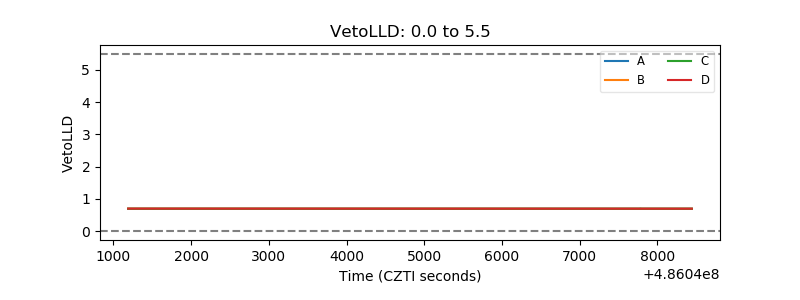 |
| Alpha Counter | 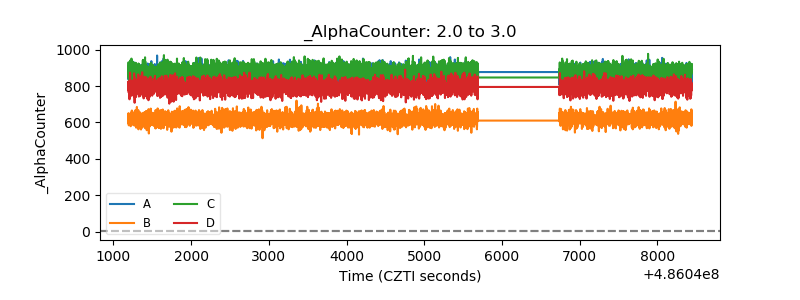 |
| _CPM_Rate | 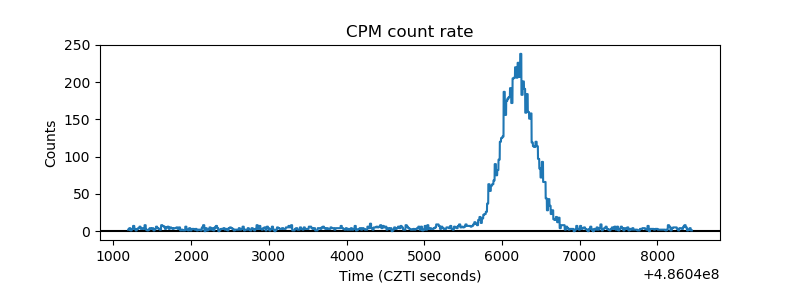 |
| CZT Counter | 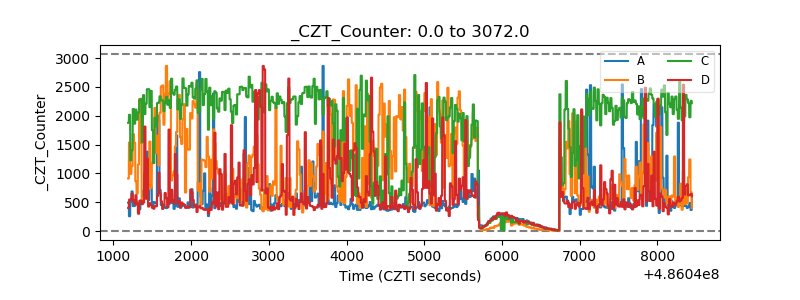 |
| +2.5 Volts monitor |  |
| +5 Volts monitor |  |
| _ROLL_ROT | 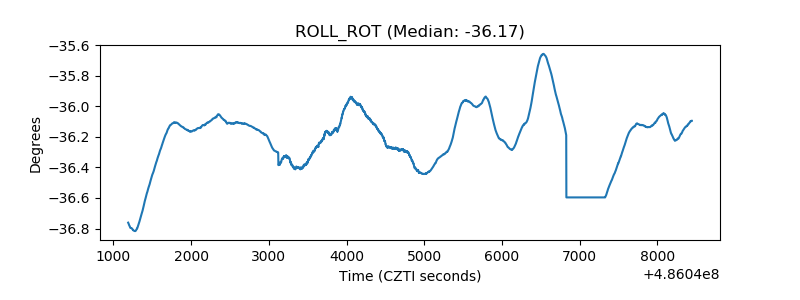 |
| _Roll_DEC | 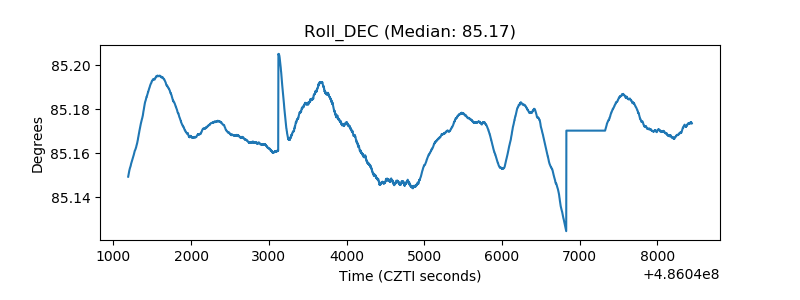 |
| _Roll_RA | 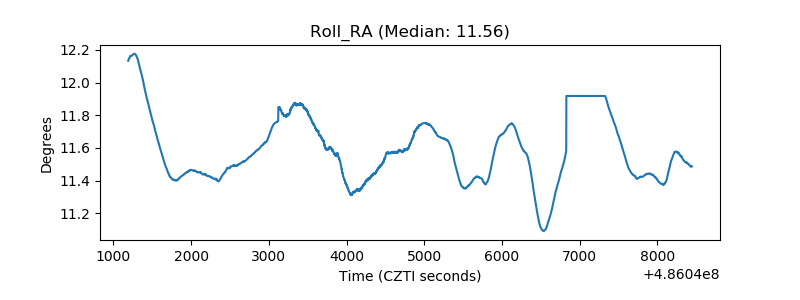 |
| Veto Counter | 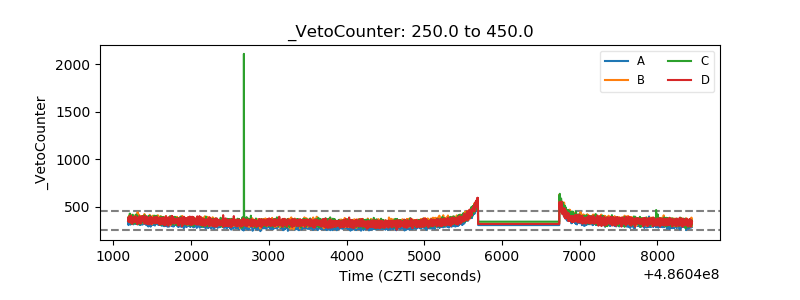 |