| Param | Original file | Final file |
|---|---|---|
| Filename | modeM0/AS1C09_011T05_9000006474_52267cztM0_level2.fits | modeM0/AS1C09_011T05_9000006474_52267cztM0_level2_quad_clean.evt |
| Size (bytes) | 761,981,760 | 75,813,120 |
| Size | 726.7 MB | 72.3 MB |
| Events in quadrant A | 3,711,734 | 600,840 |
| Events in quadrant B | 6,447,493 | 593,849 |
| Events in quadrant C | 13,694,922 | 95,029 |
| Events in quadrant D | 3,840,222 | 546,664 |
| Mode M0 | |||
|---|---|---|---|
| Quadrant | BADHDUFLAG | Total packets | Discarded packets |
| A | 0 | 15586 | 1 |
| B | 0 | 23737 | 1 |
| C | 0 | 45139 | 1 |
| D | 0 | 16102 | 1 |
| Mode SS | |||
|---|---|---|---|
| Quadrant | BADHDUFLAG | Total packets | Discarded packets |
| A | 0 | 134 | 0 |
| B | 0 | 134 | 0 |
| C | 0 | 134 | 0 |
| D | 0 | 134 | 0 |
| Mode M9 | |||
|---|---|---|---|
| Quadrant | BADHDUFLAG | Total packets | Discarded packets |
| A | 0 | 7 | 0 |
| B | 0 | 7 | 0 |
| C | 0 | 7 | 0 |
| D | 0 | 7 | 0 |
| Quadrant | Total seconds | Saturated seconds | Saturation percentage |
|---|---|---|---|
| A | 6579 | 273 | 4.149567% |
| B | 6580 | 915 | 13.905775% |
| C | 6580 | 5728 | 87.051672% |
| D | 6580 | 170 | 2.583587% |
Noise dominated data is calculated using 1-second bins in cleaned event files. If a bin has >2000 counts, and if more than 50% of those come from <1% of pixels, then it is considered to be noise-dominated and hence unusable.
| Quadrant | # 1 sec bins | Bins with >0 counts | Bins with >2000 counts | High rate bins dominated by noise | Noise dominated (total time) | Noise dominated (detector-on time) | Marked lightcurve |
|---|---|---|---|---|---|---|---|
| A | 7349 | 6580 | 124 | 124 | 1.69% | 1.88% | 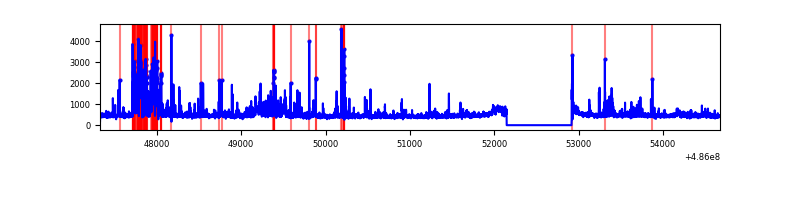 |
| B | 7350 | 6581 | 517 | 517 | 7.03% | 7.86% | 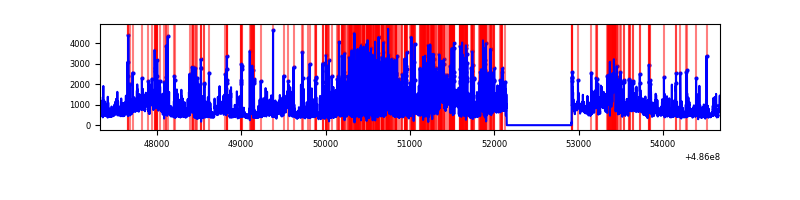 |
| C | 7349 | 6579 | 4181 | 4181 | 56.89% | 63.55% | 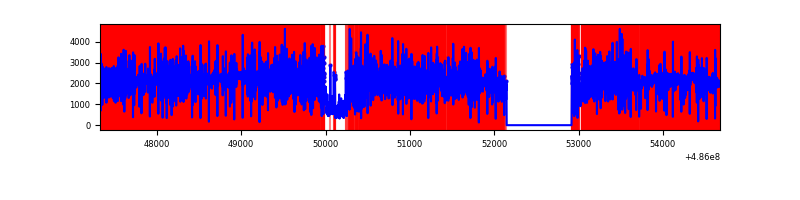 |
| D | 7350 | 6581 | 72 | 72 | 0.98% | 1.09% | 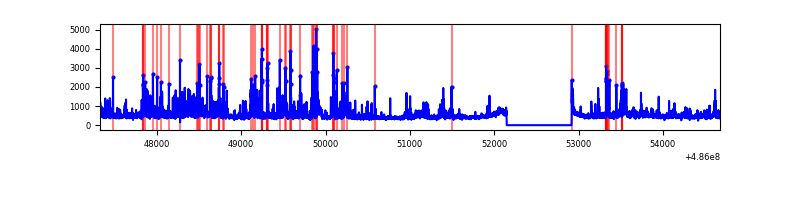 |
Top three noisy pixels from each quadrant. If the there are fewer than three noisy pixels in the level2.evt file, extra rows are filled as -1
| Pixel properties | Quadrant properties | ||||||
|---|---|---|---|---|---|---|---|
| Quadrant | DetID | PixID | Counts | Sigma | Mean | Median | Sigma |
| A | 4 | 249 | 169841 | 997.38 | 681 | 661 | 169.6 |
| A | 13 | 248 | 167189 | 981.74 | 681 | 661 | 169.6 |
| A | 11 | 3 | 160066 | 939.75 | 681 | 661 | 169.6 |
| B | 12 | 32 | 1520453 | 11048.96 | 642 | 619 | 137.6 |
| B | 10 | 254 | 609475 | 4426.29 | 642 | 619 | 137.6 |
| B | 0 | 213 | 294751 | 2138.3 | 642 | 619 | 137.6 |
| C | 15 | 158 | 9179115 | 103568.14 | 315 | 312 | 88.6 |
| C | 15 | 224 | 2249510 | 25378.61 | 315 | 312 | 88.6 |
| C | 15 | 178 | 199013 | 2242.02 | 315 | 312 | 88.6 |
| D | 8 | 176 | 691333 | 3624.72 | 666 | 634 | 190.6 |
| D | 11 | 176 | 94494 | 492.57 | 666 | 634 | 190.6 |
| D | 2 | 120 | 59138 | 307.02 | 666 | 634 | 190.6 |
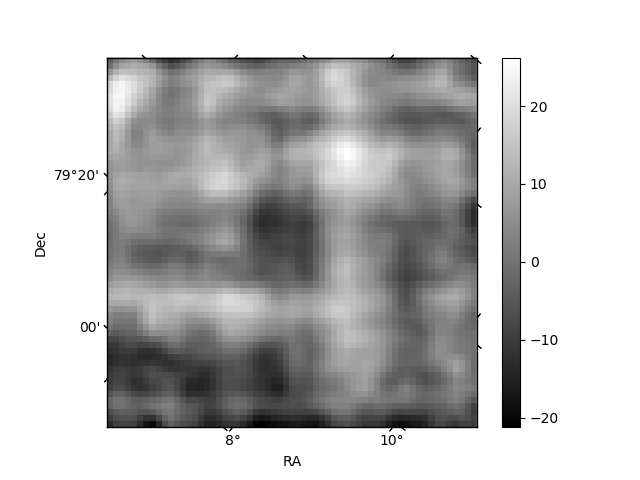
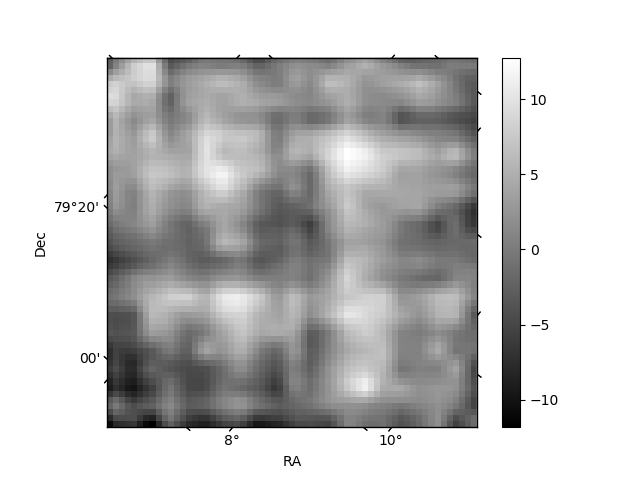
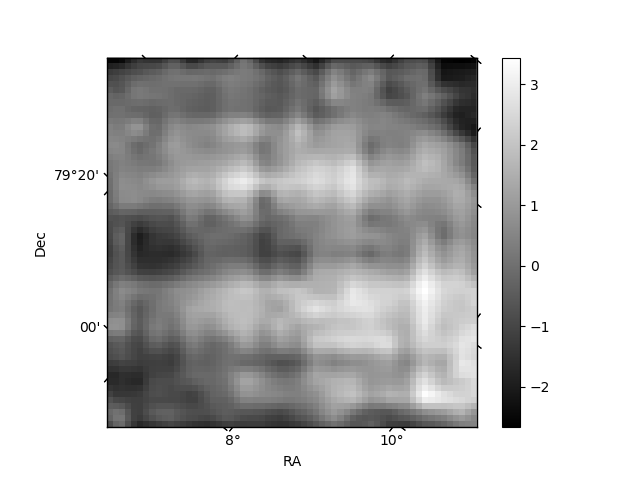
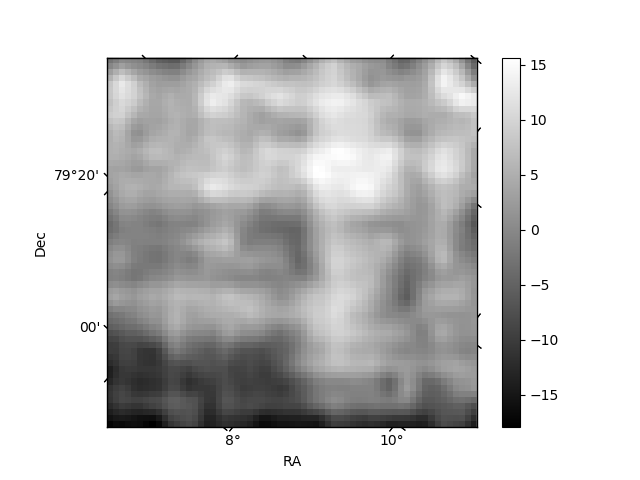
Histogram calculated using DETX and DETY for each event in the final _common_clean file
| Quadrant A | 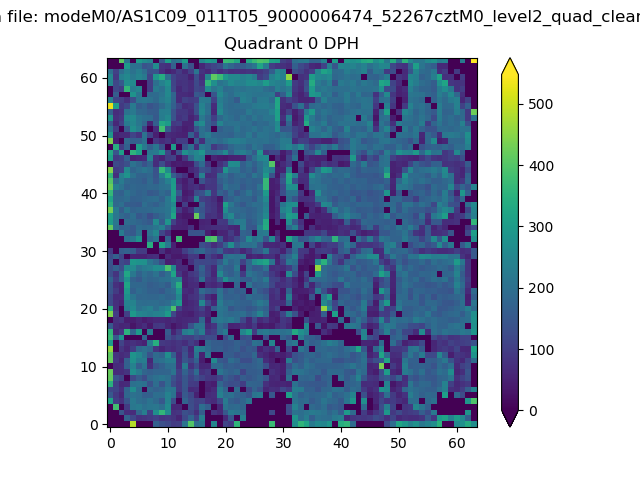 |
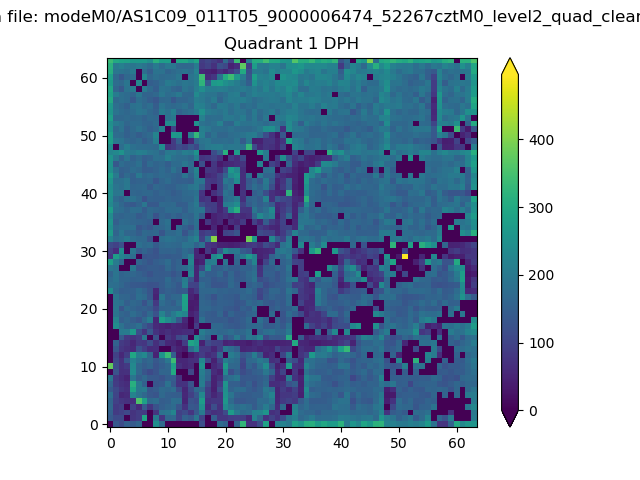 |
Quadrant B |
|---|---|---|---|
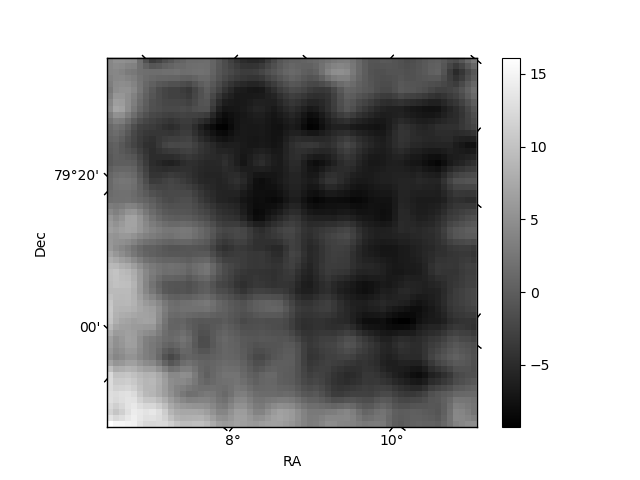
| Quadrant D | 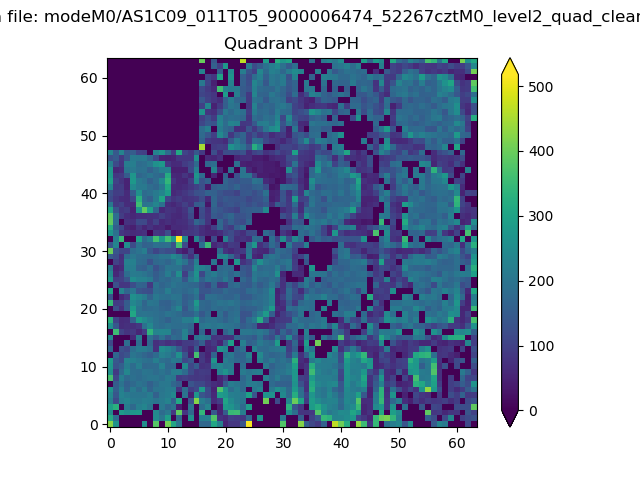 |
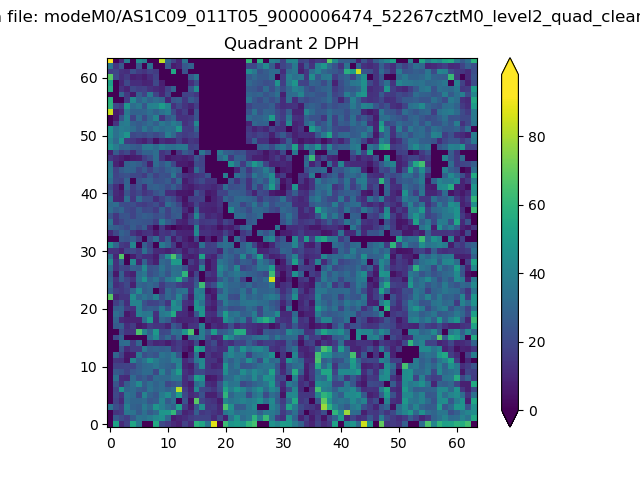 |
Quadrant C |
| Plot type | Count rate plots | Images |
|---|---|---|
| Comparison with Poisson distribution Blue bars denote a histogram of data divided into 1 sec bins. Red curve is a Poisson curve with rate = median count rate of data. |
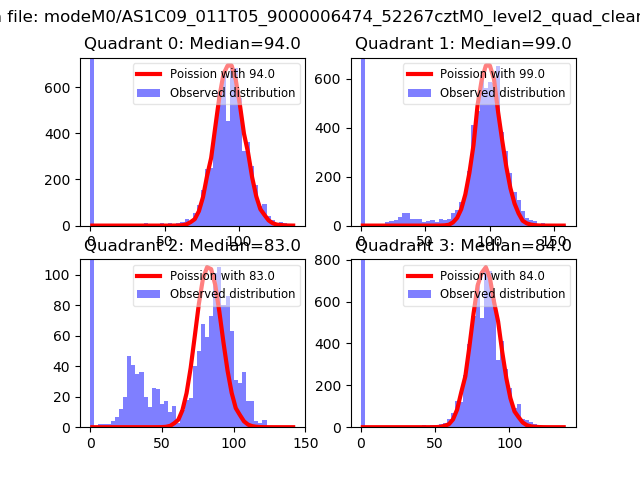 |
 |
| Quadrant-wise count rates Data is divided into 100 sec bins |
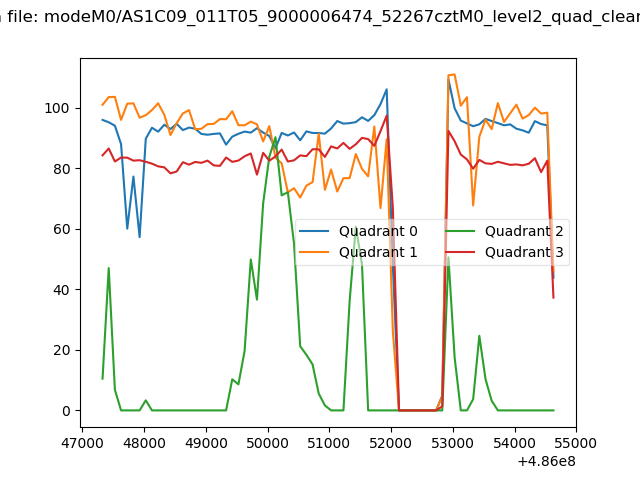 |
|
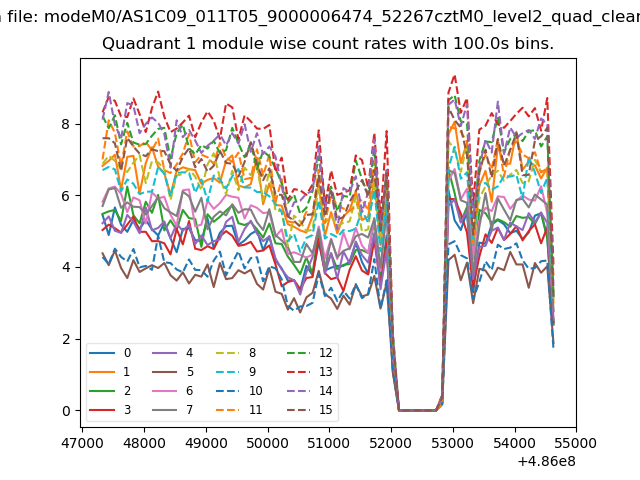
| Module-wise count rates for Quadrant A Data is divided into 100 sec bins |
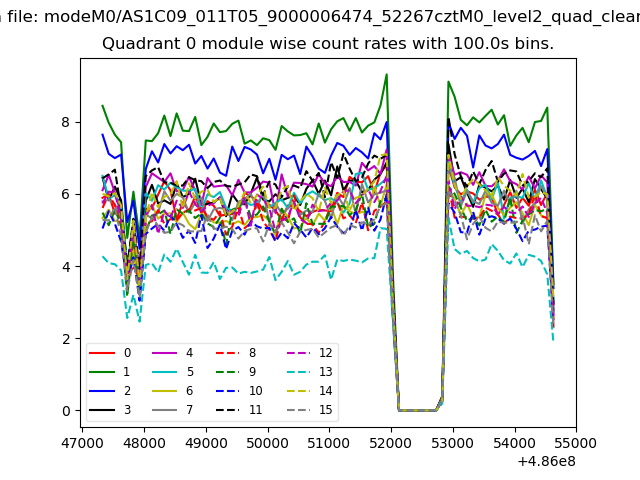 |
 |
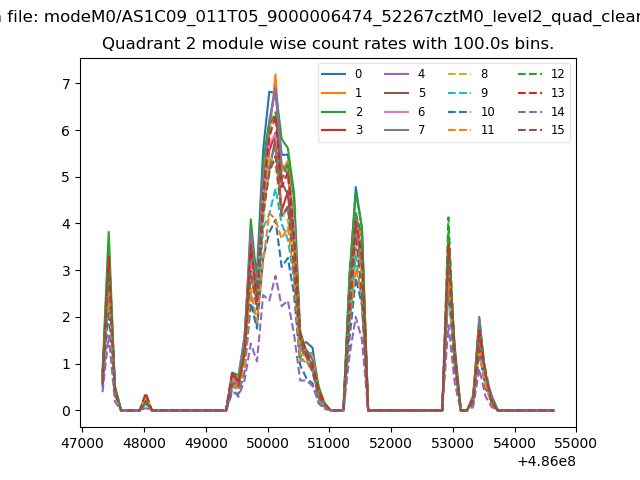
| Module-wise count rates for Quadrant B Data is divided into 100 sec bins |
 |
 |
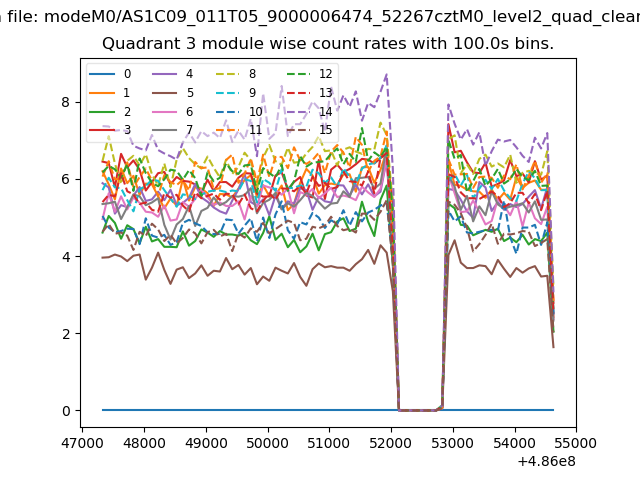
| Module-wise count rates for Quadrant C Data is divided into 100 sec bins |
 |
 |
| Module-wise count rates for Quadrant D Data is divided into 100 sec bins |
 |
 |
| Parameter | Plot |
|---|---|
| CZT HV Monitor | 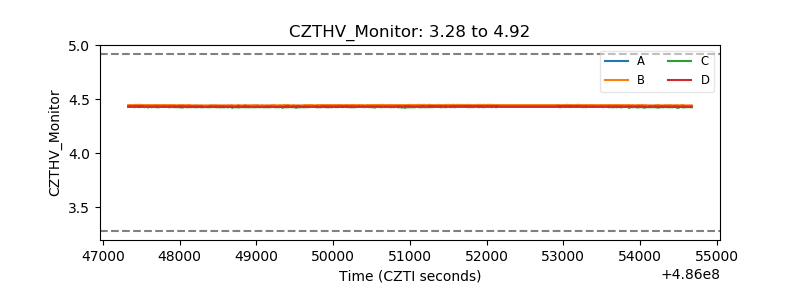 |
| D_VDD | 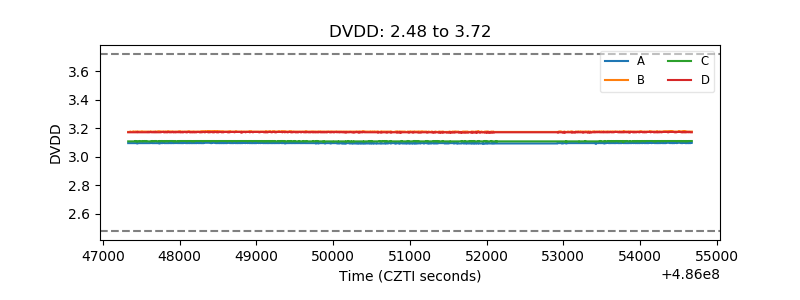 |
| Temperature 1 | 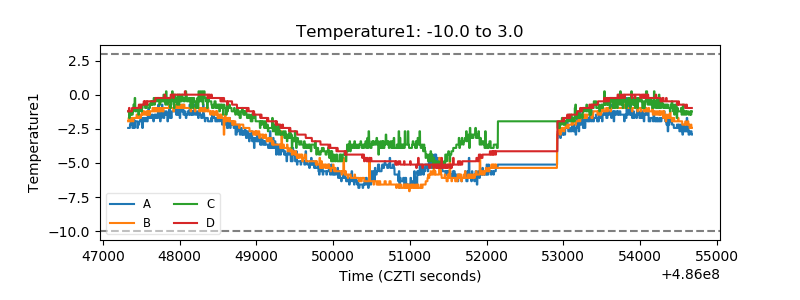 |
| Veto HV Monitor | 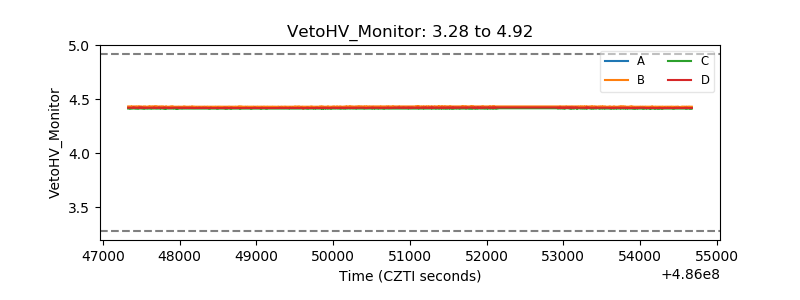 |
| Veto LLD | 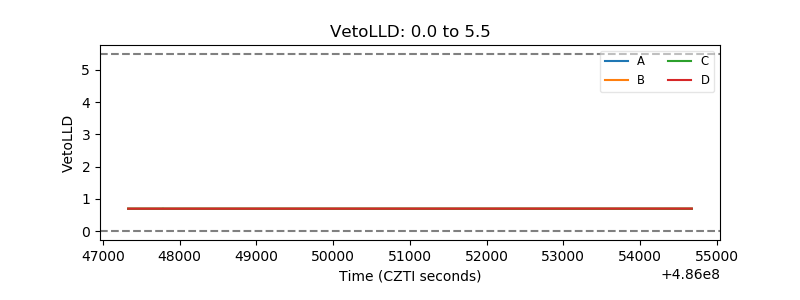 |
| Alpha Counter | 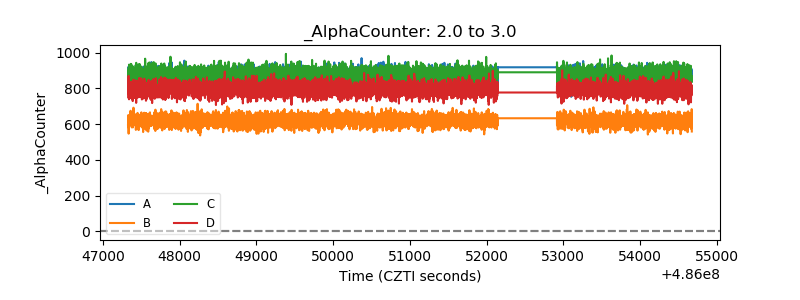 |
| _CPM_Rate | 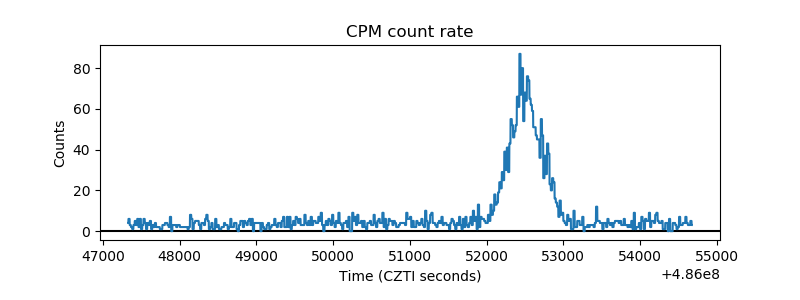 |
| CZT Counter | 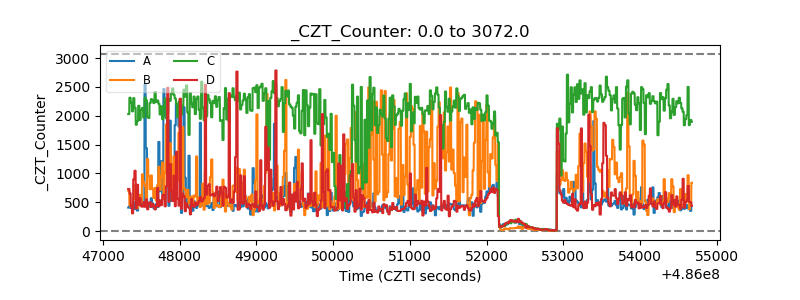 |
| +2.5 Volts monitor | 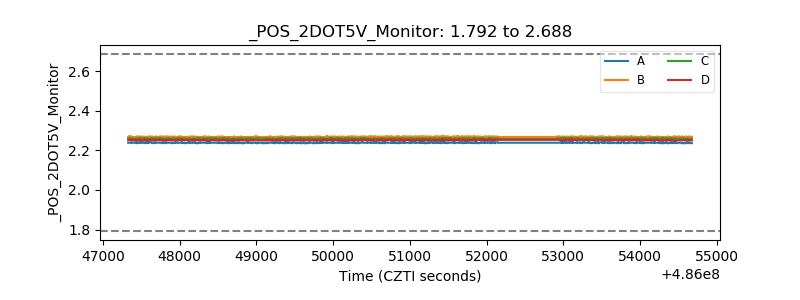 |
| +5 Volts monitor | 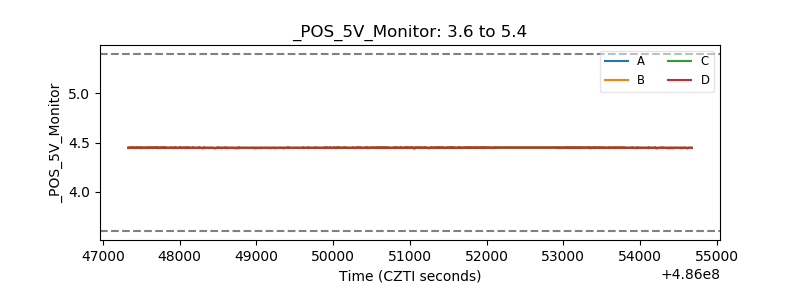 |
| _ROLL_ROT | 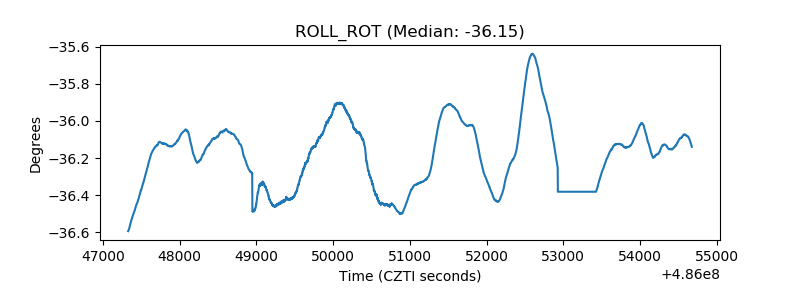 |
| _Roll_DEC | 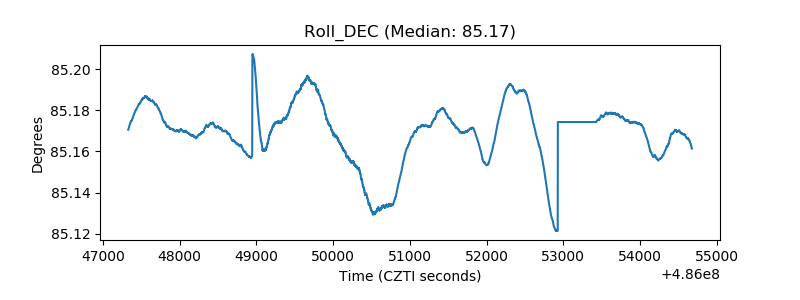 |
| _Roll_RA | 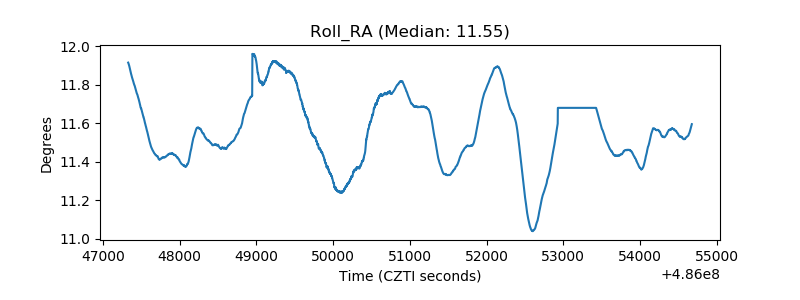 |
| Veto Counter | 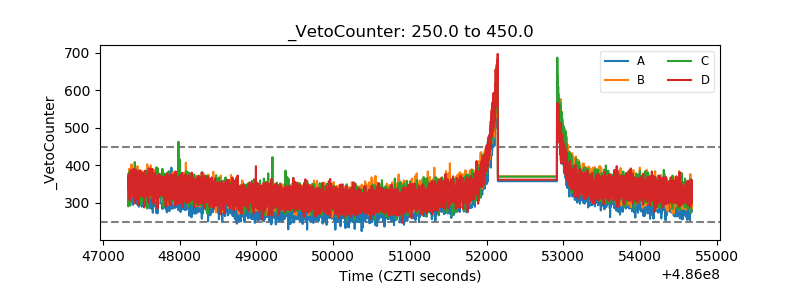 |