| Param | Original file | Final file |
|---|---|---|
| Filename | modeM0/AS1C09_011T05_9000006474_52268cztM0_level2.fits | modeM0/AS1C09_011T05_9000006474_52268cztM0_level2_quad_clean.evt |
| Size (bytes) | 885,928,320 | 76,397,760 |
| Size | 844.9 MB | 72.9 MB |
| Events in quadrant A | 4,036,909 | 633,667 |
| Events in quadrant B | 8,848,171 | 585,426 |
| Events in quadrant C | 15,625,629 | 26,472 |
| Events in quadrant D | 3,742,369 | 581,621 |
| Mode M0 | |||
|---|---|---|---|
| Quadrant | BADHDUFLAG | Total packets | Discarded packets |
| A | 0 | 16845 | 4 |
| B | 0 | 31140 | 1 |
| C | 0 | 51233 | 1 |
| D | 0 | 16243 | 1 |
| Mode SS | |||
|---|---|---|---|
| Quadrant | BADHDUFLAG | Total packets | Discarded packets |
| A | 0 | 142 | 0 |
| B | 0 | 142 | 0 |
| C | 0 | 142 | 0 |
| D | 0 | 142 | 0 |
| Mode M9 | |||
|---|---|---|---|
| Quadrant | BADHDUFLAG | Total packets | Discarded packets |
| A | 0 | 4 | 0 |
| B | 0 | 4 | 0 |
| C | 0 | 4 | 0 |
| D | 0 | 4 | 0 |
| Quadrant | Total seconds | Saturated seconds | Saturation percentage |
|---|---|---|---|
| A | 6969 | 244 | 3.501220% |
| B | 6969 | 1536 | 22.040465% |
| C | 6969 | 6722 | 96.455733% |
| D | 6969 | 107 | 1.535371% |
Noise dominated data is calculated using 1-second bins in cleaned event files. If a bin has >2000 counts, and if more than 50% of those come from <1% of pixels, then it is considered to be noise-dominated and hence unusable.
| Quadrant | # 1 sec bins | Bins with >0 counts | Bins with >2000 counts | High rate bins dominated by noise | Noise dominated (total time) | Noise dominated (detector-on time) | Marked lightcurve |
|---|---|---|---|---|---|---|---|
| A | 7399 | 6970 | 157 | 157 | 2.12% | 2.25% | 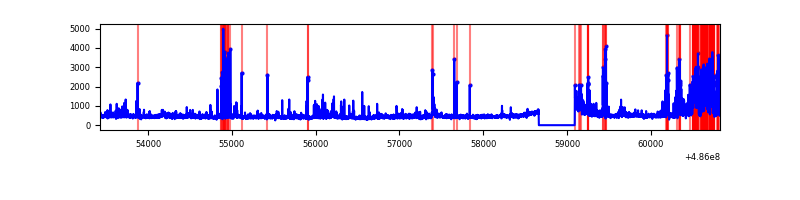 |
| B | 7399 | 6969 | 990 | 990 | 13.38% | 14.21% | 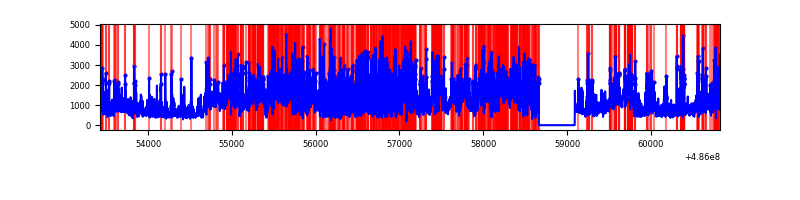 |
| C | 7398 | 6968 | 5713 | 5713 | 77.22% | 81.99% | 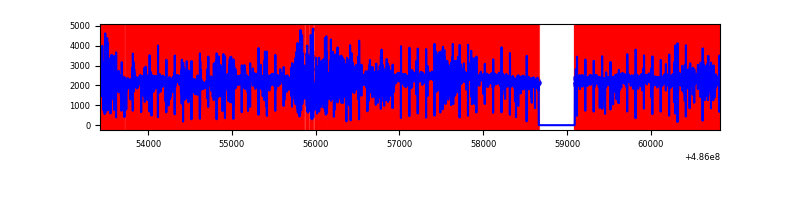 |
| D | 7399 | 6970 | 73 | 73 | 0.99% | 1.05% | 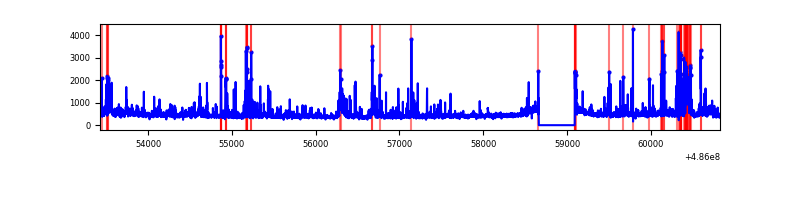 |
Top three noisy pixels from each quadrant. If the there are fewer than three noisy pixels in the level2.evt file, extra rows are filled as -1
| Pixel properties | Quadrant properties | ||||||
|---|---|---|---|---|---|---|---|
| Quadrant | DetID | PixID | Counts | Sigma | Mean | Median | Sigma |
| A | 4 | 249 | 577977 | 3242.08 | 718 | 701 | 178.1 |
| A | 11 | 3 | 122763 | 685.52 | 718 | 701 | 178.1 |
| A | 3 | 14 | 74616 | 415.12 | 718 | 701 | 178.1 |
| B | 12 | 32 | 1654498 | 11802.74 | 665 | 644 | 140.1 |
| B | 7 | 0 | 1585361 | 11309.35 | 665 | 644 | 140.1 |
| B | 10 | 254 | 1145836 | 8172.67 | 665 | 644 | 140.1 |
| C | 15 | 158 | 11854477 | 202106.24 | 199 | 196 | 58.7 |
| C | 15 | 224 | 1107726 | 18882.52 | 199 | 196 | 58.7 |
| C | 3 | 242 | 700151 | 11933.69 | 199 | 196 | 58.7 |
| D | 8 | 176 | 220318 | 1110.71 | 700 | 668 | 197.8 |
| D | 11 | 176 | 166154 | 836.82 | 700 | 668 | 197.8 |
| D | 2 | 249 | 134235 | 675.41 | 700 | 668 | 197.8 |
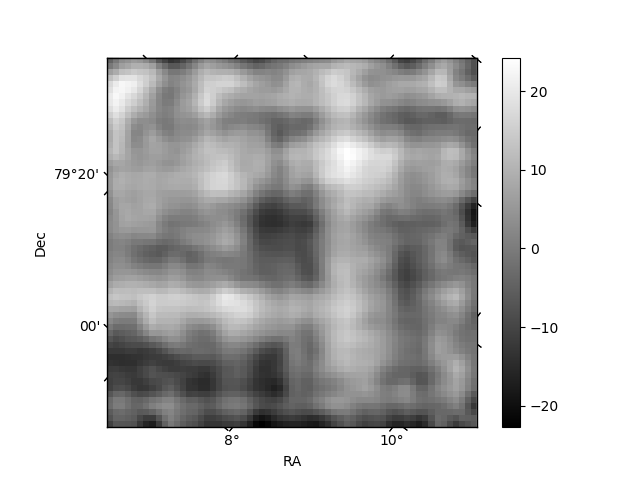
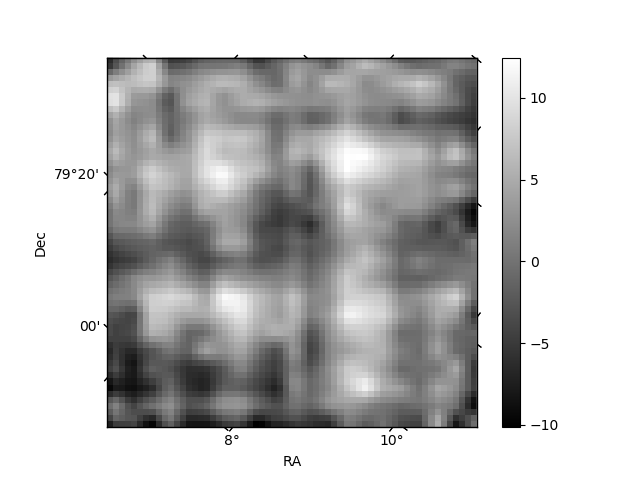
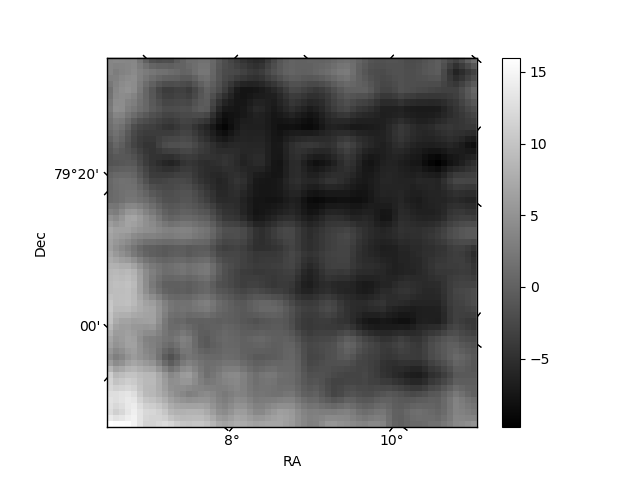
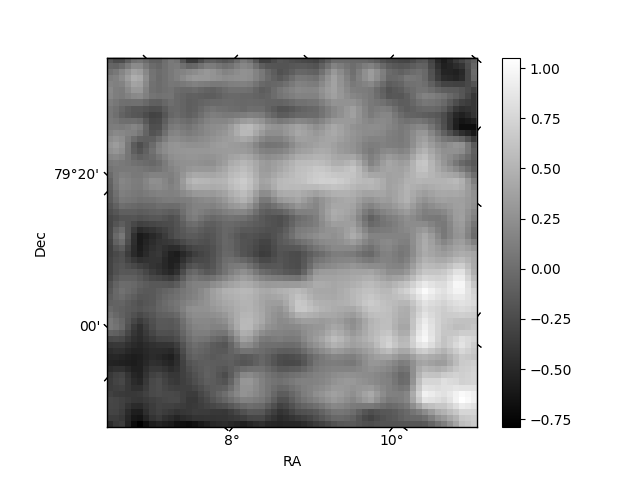
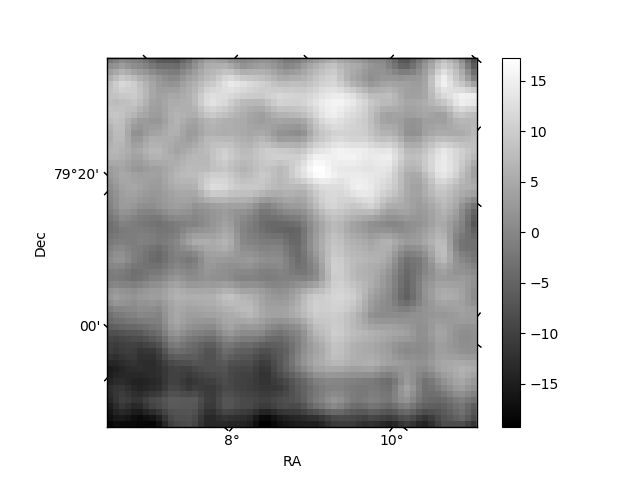
Histogram calculated using DETX and DETY for each event in the final _common_clean file
| Quadrant A | 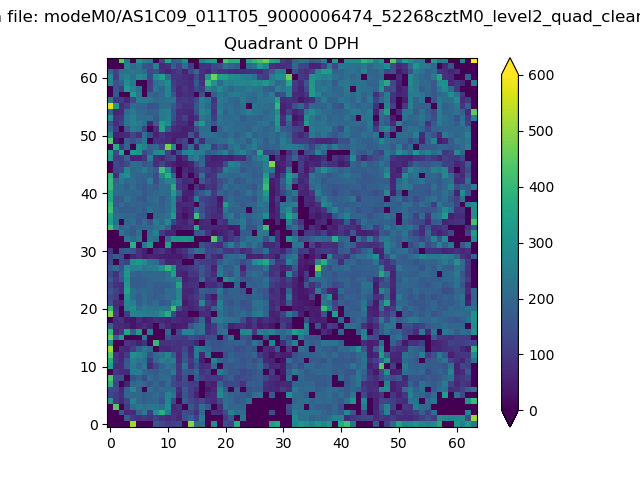 |
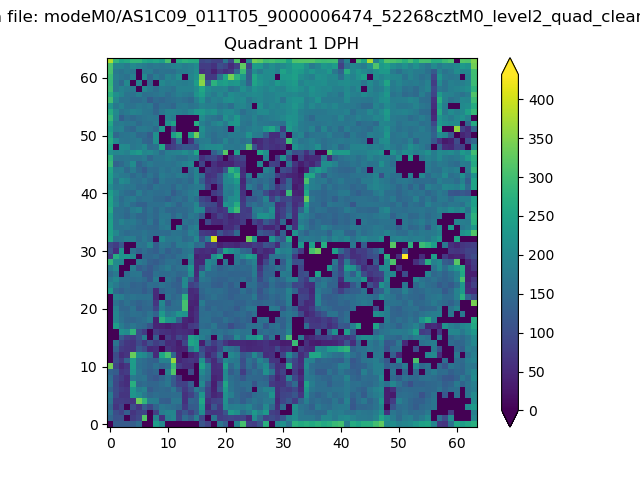 |
Quadrant B |
|---|---|---|---|
| Quadrant D | 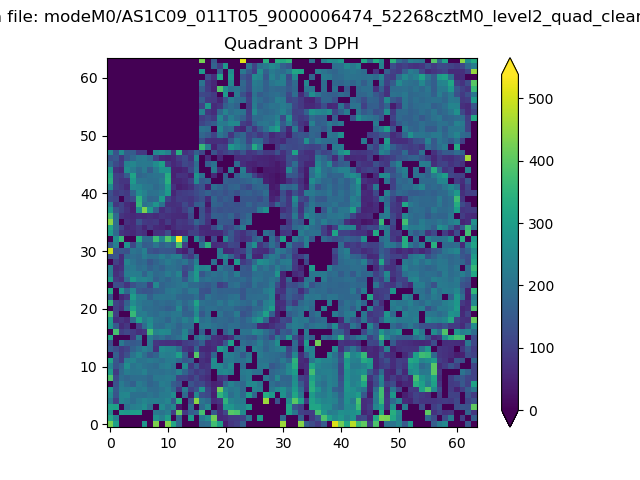 |
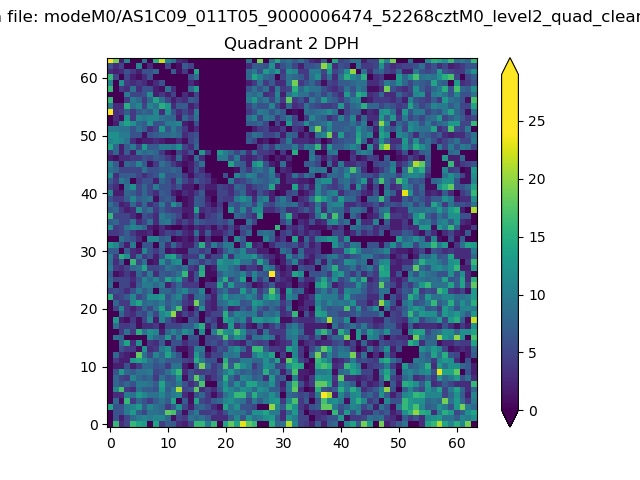 |
Quadrant C |
| Plot type | Count rate plots | Images |
|---|---|---|
| Comparison with Poisson distribution Blue bars denote a histogram of data divided into 1 sec bins. Red curve is a Poisson curve with rate = median count rate of data. |
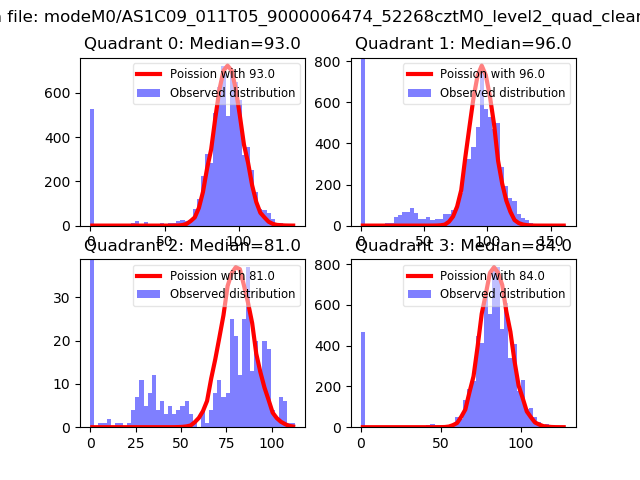 |
 |
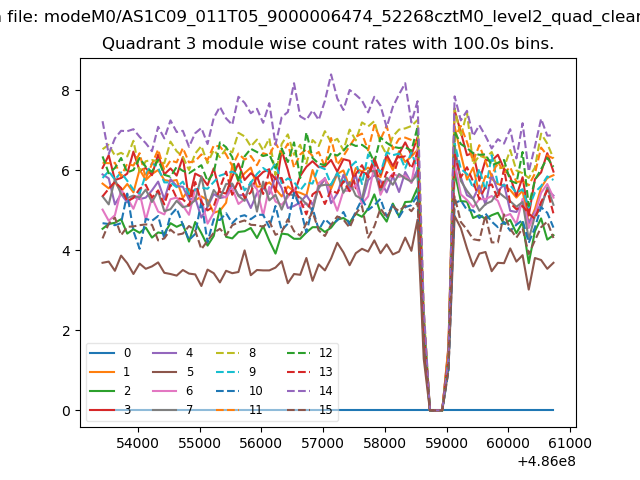
| Quadrant-wise count rates Data is divided into 100 sec bins |
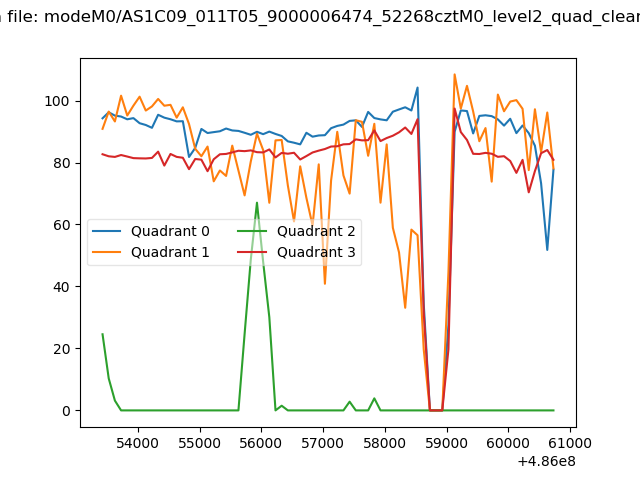 |
|
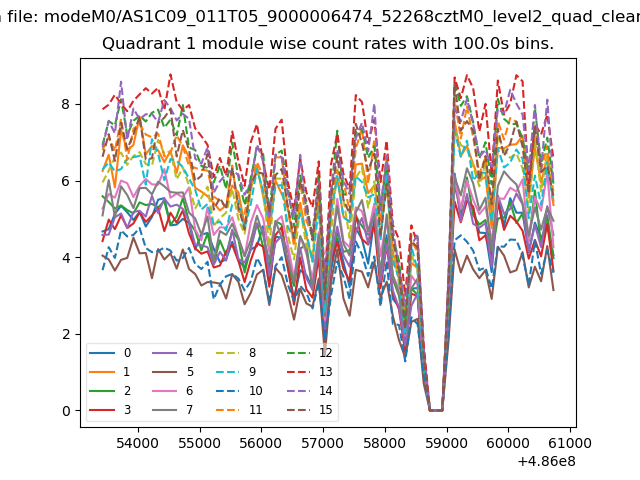
| Module-wise count rates for Quadrant A Data is divided into 100 sec bins |
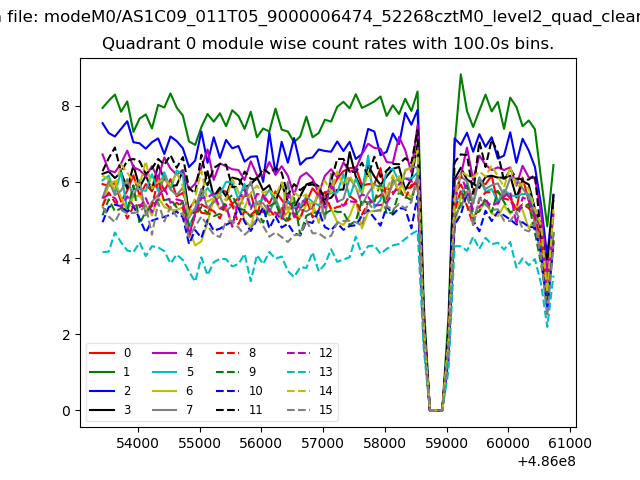 |
 |
| Module-wise count rates for Quadrant B Data is divided into 100 sec bins |
 |
 |
| Module-wise count rates for Quadrant C Data is divided into 100 sec bins |
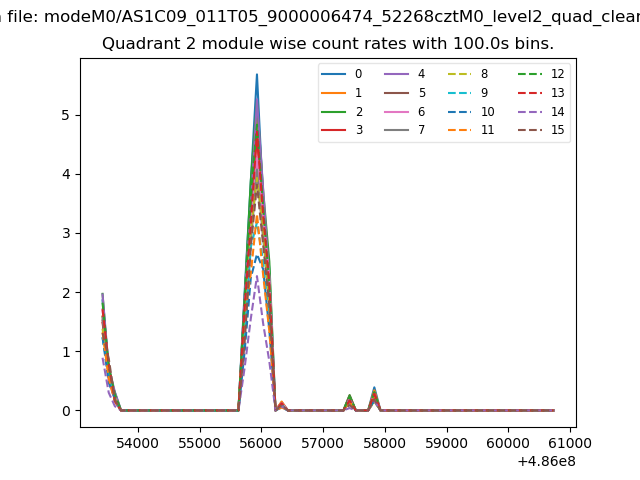 |
 |
| Module-wise count rates for Quadrant D Data is divided into 100 sec bins |
 |
 |
| Parameter | Plot |
|---|---|
| CZT HV Monitor | 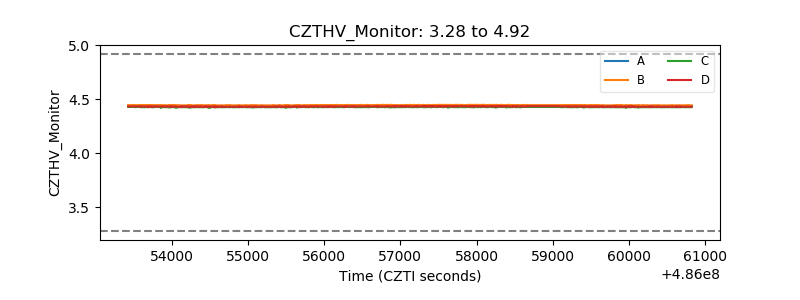 |
| D_VDD | 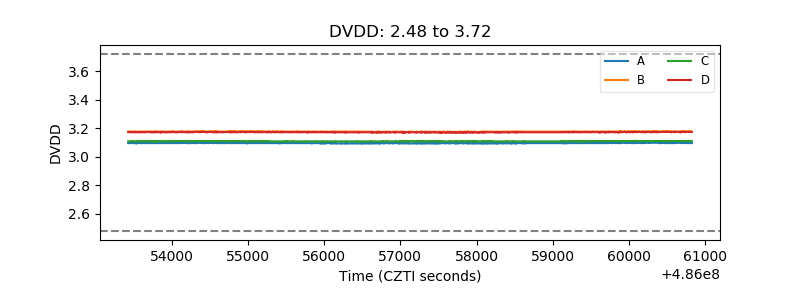 |
| Temperature 1 | 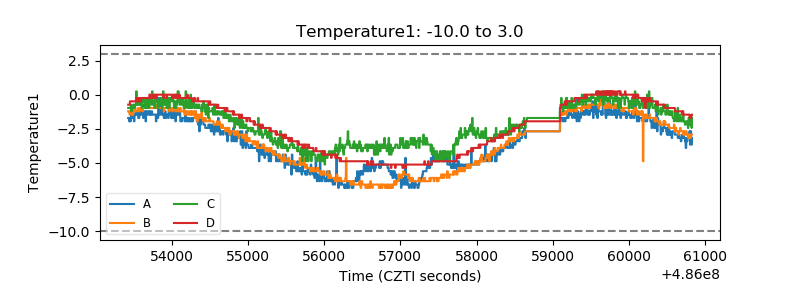 |
| Veto HV Monitor | 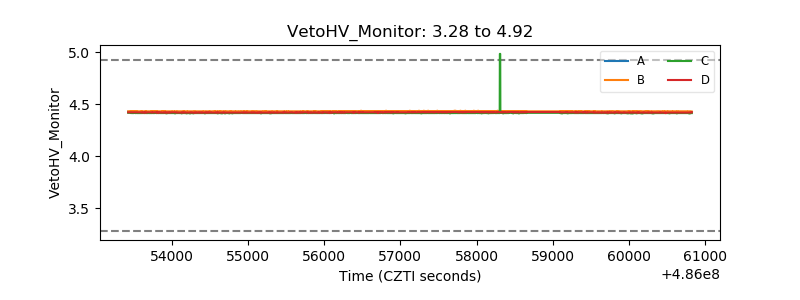 |
| Veto LLD | 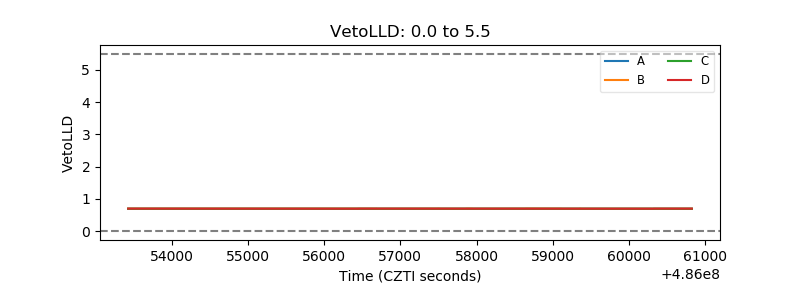 |
| Alpha Counter | 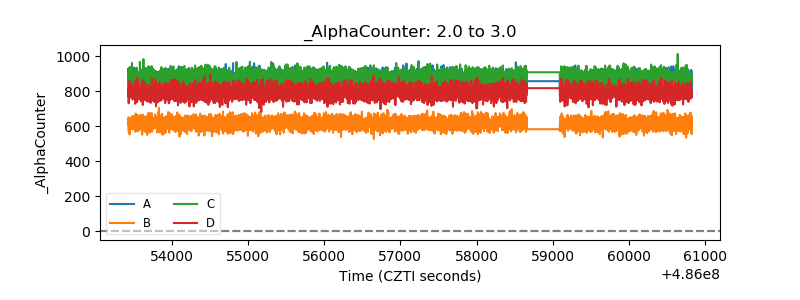 |
| _CPM_Rate | 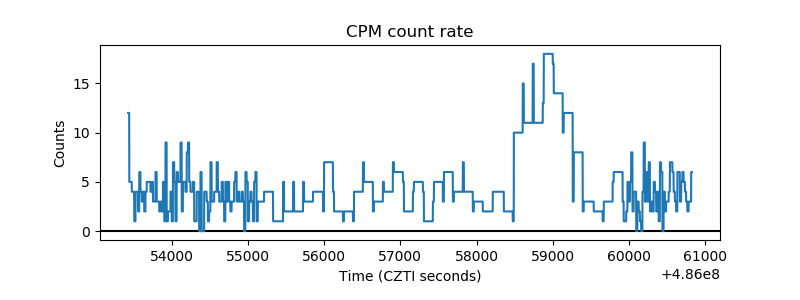 |
| CZT Counter | 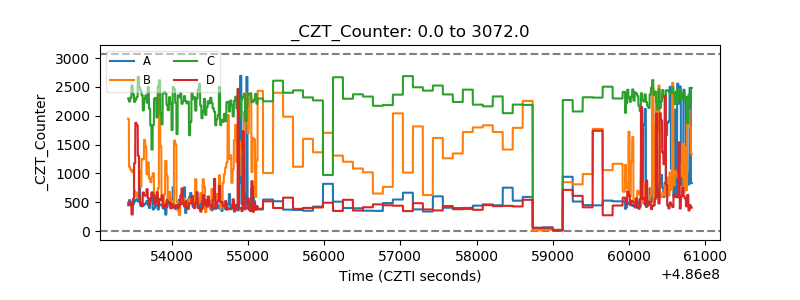 |
| +2.5 Volts monitor |  |
| +5 Volts monitor | 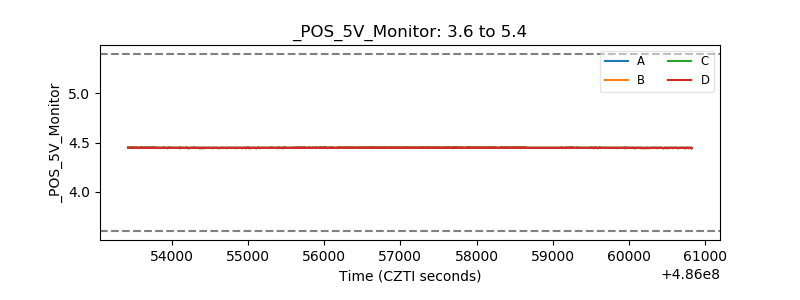 |
| _ROLL_ROT | 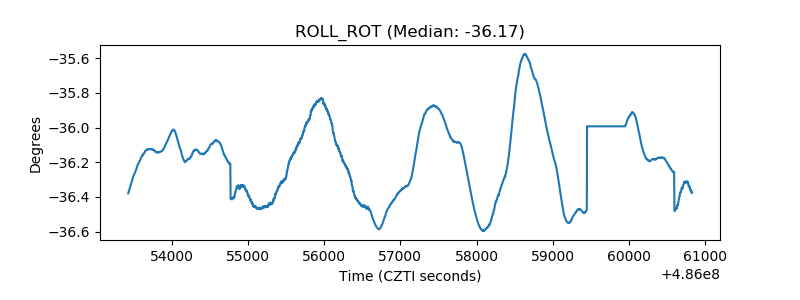 |
| _Roll_DEC | 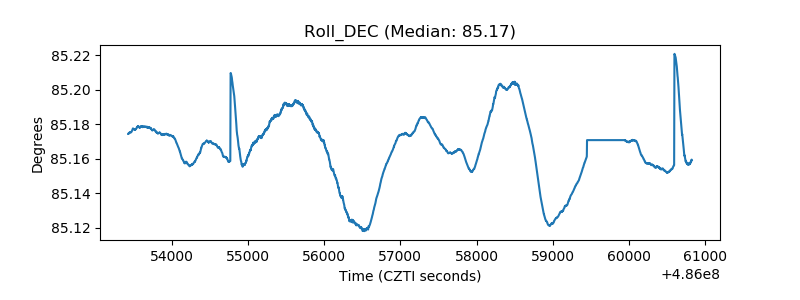 |
| _Roll_RA | 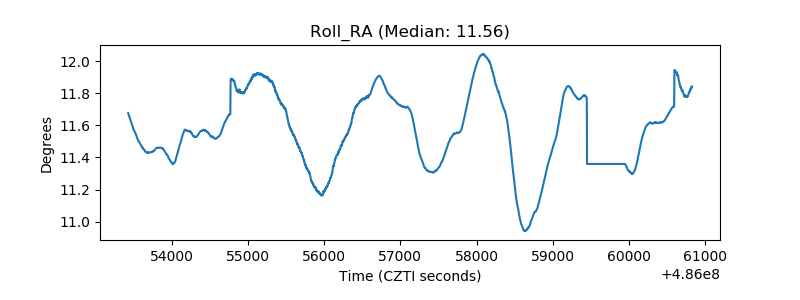 |
| Veto Counter | 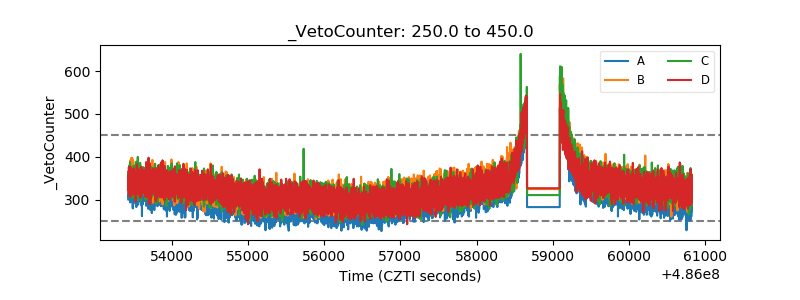 |