| Param | Original file | Final file |
|---|---|---|
| Filename | modeM0/AS1C09_011T05_9000006474_52269cztM0_level2.fits | modeM0/AS1C09_011T05_9000006474_52269cztM0_level2_quad_clean.evt |
| Size (bytes) | 833,402,880 | 81,011,520 |
| Size | 794.8 MB | 77.3 MB |
| Events in quadrant A | 4,579,471 | 636,985 |
| Events in quadrant B | 6,781,882 | 645,460 |
| Events in quadrant C | 14,732,746 | 95,124 |
| Events in quadrant D | 4,206,376 | 582,808 |
| Mode M0 | |||
|---|---|---|---|
| Quadrant | BADHDUFLAG | Total packets | Discarded packets |
| A | 0 | 18459 | 0 |
| B | 0 | 25028 | 0 |
| C | 0 | 48575 | 0 |
| D | 0 | 17483 | 0 |
| Mode SS | |||
|---|---|---|---|
| Quadrant | BADHDUFLAG | Total packets | Discarded packets |
| A | 0 | 140 | 0 |
| B | 0 | 140 | 0 |
| C | 0 | 140 | 0 |
| D | 0 | 140 | 0 |
| Quadrant | Total seconds | Saturated seconds | Saturation percentage |
|---|---|---|---|
| A | 7071 | 336 | 4.751803% |
| B | 7071 | 866 | 12.247207% |
| C | 7071 | 6167 | 87.215387% |
| D | 7071 | 162 | 2.291048% |
Noise dominated data is calculated using 1-second bins in cleaned event files. If a bin has >2000 counts, and if more than 50% of those come from <1% of pixels, then it is considered to be noise-dominated and hence unusable.
| Quadrant | # 1 sec bins | Bins with >0 counts | Bins with >2000 counts | High rate bins dominated by noise | Noise dominated (total time) | Noise dominated (detector-on time) | Marked lightcurve |
|---|---|---|---|---|---|---|---|
| A | 7071 | 7071 | 277 | 277 | 3.92% | 3.92% | 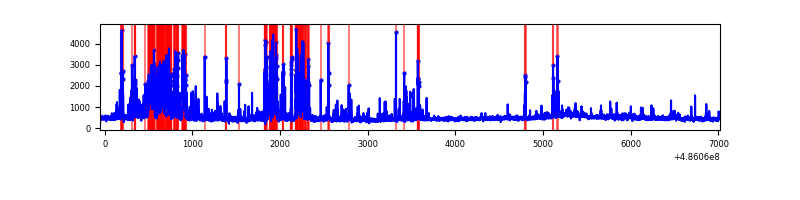 |
| B | 7071 | 7071 | 506 | 506 | 7.16% | 7.16% | 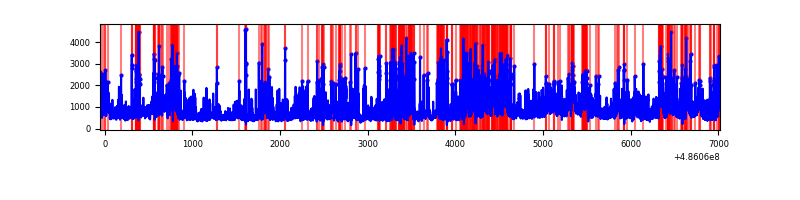 |
| C | 7071 | 7071 | 4596 | 4596 | 65.00% | 65.00% | 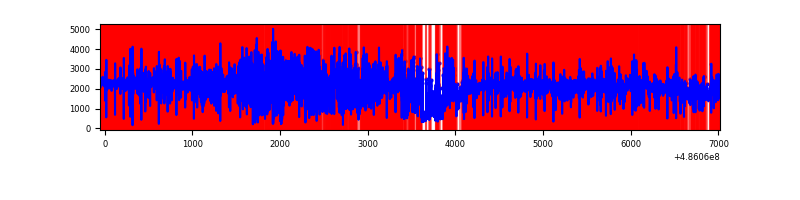 |
| D | 7071 | 7071 | 99 | 99 | 1.40% | 1.40% | 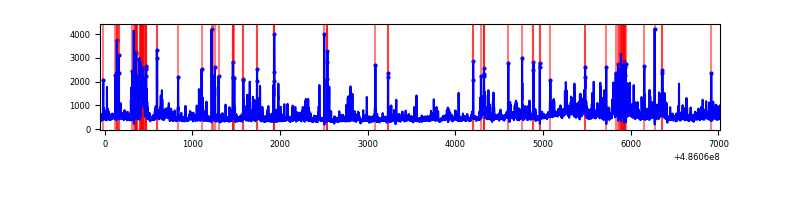 |
Top three noisy pixels from each quadrant. If the there are fewer than three noisy pixels in the level2.evt file, extra rows are filled as -1
| Pixel properties | Quadrant properties | ||||||
|---|---|---|---|---|---|---|---|
| Quadrant | DetID | PixID | Counts | Sigma | Mean | Median | Sigma |
| A | 4 | 249 | 1113715 | 6100.36 | 728 | 711 | 182.4 |
| A | 3 | 130 | 95129 | 517.5 | 728 | 711 | 182.4 |
| A | 3 | 7 | 90707 | 493.27 | 728 | 711 | 182.4 |
| B | 12 | 32 | 1049157 | 7012.04 | 701 | 675 | 149.5 |
| B | 4 | 171 | 635945 | 4248.56 | 701 | 675 | 149.5 |
| B | 5 | 32 | 586083 | 3915.09 | 701 | 675 | 149.5 |
| C | 15 | 158 | 8611087 | 108163.38 | 281 | 277 | 79.6 |
| C | 15 | 178 | 2043805 | 25669.47 | 281 | 277 | 79.6 |
| C | 15 | 224 | 1797286 | 22572.86 | 281 | 277 | 79.6 |
| D | 8 | 176 | 273284 | 1342.55 | 713 | 683 | 203.0 |
| D | 11 | 176 | 187316 | 919.16 | 713 | 683 | 203.0 |
| D | 7 | 60 | 161258 | 790.83 | 713 | 683 | 203.0 |
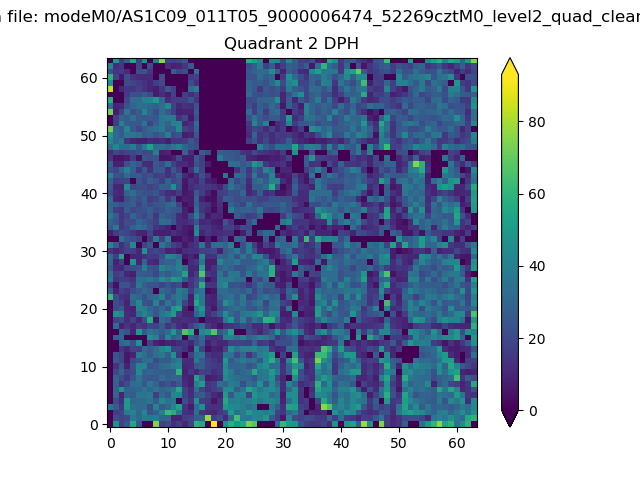
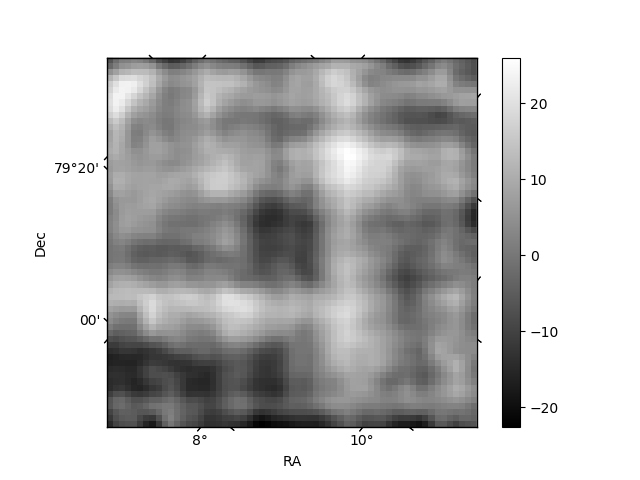
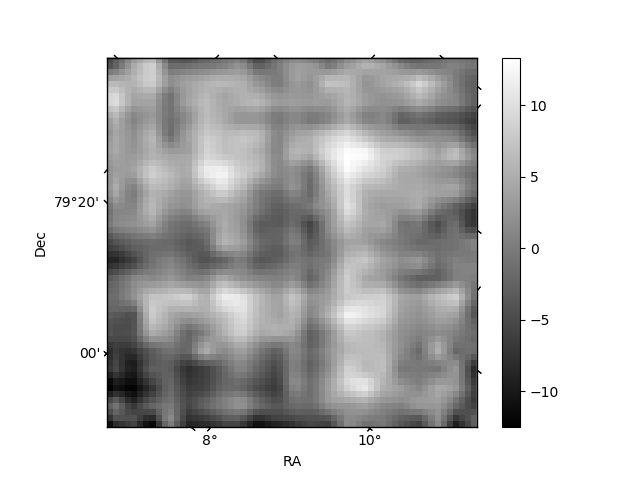
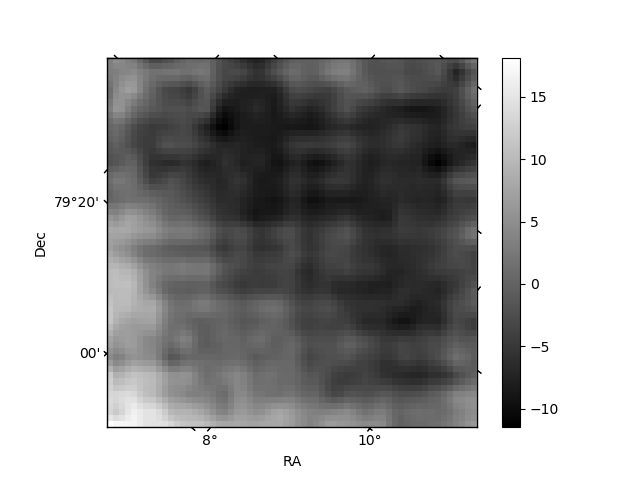
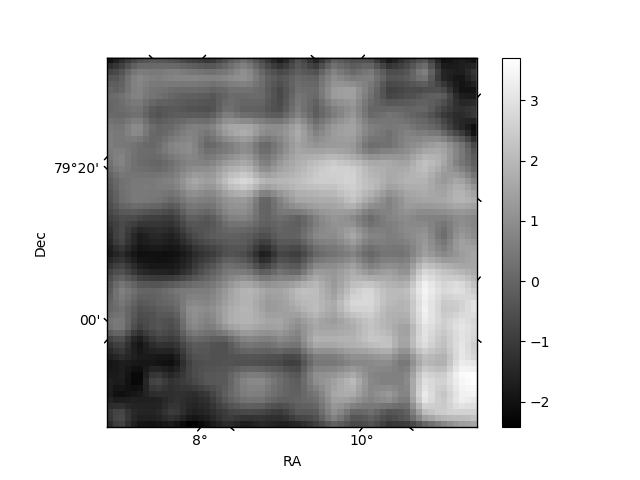
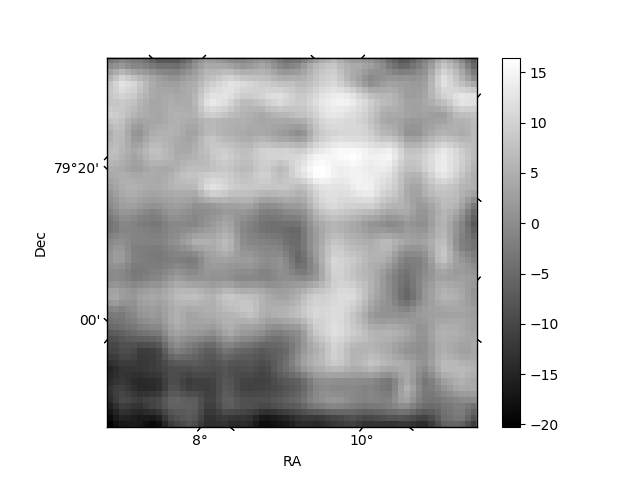
Histogram calculated using DETX and DETY for each event in the final _common_clean file
| Quadrant A | 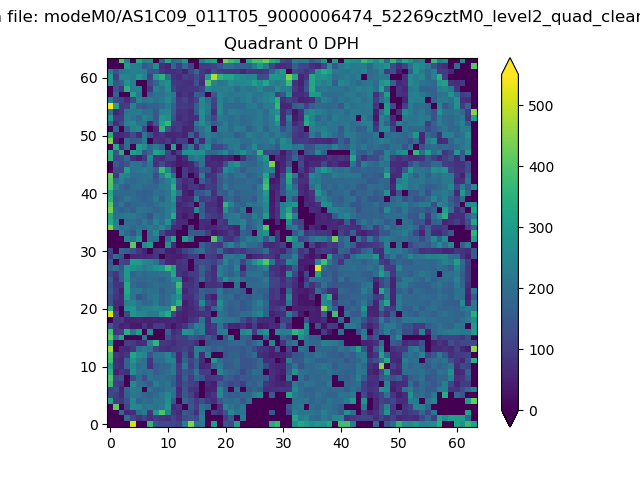 |
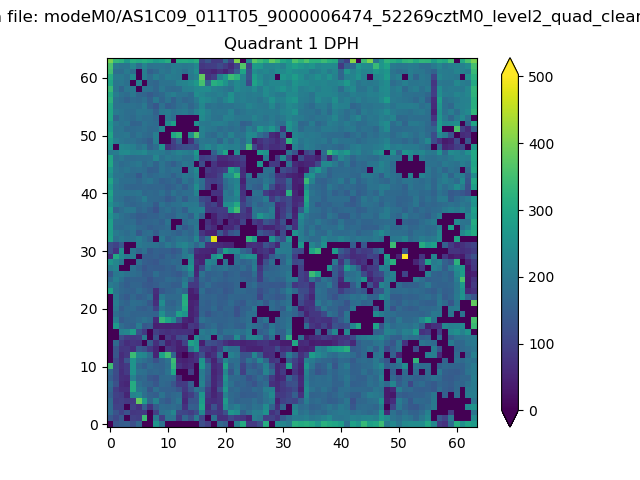 |
Quadrant B |
|---|---|---|---|
| Quadrant D | 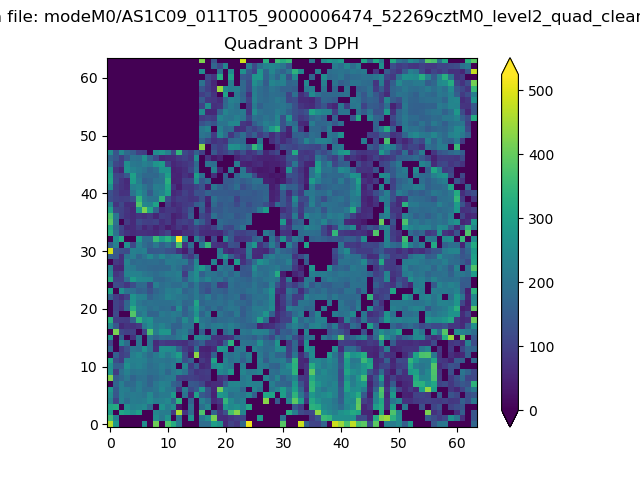 |
 |
Quadrant C |
| Plot type | Count rate plots | Images |
|---|---|---|
| Comparison with Poisson distribution Blue bars denote a histogram of data divided into 1 sec bins. Red curve is a Poisson curve with rate = median count rate of data. |
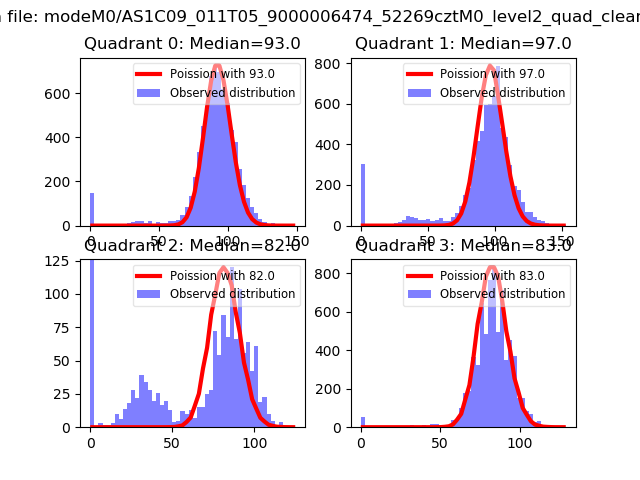 |
 |
| Quadrant-wise count rates Data is divided into 100 sec bins |
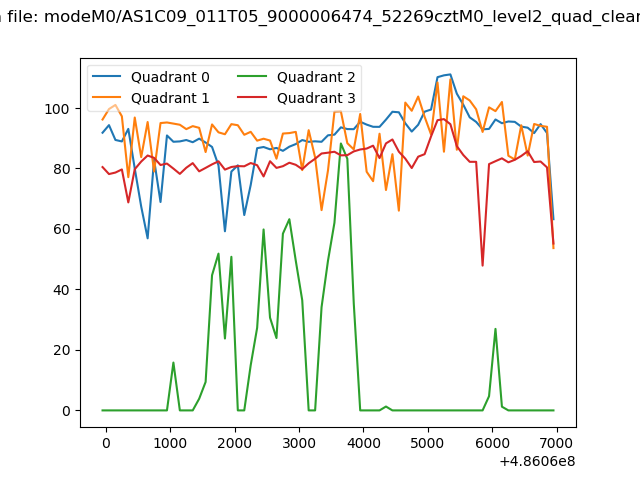 |
|
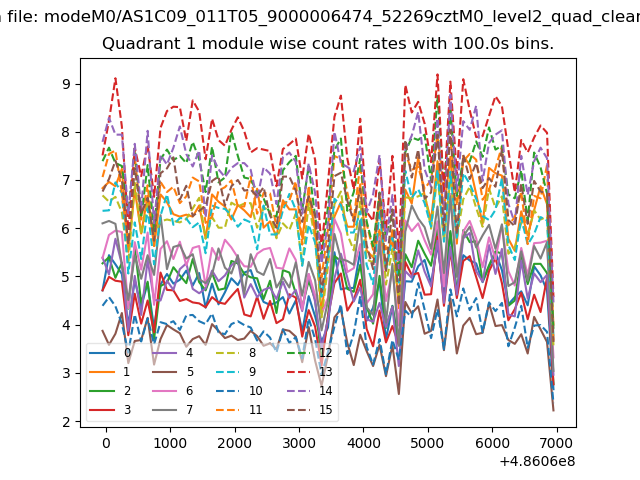
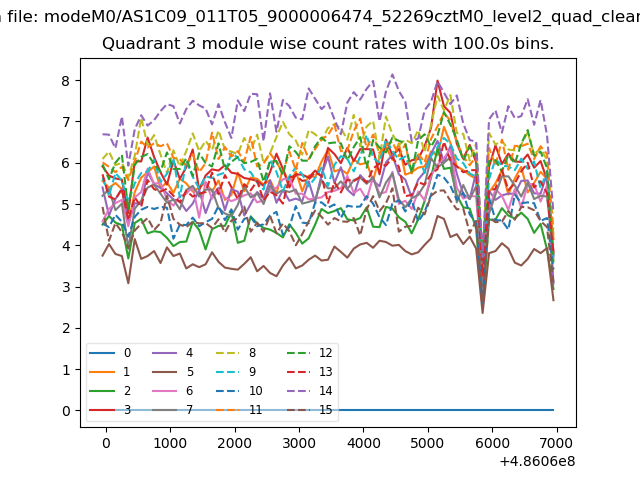
| Module-wise count rates for Quadrant A Data is divided into 100 sec bins |
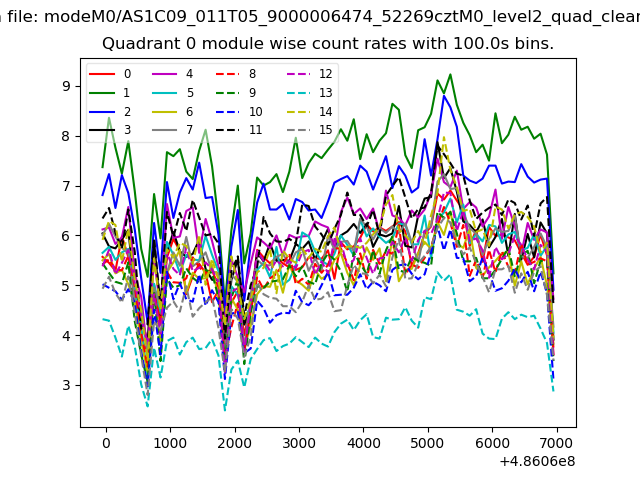 |
 |
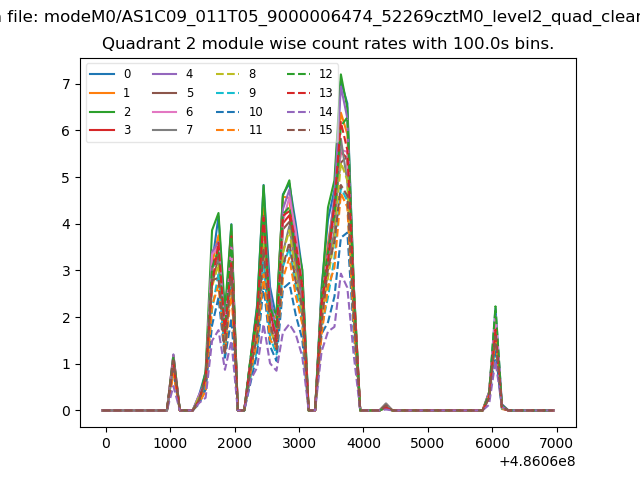
| Module-wise count rates for Quadrant B Data is divided into 100 sec bins |
 |
 |
| Module-wise count rates for Quadrant C Data is divided into 100 sec bins |
 |
 |
| Module-wise count rates for Quadrant D Data is divided into 100 sec bins |
 |
 |
| Parameter | Plot |
|---|---|
| CZT HV Monitor | 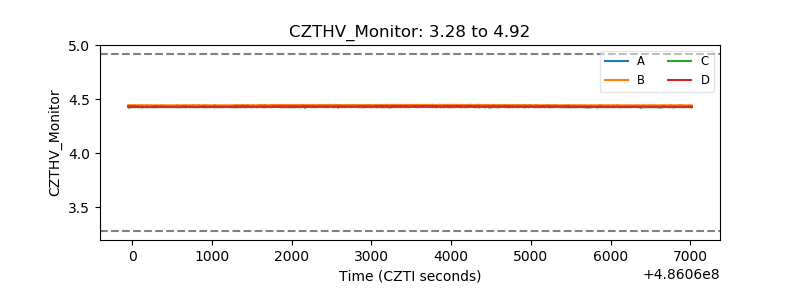 |
| D_VDD | 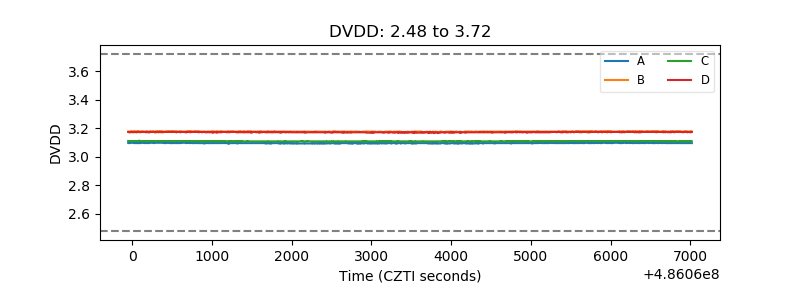 |
| Temperature 1 | 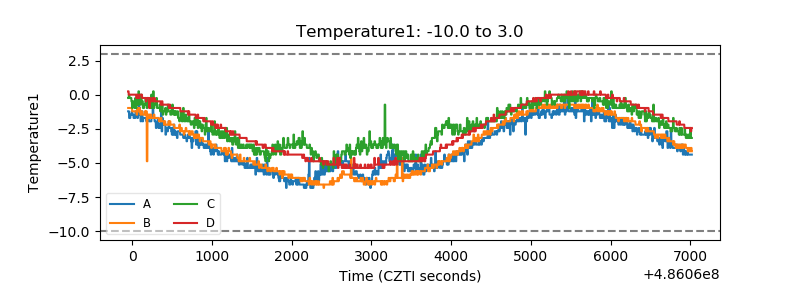 |
| Veto HV Monitor | 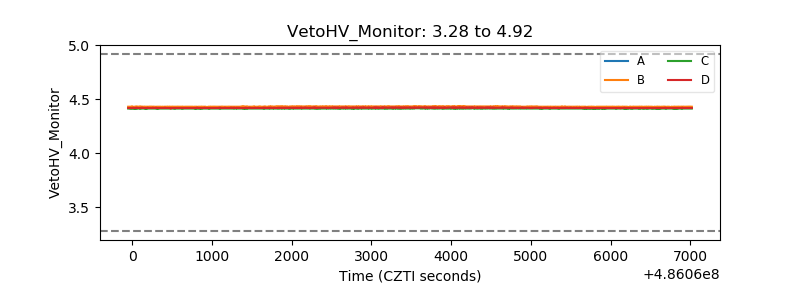 |
| Veto LLD | 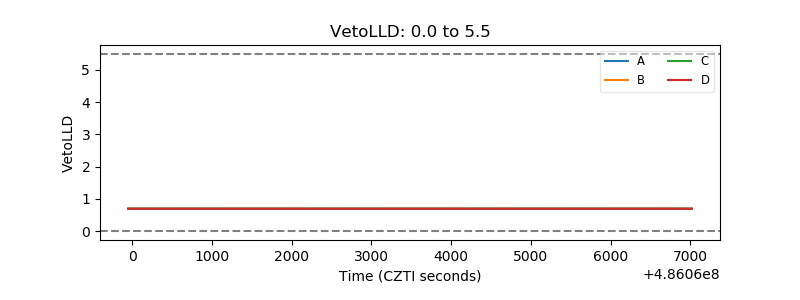 |
| Alpha Counter | 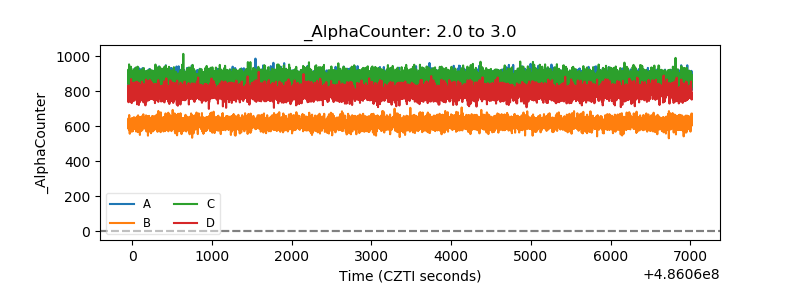 |
| _CPM_Rate | 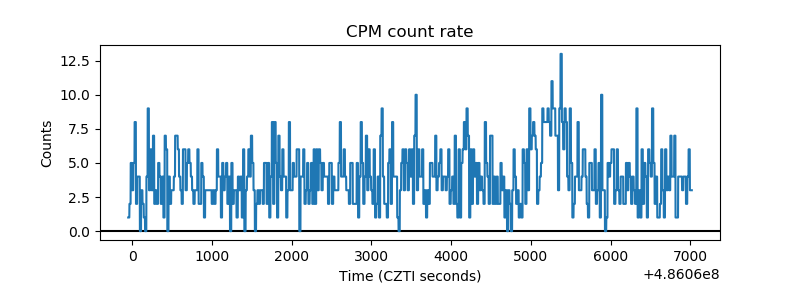 |
| CZT Counter | 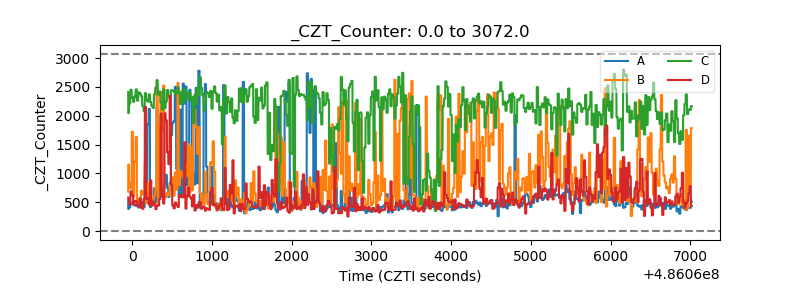 |
| +2.5 Volts monitor | 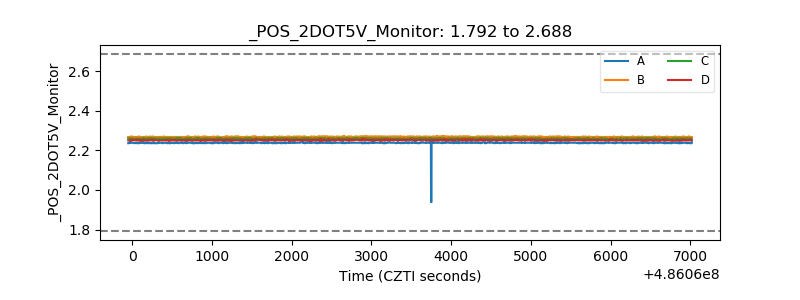 |
| +5 Volts monitor |  |
| _ROLL_ROT | 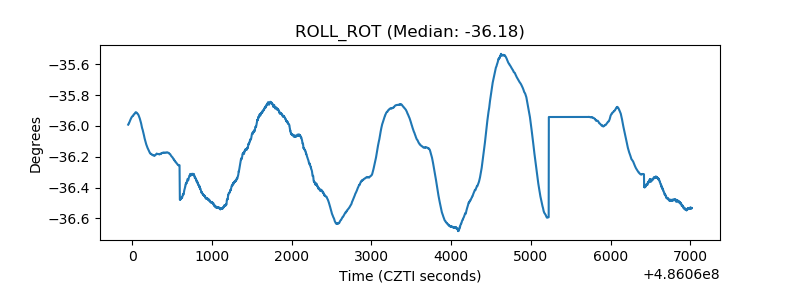 |
| _Roll_DEC | 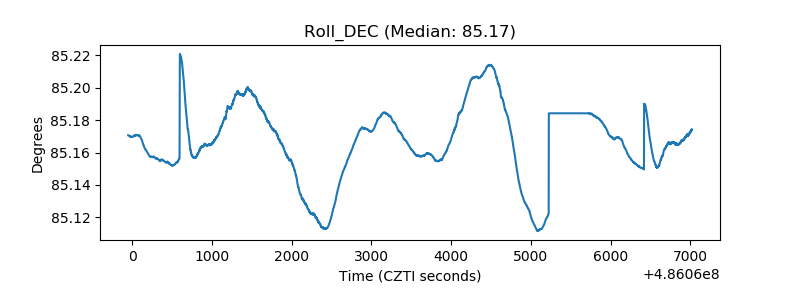 |
| _Roll_RA | 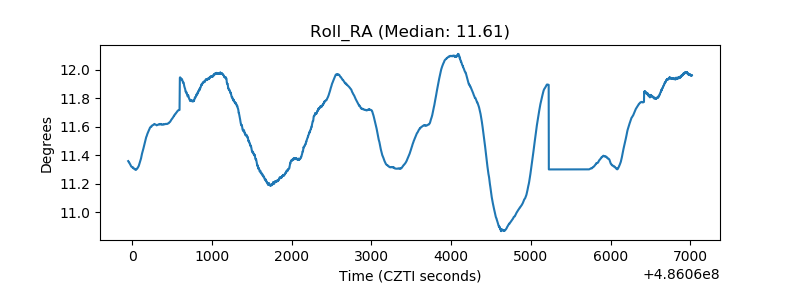 |
| Veto Counter | 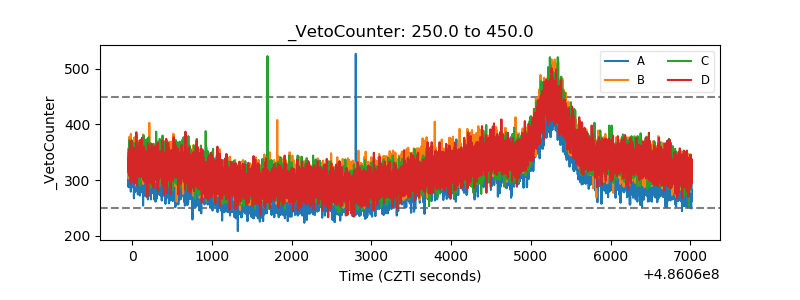 |