| Param | Original file | Final file |
|---|---|---|
| Filename | modeM0/AS1C09_011T05_9000006474_52270cztM0_level2.fits | modeM0/AS1C09_011T05_9000006474_52270cztM0_level2_quad_clean.evt |
| Size (bytes) | 889,660,800 | 86,307,840 |
| Size | 848.4 MB | 82.3 MB |
| Events in quadrant A | 4,036,895 | 692,782 |
| Events in quadrant B | 6,374,711 | 723,789 |
| Events in quadrant C | 15,565,954 | 81,058 |
| Events in quadrant D | 6,368,275 | 589,777 |
| Mode M0 | |||
|---|---|---|---|
| Quadrant | BADHDUFLAG | Total packets | Discarded packets |
| A | 0 | 17277 | 0 |
| B | 0 | 24132 | 0 |
| C | 0 | 51414 | 0 |
| D | 0 | 24264 | 2 |
| Mode SS | |||
|---|---|---|---|
| Quadrant | BADHDUFLAG | Total packets | Discarded packets |
| A | 0 | 150 | 0 |
| B | 0 | 150 | 0 |
| C | 0 | 150 | 0 |
| D | 0 | 150 | 0 |
| Quadrant | Total seconds | Saturated seconds | Saturation percentage |
|---|---|---|---|
| A | 7555 | 128 | 1.694242% |
| B | 7556 | 450 | 5.955532% |
| C | 7556 | 6740 | 89.200635% |
| D | 7555 | 638 | 8.444739% |
Noise dominated data is calculated using 1-second bins in cleaned event files. If a bin has >2000 counts, and if more than 50% of those come from <1% of pixels, then it is considered to be noise-dominated and hence unusable.
| Quadrant | # 1 sec bins | Bins with >0 counts | Bins with >2000 counts | High rate bins dominated by noise | Noise dominated (total time) | Noise dominated (detector-on time) | Marked lightcurve |
|---|---|---|---|---|---|---|---|
| A | 7555 | 7555 | 89 | 89 | 1.18% | 1.18% | 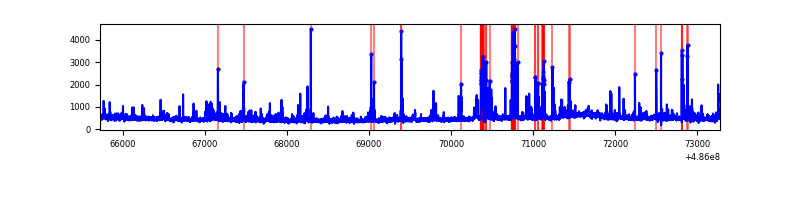 |
| B | 7556 | 7556 | 274 | 274 | 3.63% | 3.63% | 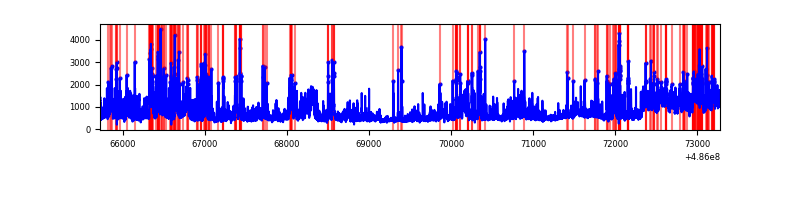 |
| C | 7556 | 7556 | 4721 | 4721 | 62.48% | 62.48% | 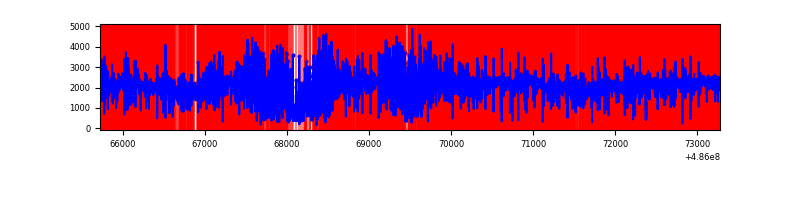 |
| D | 7555 | 7555 | 474 | 474 | 6.27% | 6.27% | 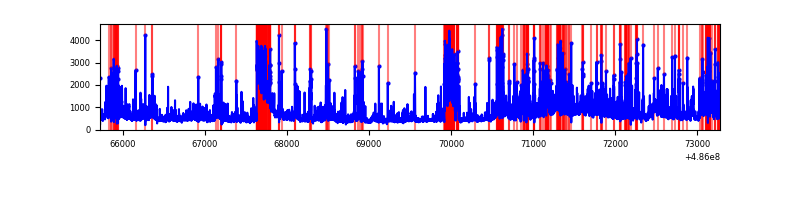 |
Top three noisy pixels from each quadrant. If the there are fewer than three noisy pixels in the level2.evt file, extra rows are filled as -1
| Pixel properties | Quadrant properties | ||||||
|---|---|---|---|---|---|---|---|
| Quadrant | DetID | PixID | Counts | Sigma | Mean | Median | Sigma |
| A | 15 | 174 | 201629 | 1020.77 | 786 | 766 | 196.8 |
| A | 4 | 249 | 148477 | 750.66 | 786 | 766 | 196.8 |
| A | 10 | 253 | 98766 | 498.03 | 786 | 766 | 196.8 |
| B | 7 | 0 | 680799 | 4171.25 | 769 | 741 | 163.0 |
| B | 10 | 254 | 658736 | 4035.92 | 769 | 741 | 163.0 |
| B | 4 | 171 | 580802 | 3557.9 | 769 | 741 | 163.0 |
| C | 15 | 158 | 7515700 | 94393.81 | 283 | 281 | 79.6 |
| C | 15 | 178 | 3608933 | 45324.74 | 283 | 281 | 79.6 |
| C | 15 | 224 | 2113010 | 26535.92 | 283 | 281 | 79.6 |
| D | 15 | 78 | 885113 | 4173.99 | 747 | 714 | 211.9 |
| D | 12 | 18 | 595260 | 2806.01 | 747 | 714 | 211.9 |
| D | 8 | 176 | 320761 | 1510.49 | 747 | 714 | 211.9 |
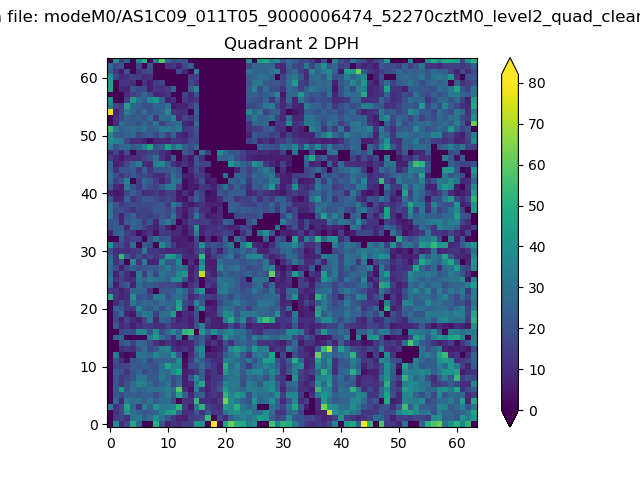
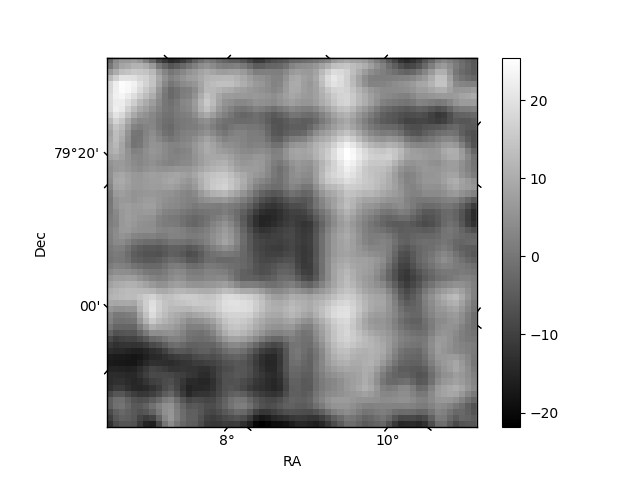
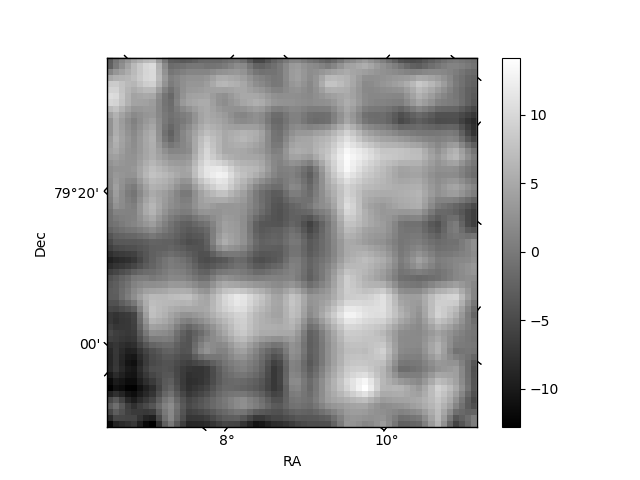
Histogram calculated using DETX and DETY for each event in the final _common_clean file
| Quadrant A | 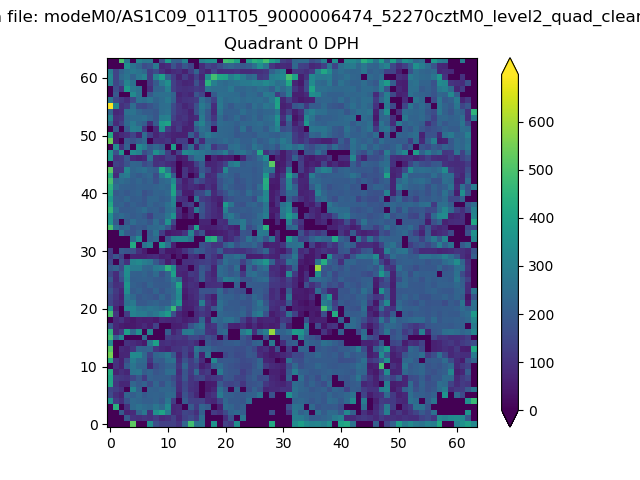 |
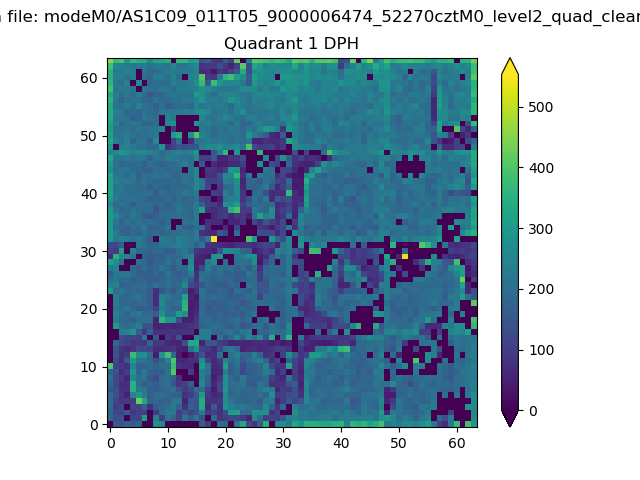 |
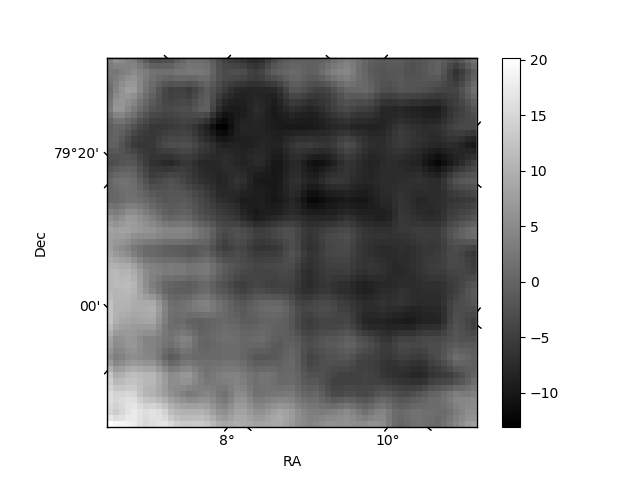
Quadrant B |
|---|---|---|---|
| Quadrant D | 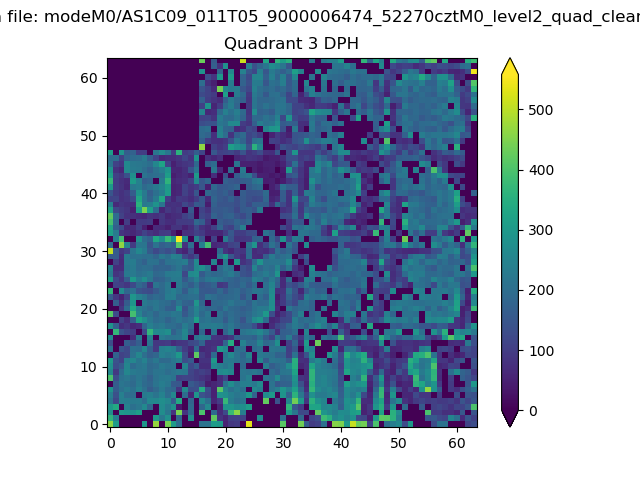 |
 |
Quadrant C |
| Plot type | Count rate plots | Images |
|---|---|---|
| Comparison with Poisson distribution Blue bars denote a histogram of data divided into 1 sec bins. Red curve is a Poisson curve with rate = median count rate of data. |
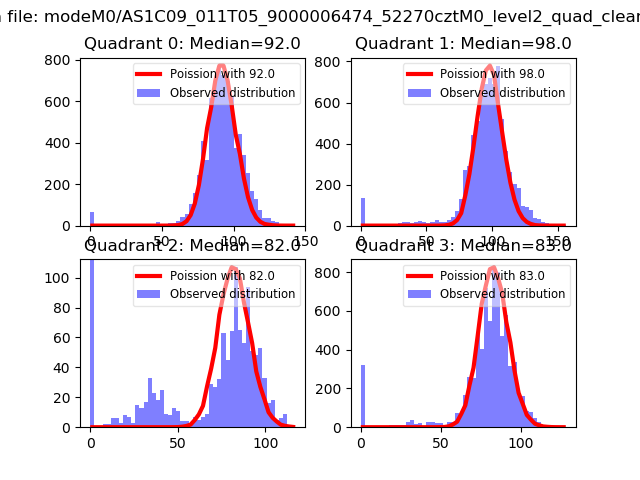 |
 |
| Quadrant-wise count rates Data is divided into 100 sec bins |
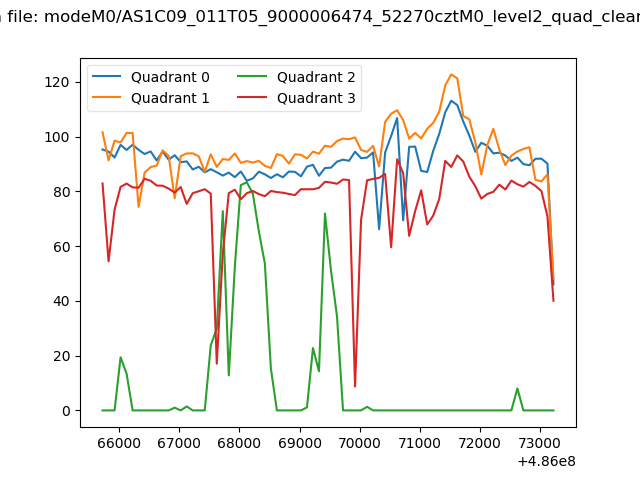 |
|
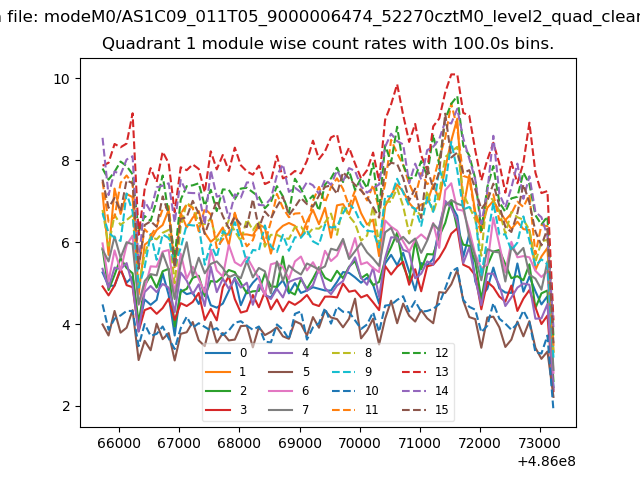
| Module-wise count rates for Quadrant A Data is divided into 100 sec bins |
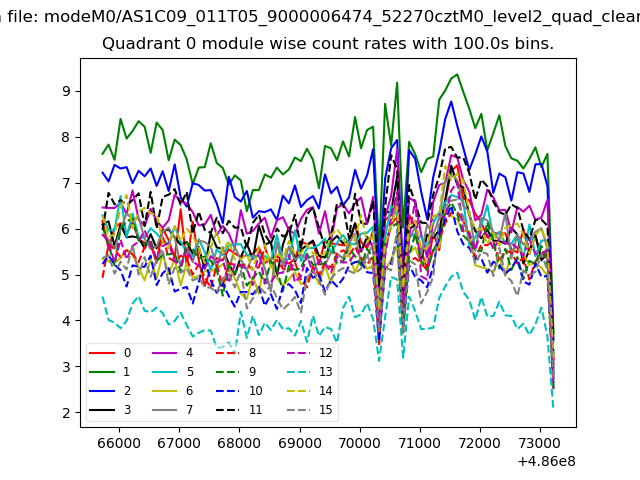 |
 |
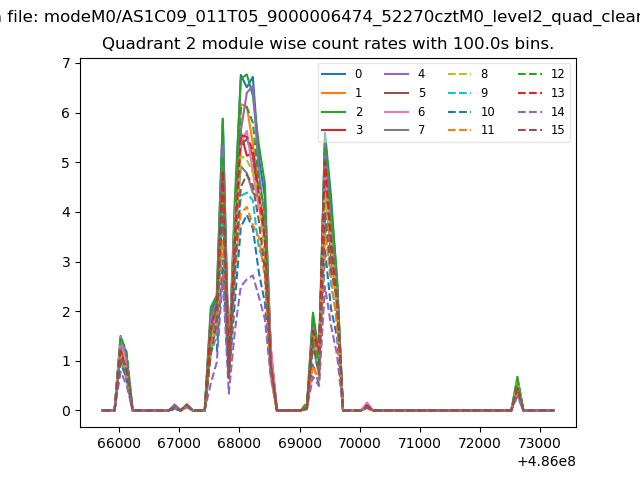
| Module-wise count rates for Quadrant B Data is divided into 100 sec bins |
 |
 |
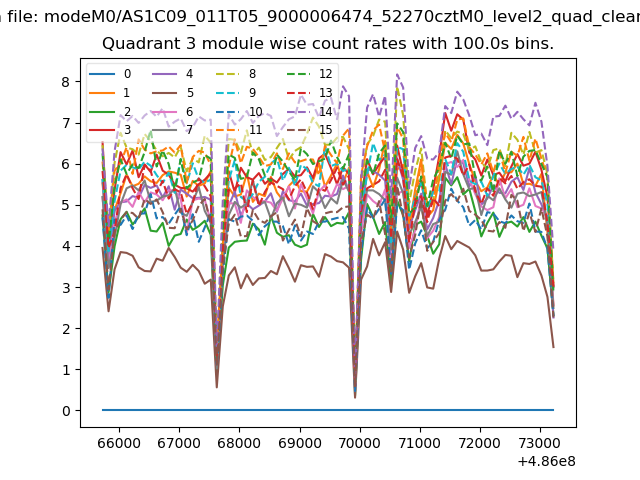
| Module-wise count rates for Quadrant C Data is divided into 100 sec bins |
 |
 |
| Module-wise count rates for Quadrant D Data is divided into 100 sec bins |
 |
 |
| Parameter | Plot |
|---|---|
| CZT HV Monitor | 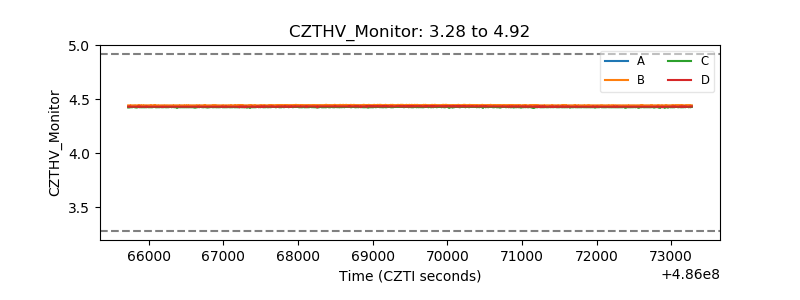 |
| D_VDD | 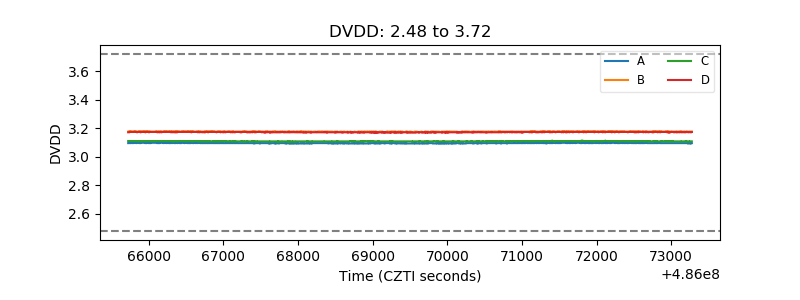 |
| Temperature 1 | 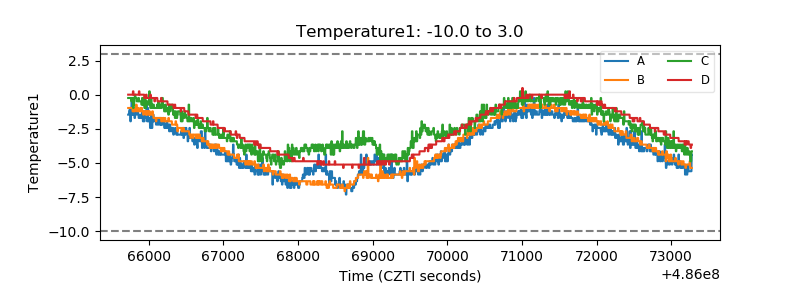 |
| Veto HV Monitor | 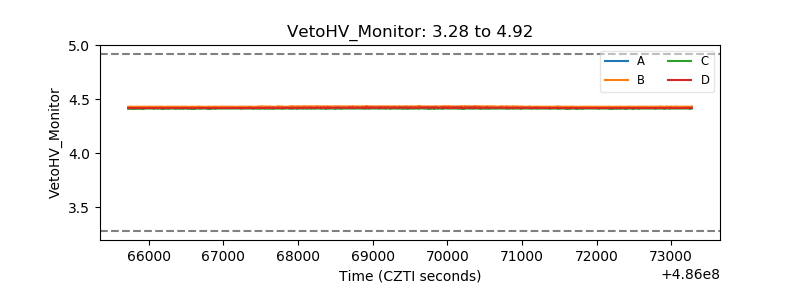 |
| Veto LLD | 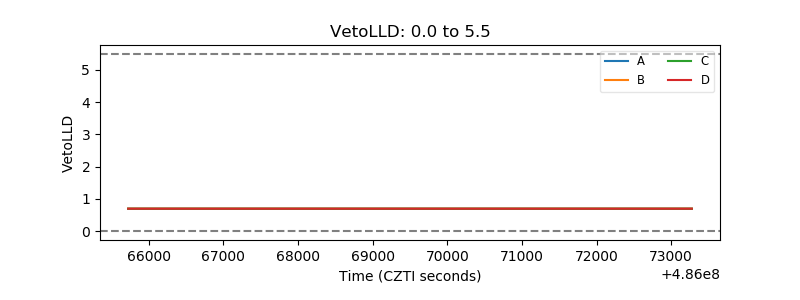 |
| Alpha Counter | 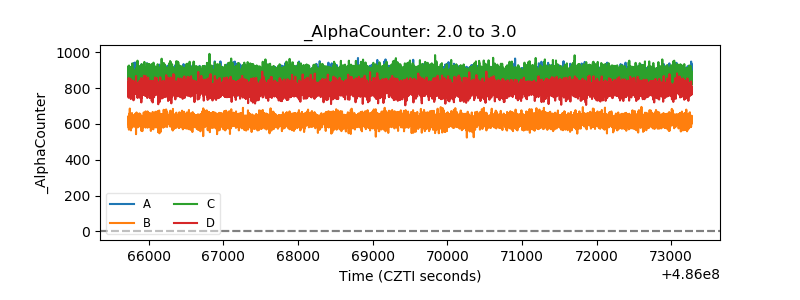 |
| _CPM_Rate | 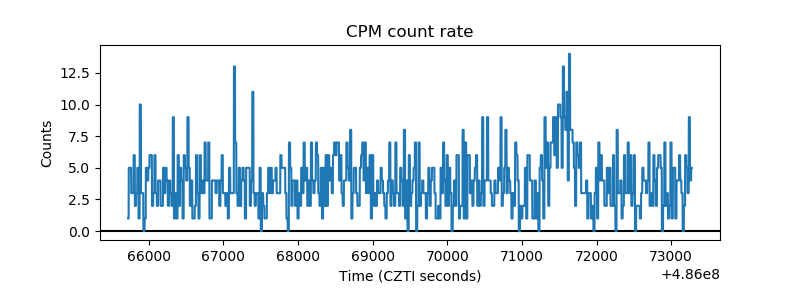 |
| CZT Counter | 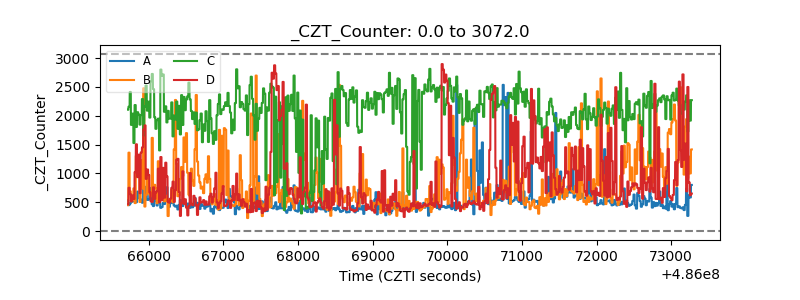 |
| +2.5 Volts monitor | 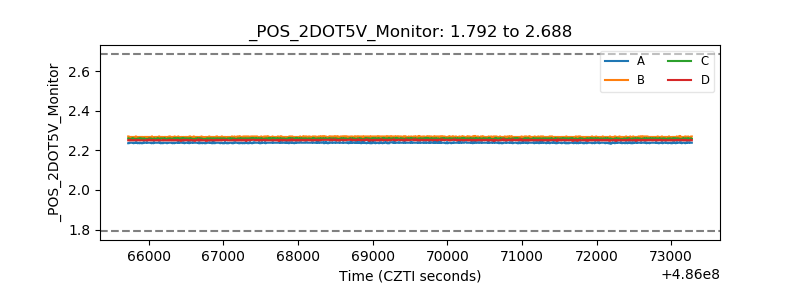 |
| +5 Volts monitor |  |
| _ROLL_ROT | 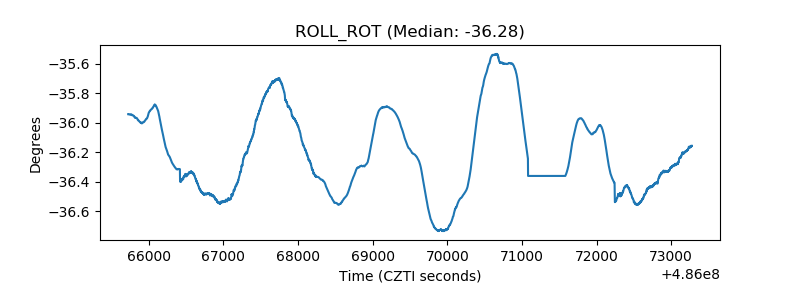 |
| _Roll_DEC | 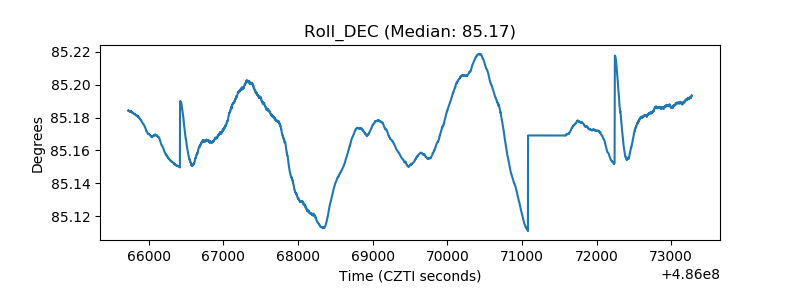 |
| _Roll_RA | 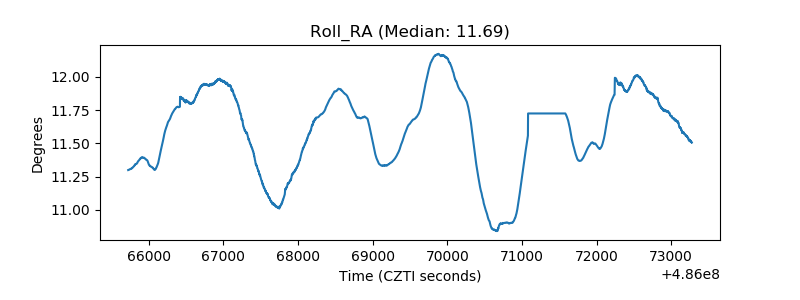 |
| Veto Counter | 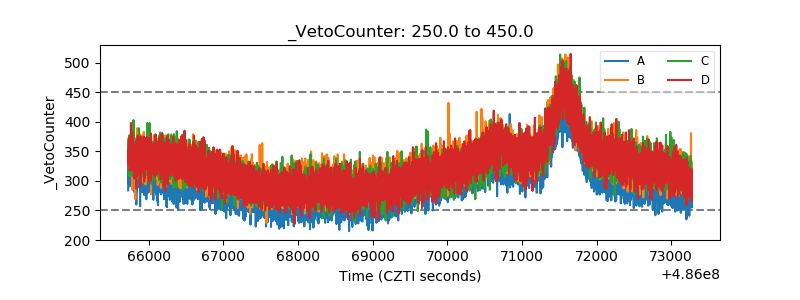 |