| Param | Original file | Final file |
|---|---|---|
| Filename | modeM0/AS1C09_011T05_9000006474_52274cztM0_level2.fits | modeM0/AS1C09_011T05_9000006474_52274cztM0_level2_quad_clean.evt |
| Size (bytes) | 1,267,050,240 | 91,512,000 |
| Size | 1.2 GB | 87.3 MB |
| Events in quadrant A | 4,526,171 | 818,187 |
| Events in quadrant B | 9,253,019 | 829,301 |
| Events in quadrant C | 19,375,431 | 27,537 |
| Events in quadrant D | 13,071,833 | 488,542 |
| Mode M0 | |||
|---|---|---|---|
| Quadrant | BADHDUFLAG | Total packets | Discarded packets |
| A | 0 | 19666 | 2 |
| B | 0 | 33610 | 2 |
| C | 0 | 63560 | 4 |
| D | 0 | 44948 | 2 |
| Mode SS | |||
|---|---|---|---|
| Quadrant | BADHDUFLAG | Total packets | Discarded packets |
| A | 0 | 178 | 0 |
| B | 0 | 178 | 0 |
| C | 0 | 178 | 0 |
| D | 0 | 178 | 0 |
| Mode M9 | |||
|---|---|---|---|
| Quadrant | BADHDUFLAG | Total packets | Discarded packets |
| A | 0 | 15 | 0 |
| B | 0 | 15 | 0 |
| C | 0 | 15 | 0 |
| D | 0 | 15 | 0 |
| Quadrant | Total seconds | Saturated seconds | Saturation percentage |
|---|---|---|---|
| A | 8740 | 55 | 0.629291% |
| B | 8740 | 794 | 9.084668% |
| C | 8740 | 8509 | 97.356979% |
| D | 8740 | 3255 | 37.242563% |
Noise dominated data is calculated using 1-second bins in cleaned event files. If a bin has >2000 counts, and if more than 50% of those come from <1% of pixels, then it is considered to be noise-dominated and hence unusable.
| Quadrant | # 1 sec bins | Bins with >0 counts | Bins with >2000 counts | High rate bins dominated by noise | Noise dominated (total time) | Noise dominated (detector-on time) | Marked lightcurve |
|---|---|---|---|---|---|---|---|
| A | 10220 | 8742 | 36 | 36 | 0.35% | 0.41% | 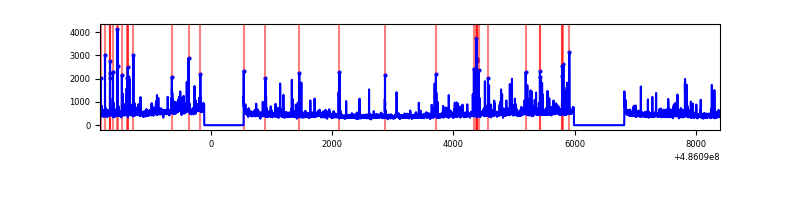 |
| B | 10220 | 8742 | 527 | 527 | 5.16% | 6.03% | 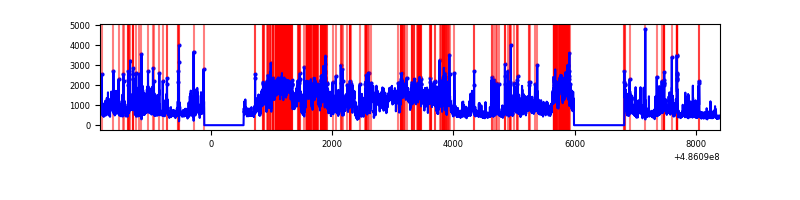 |
| C | 10220 | 8740 | 6586 | 6586 | 64.44% | 75.35% | 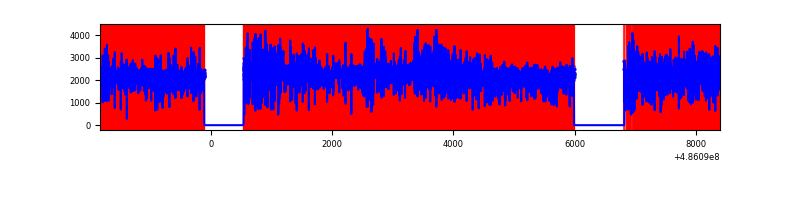 |
| D | 10220 | 8741 | 2346 | 2346 | 22.95% | 26.84% | 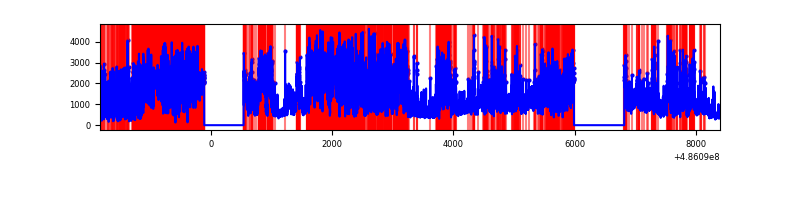 |
Top three noisy pixels from each quadrant. If the there are fewer than three noisy pixels in the level2.evt file, extra rows are filled as -1
| Pixel properties | Quadrant properties | ||||||
|---|---|---|---|---|---|---|---|
| Quadrant | DetID | PixID | Counts | Sigma | Mean | Median | Sigma |
| A | 11 | 3 | 170404 | 742.88 | 926 | 904 | 228.2 |
| A | 5 | 240 | 127224 | 553.63 | 926 | 904 | 228.2 |
| A | 10 | 253 | 106405 | 462.38 | 926 | 904 | 228.2 |
| B | 10 | 254 | 3864117 | 20325.61 | 898 | 867 | 190.1 |
| B | 4 | 171 | 526626 | 2766.16 | 898 | 867 | 190.1 |
| B | 4 | 81 | 263607 | 1382.35 | 898 | 867 | 190.1 |
| C | 15 | 178 | 9324086 | 116621.87 | 284 | 282 | 79.9 |
| C | 15 | 158 | 6215109 | 77734.88 | 284 | 282 | 79.9 |
| C | 15 | 224 | 1691599 | 21154.94 | 284 | 282 | 79.9 |
| D | 12 | 18 | 3703062 | 17952.37 | 716 | 681 | 206.2 |
| D | 15 | 93 | 2729584 | 13232.1 | 716 | 681 | 206.2 |
| D | 7 | 60 | 2092180 | 10141.41 | 716 | 681 | 206.2 |
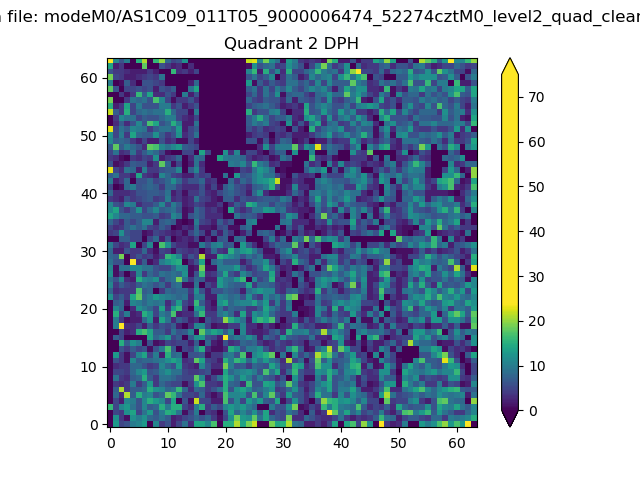
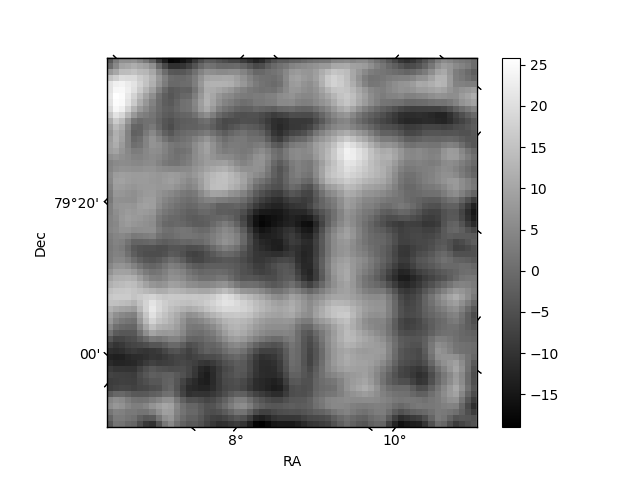
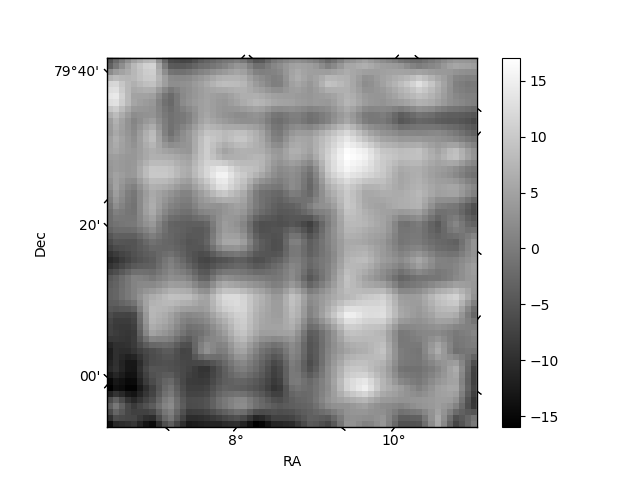
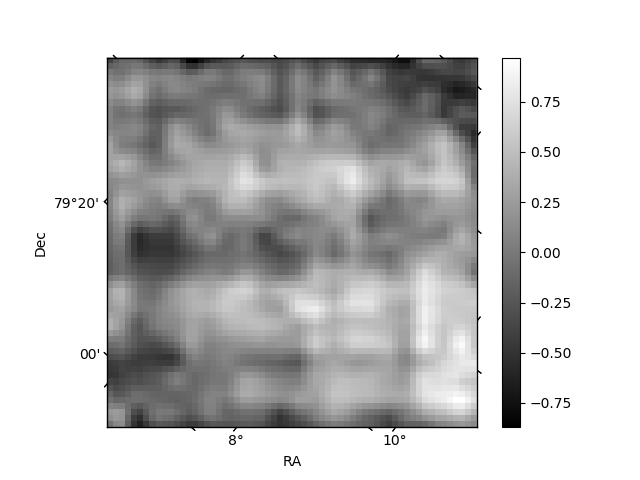
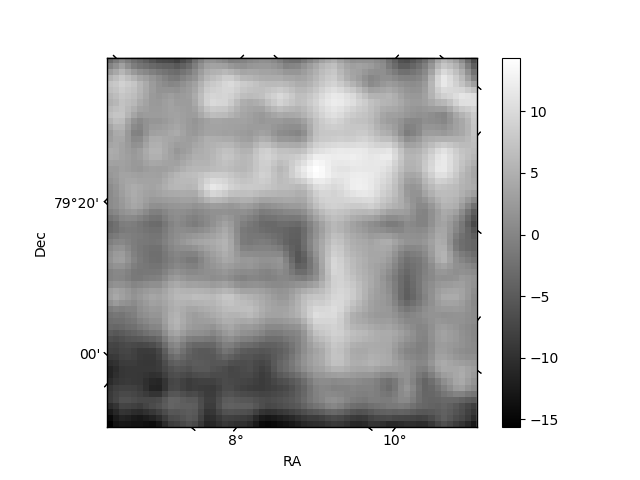
Histogram calculated using DETX and DETY for each event in the final _common_clean file
| Quadrant A | 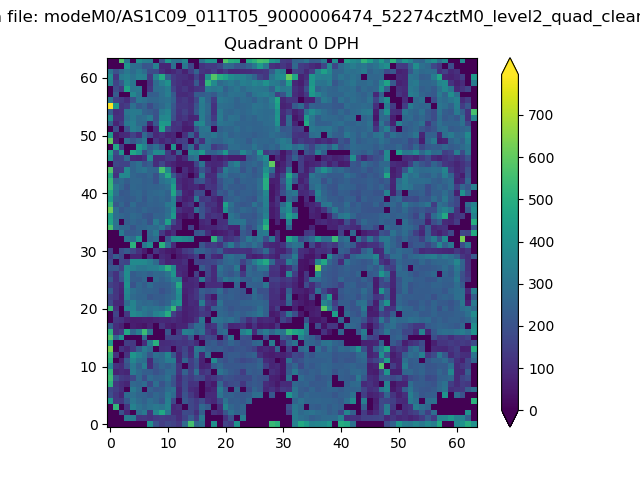 |
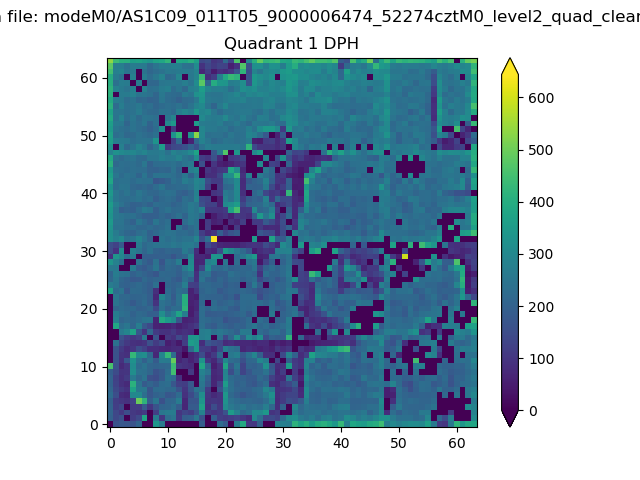 |
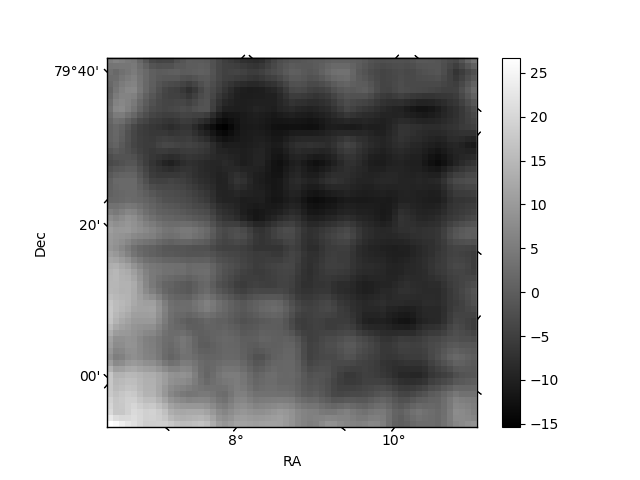
Quadrant B |
|---|---|---|---|
| Quadrant D | 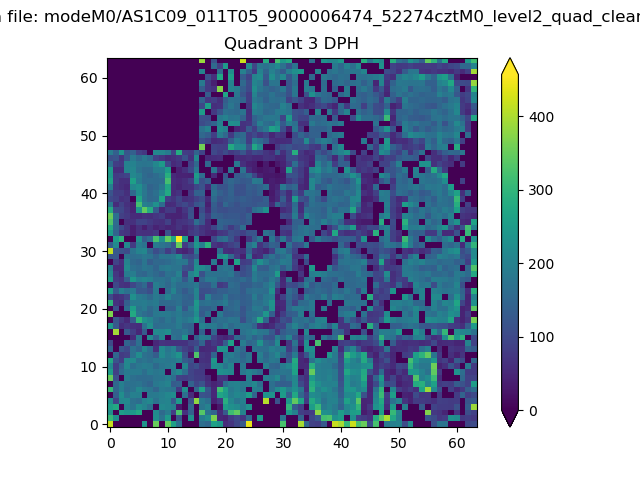 |
 |
Quadrant C |
| Plot type | Count rate plots | Images |
|---|---|---|
| Comparison with Poisson distribution Blue bars denote a histogram of data divided into 1 sec bins. Red curve is a Poisson curve with rate = median count rate of data. |
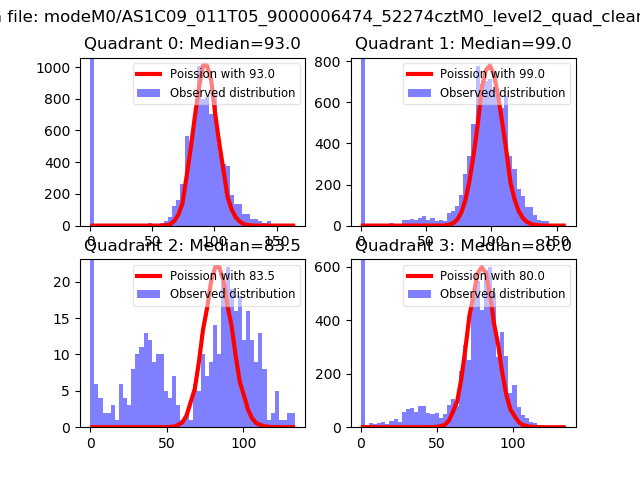 |
 |
| Quadrant-wise count rates Data is divided into 100 sec bins |
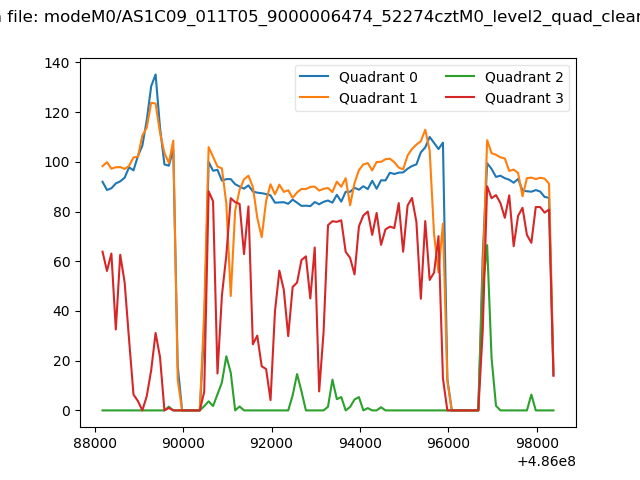 |
|
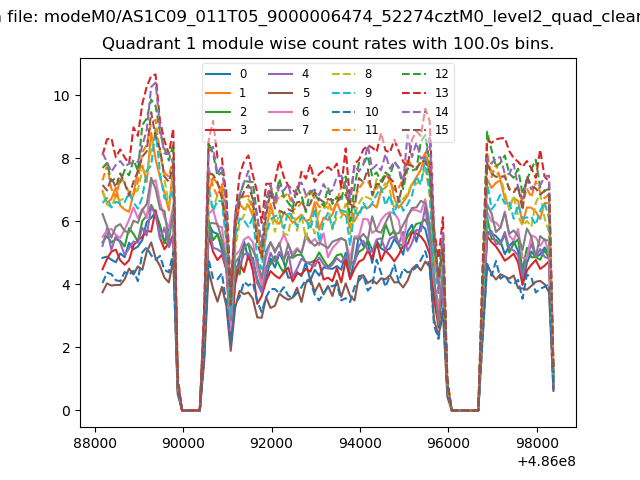
| Module-wise count rates for Quadrant A Data is divided into 100 sec bins |
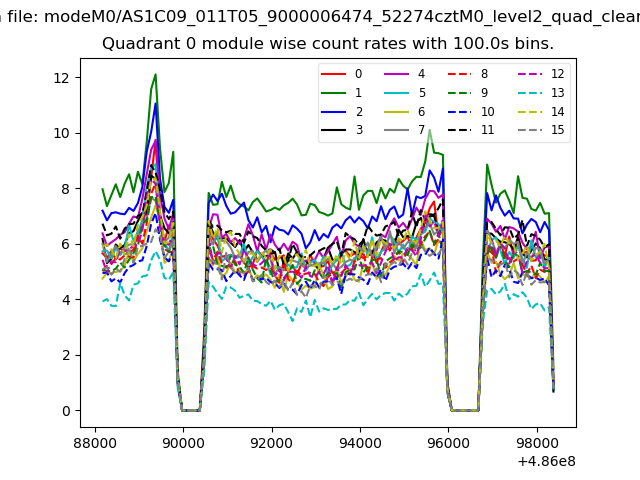 |
 |
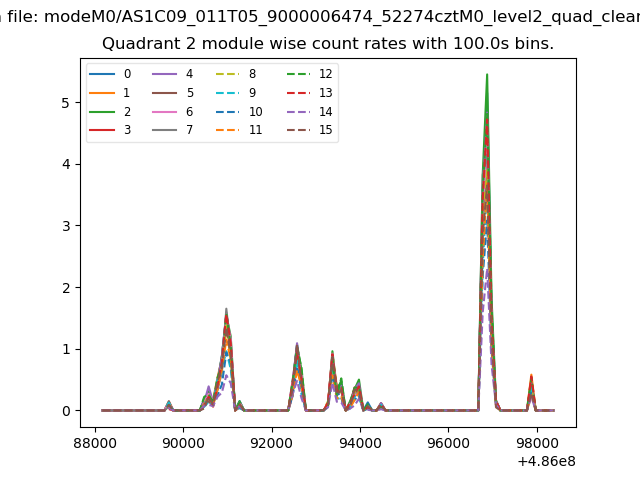
| Module-wise count rates for Quadrant B Data is divided into 100 sec bins |
 |
 |
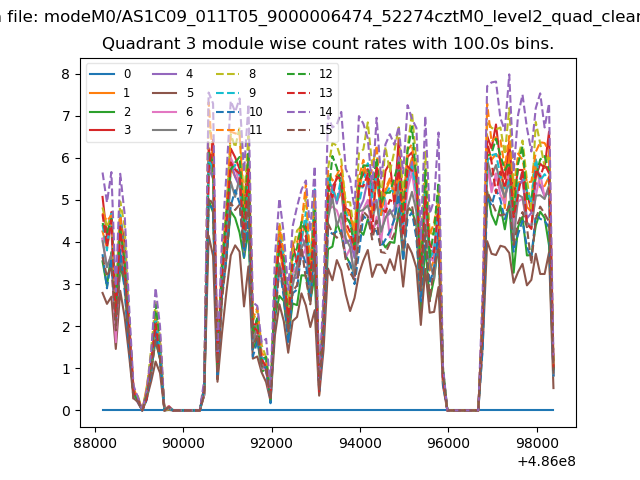
| Module-wise count rates for Quadrant C Data is divided into 100 sec bins |
 |
 |
| Module-wise count rates for Quadrant D Data is divided into 100 sec bins |
 |
 |
| Parameter | Plot |
|---|---|
| CZT HV Monitor | 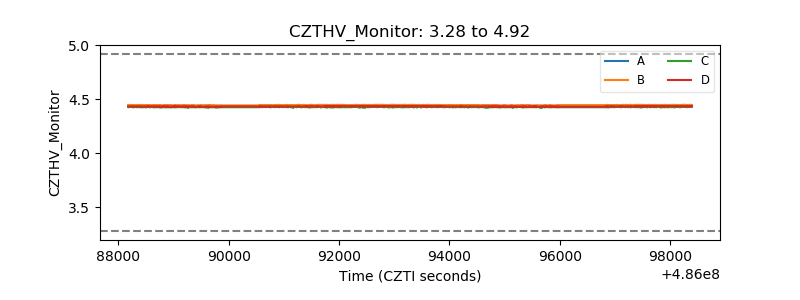 |
| D_VDD | 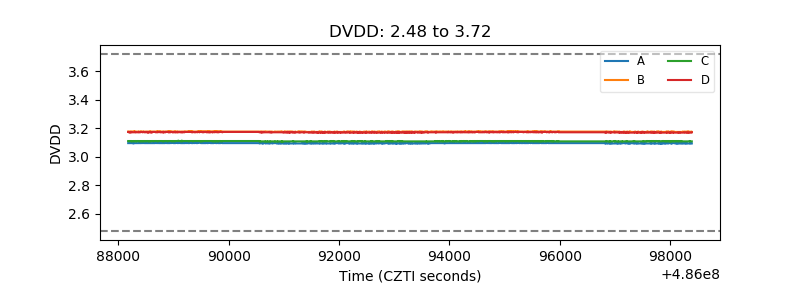 |
| Temperature 1 | 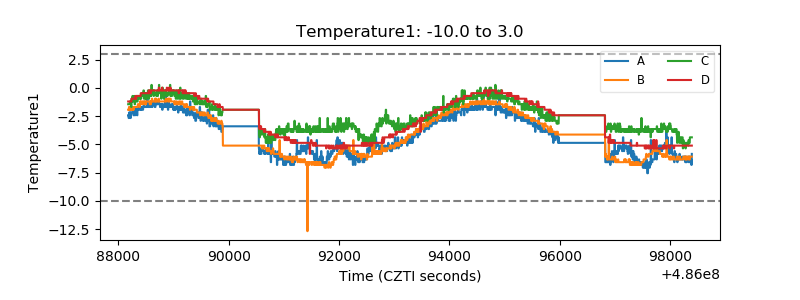 |
| Veto HV Monitor | 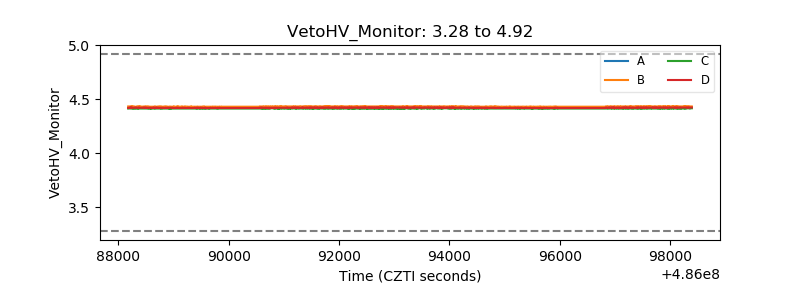 |
| Veto LLD | 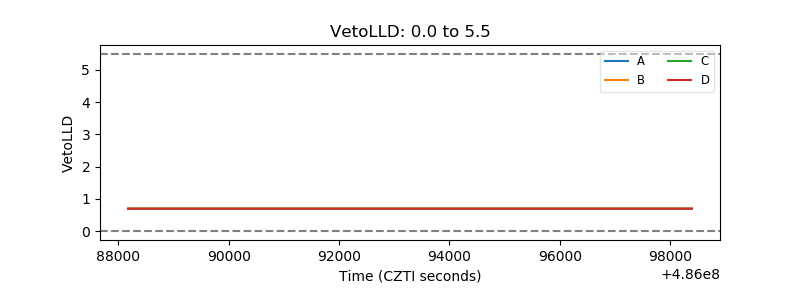 |
| Alpha Counter | 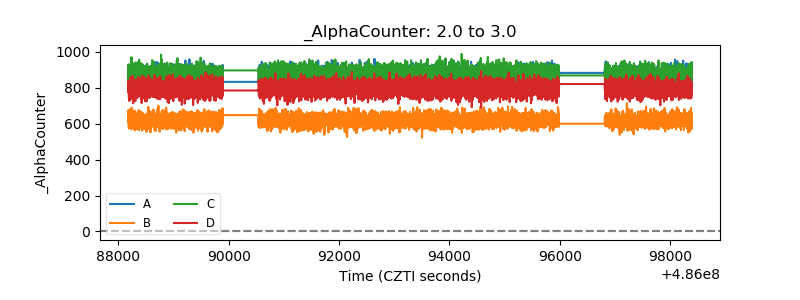 |
| _CPM_Rate | 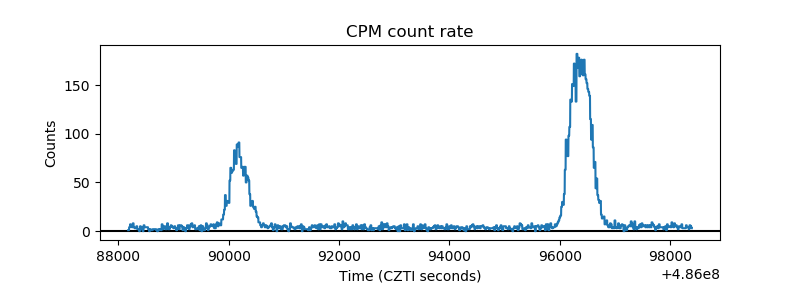 |
| CZT Counter | 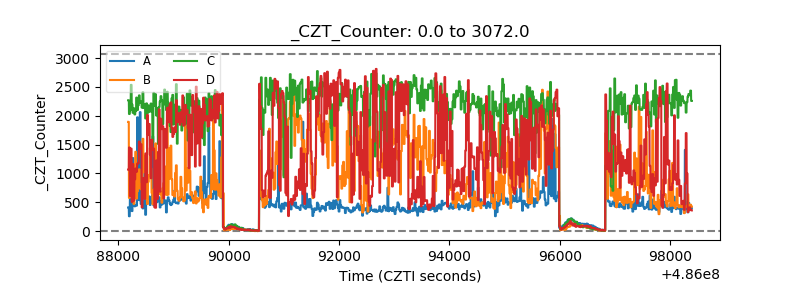 |
| +2.5 Volts monitor | 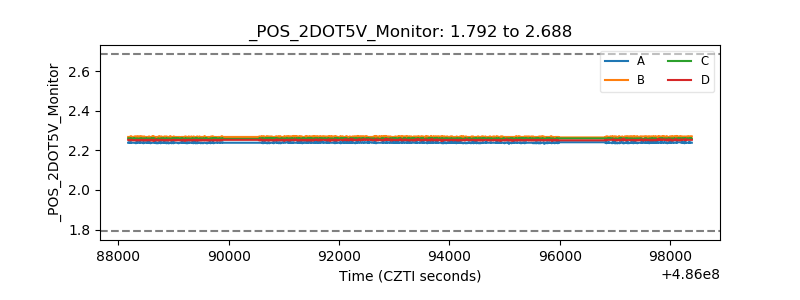 |
| +5 Volts monitor |  |
| _ROLL_ROT | 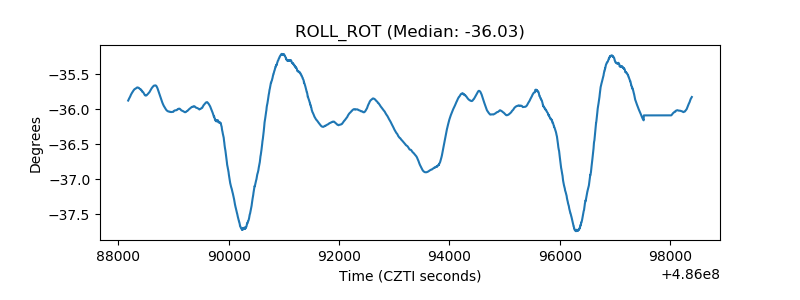 |
| _Roll_DEC | 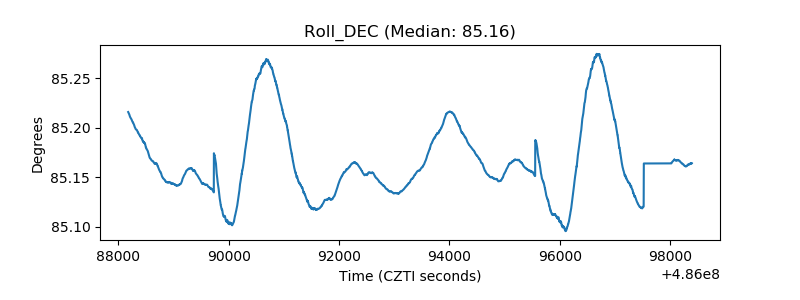 |
| _Roll_RA | 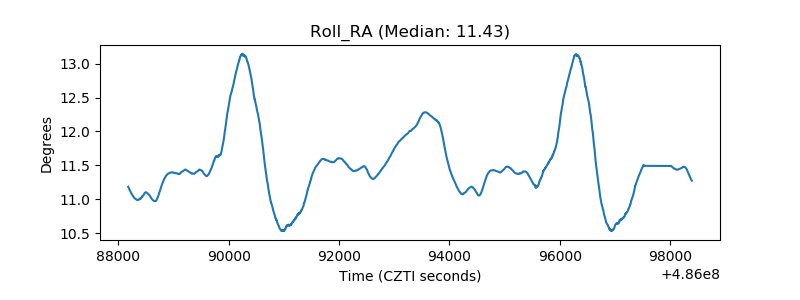 |
| Veto Counter | 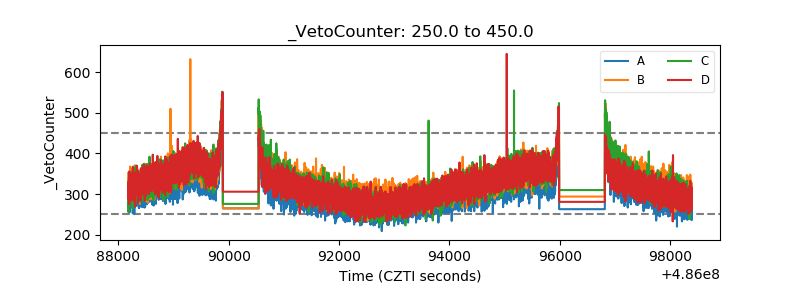 |