| Param | Original file | Final file |
|---|---|---|
| Filename | modeM0/AS1C09_011T05_9000006474_52275cztM0_level2.fits | modeM0/AS1C09_011T05_9000006474_52275cztM0_level2_quad_clean.evt |
| Size (bytes) | 3,861,938,880 | 314,539,200 |
| Size | 3.6 GB | 300.0 MB |
| Events in quadrant A | 17,816,809 | 2,603,617 |
| Events in quadrant B | 25,871,089 | 2,782,841 |
| Events in quadrant C | 64,101,419 | 149,367 |
| Events in quadrant D | 32,916,209 | 1,980,305 |
| Mode M0 | |||
|---|---|---|---|
| Quadrant | BADHDUFLAG | Total packets | Discarded packets |
| A | 0 | 73731 | 5 |
| B | 0 | 97120 | 5 |
| C | 0 | 210324 | 5 |
| D | 0 | 118527 | 5 |
| Mode SS | |||
|---|---|---|---|
| Quadrant | BADHDUFLAG | Total packets | Discarded packets |
| A | 0 | 592 | 0 |
| B | 0 | 592 | 0 |
| C | 0 | 592 | 0 |
| D | 0 | 592 | 0 |
| Mode M9 | |||
|---|---|---|---|
| Quadrant | BADHDUFLAG | Total packets | Discarded packets |
| A | 0 | 30 | 0 |
| B | 0 | 30 | 0 |
| C | 0 | 30 | 0 |
| D | 0 | 30 | 0 |
| Quadrant | Total seconds | Saturated seconds | Saturation percentage |
|---|---|---|---|
| A | 29173 | 1320 | 4.524732% |
| B | 29173 | 1887 | 6.468310% |
| C | 29173 | 27773 | 95.201042% |
| D | 29174 | 6260 | 21.457462% |
Noise dominated data is calculated using 1-second bins in cleaned event files. If a bin has >2000 counts, and if more than 50% of those come from <1% of pixels, then it is considered to be noise-dominated and hence unusable.
| Quadrant | # 1 sec bins | Bins with >0 counts | Bins with >2000 counts | High rate bins dominated by noise | Noise dominated (total time) | Noise dominated (detector-on time) | Marked lightcurve |
|---|---|---|---|---|---|---|---|
| A | 32138 | 29178 | 981 | 981 | 3.05% | 3.36% | 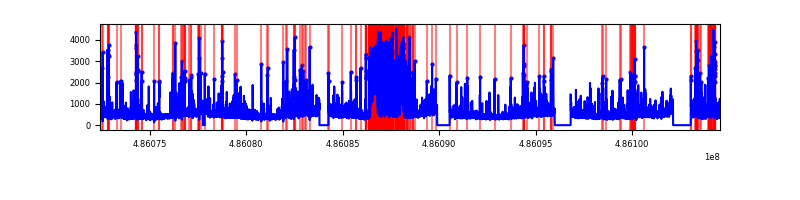 |
| B | 32138 | 29178 | 1109 | 1109 | 3.45% | 3.80% | 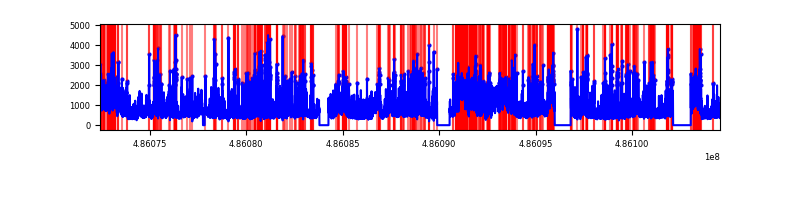 |
| C | 32138 | 29174 | 21795 | 21795 | 67.82% | 74.71% | 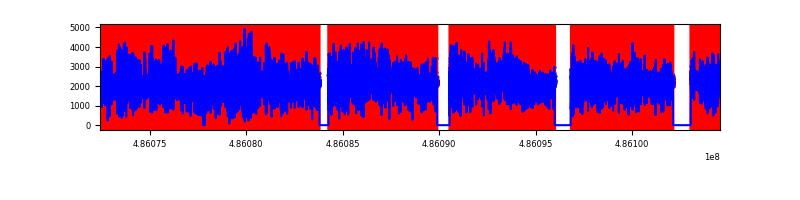 |
| D | 32139 | 29178 | 4646 | 4646 | 14.46% | 15.92% | 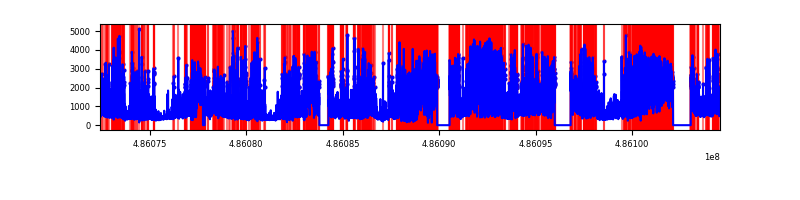 |
Top three noisy pixels from each quadrant. If the there are fewer than three noisy pixels in the level2.evt file, extra rows are filled as -1
| Pixel properties | Quadrant properties | ||||||
|---|---|---|---|---|---|---|---|
| Quadrant | DetID | PixID | Counts | Sigma | Mean | Median | Sigma |
| A | 7 | 206 | 2889135 | 3901.08 | 2975 | 2902 | 739.9 |
| A | 4 | 249 | 685704 | 922.89 | 2975 | 2902 | 739.9 |
| A | 11 | 3 | 372602 | 499.69 | 2975 | 2902 | 739.9 |
| B | 10 | 254 | 6729180 | 10853.71 | 2960 | 2852 | 619.7 |
| B | 4 | 171 | 2375120 | 3827.93 | 2960 | 2852 | 619.7 |
| B | 7 | 0 | 960952 | 1546.0 | 2960 | 2852 | 619.7 |
| C | 15 | 158 | 25704529 | 90210.35 | 1017 | 1007 | 284.9 |
| C | 15 | 178 | 24556353 | 86180.65 | 1017 | 1007 | 284.9 |
| C | 15 | 224 | 6150899 | 21583.96 | 1017 | 1007 | 284.9 |
| D | 15 | 93 | 5132637 | 6941.38 | 2605 | 2494 | 739.1 |
| D | 12 | 18 | 4901011 | 6627.98 | 2605 | 2494 | 739.1 |
| D | 7 | 60 | 2807238 | 3794.98 | 2605 | 2494 | 739.1 |
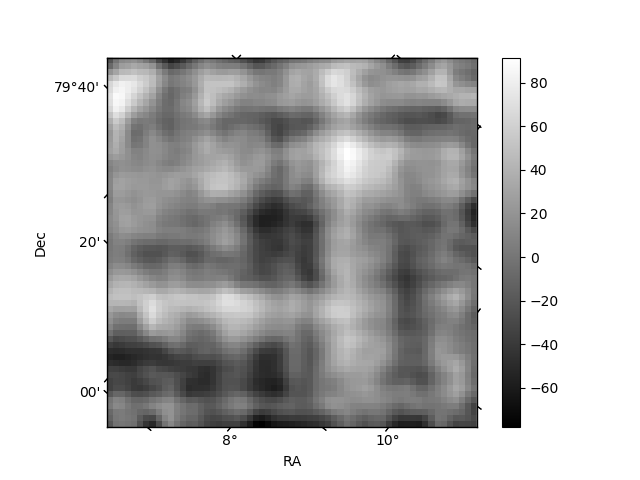
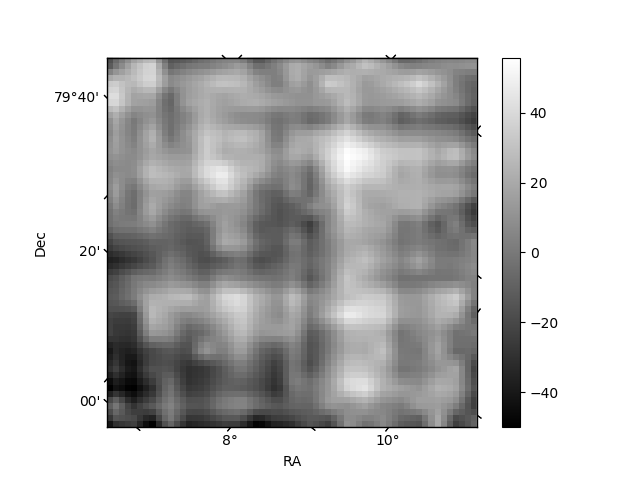
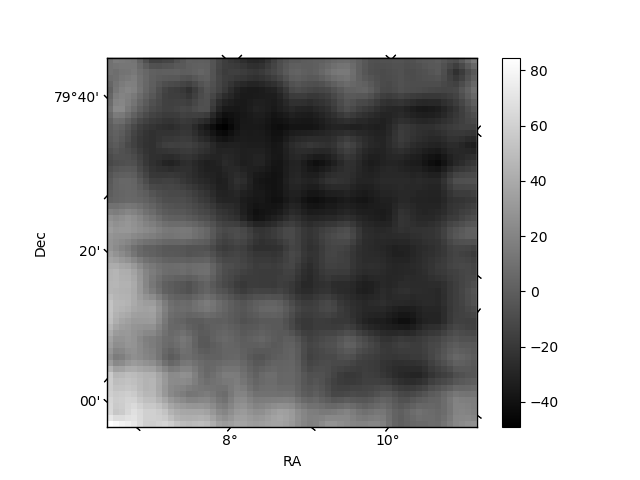
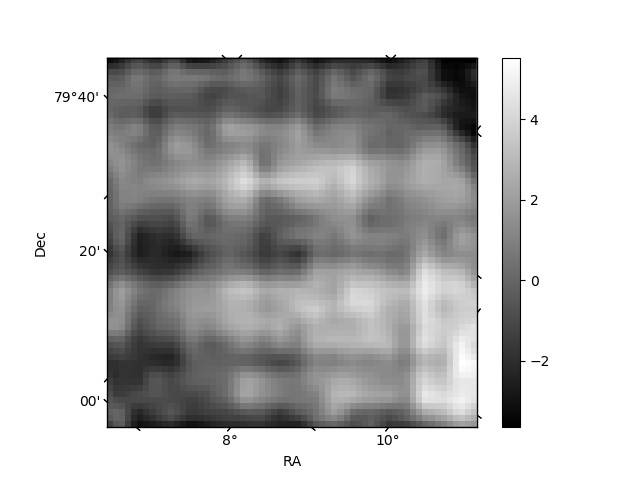
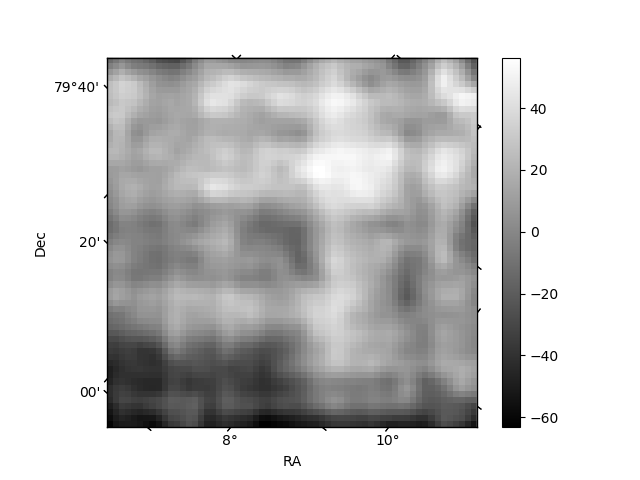
Histogram calculated using DETX and DETY for each event in the final _common_clean file
| Quadrant A | 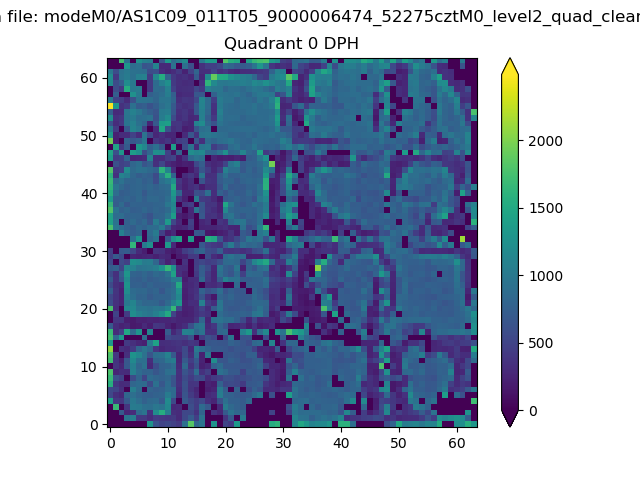 |
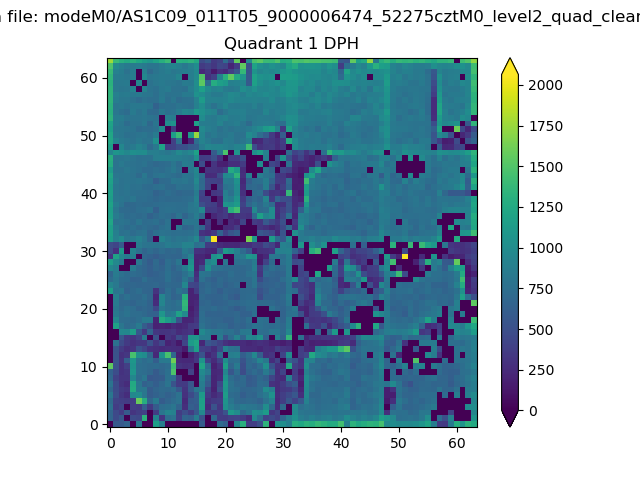 |
Quadrant B |
|---|---|---|---|
| Quadrant D |  |
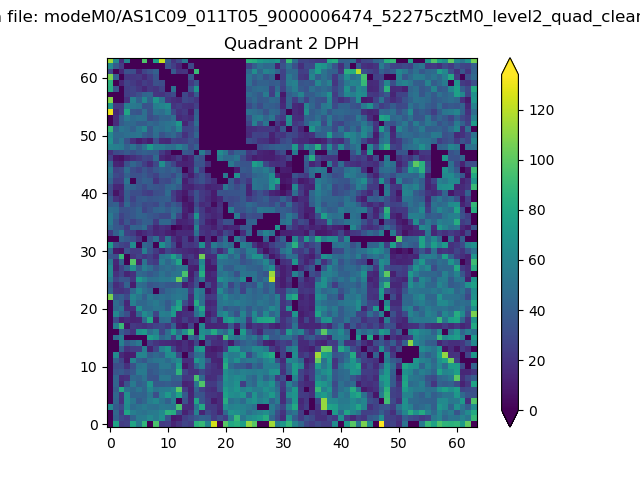 |
Quadrant C |
| Plot type | Count rate plots | Images |
|---|---|---|
| Comparison with Poisson distribution Blue bars denote a histogram of data divided into 1 sec bins. Red curve is a Poisson curve with rate = median count rate of data. |
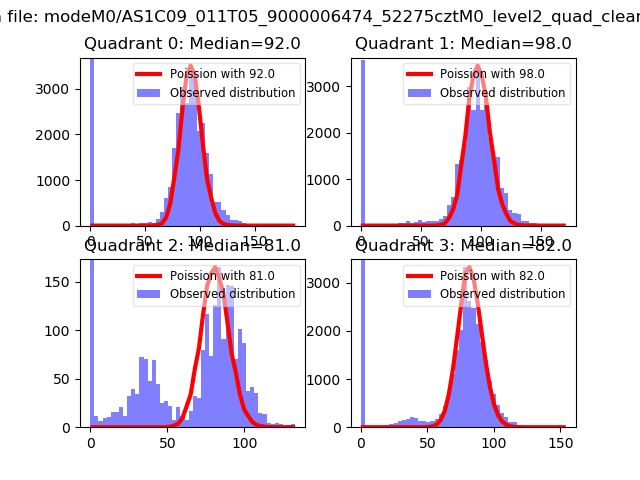 |
 |
| Quadrant-wise count rates Data is divided into 100 sec bins |
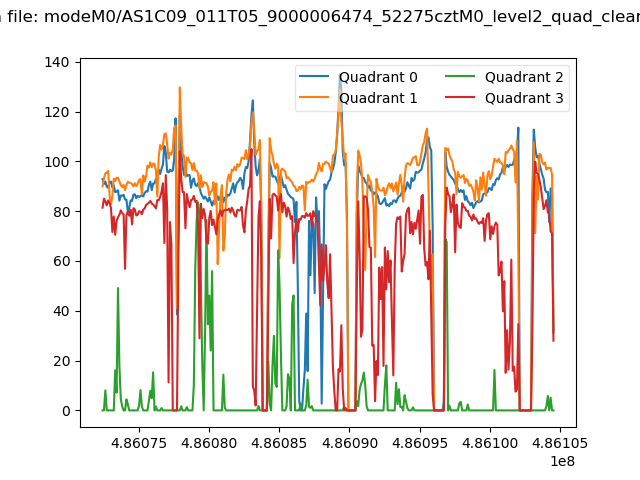 |
|
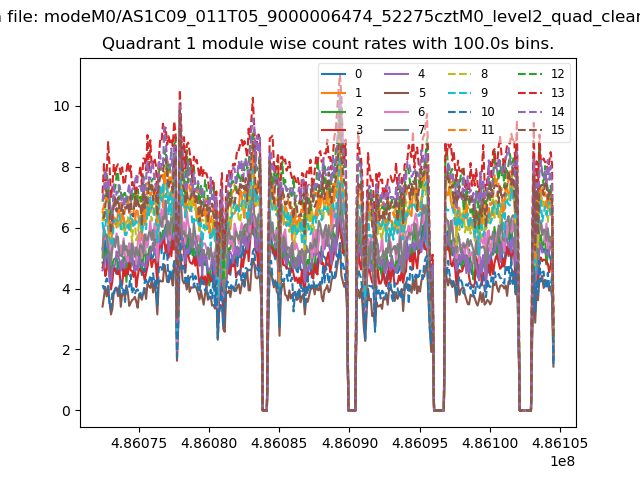
| Module-wise count rates for Quadrant A Data is divided into 100 sec bins |
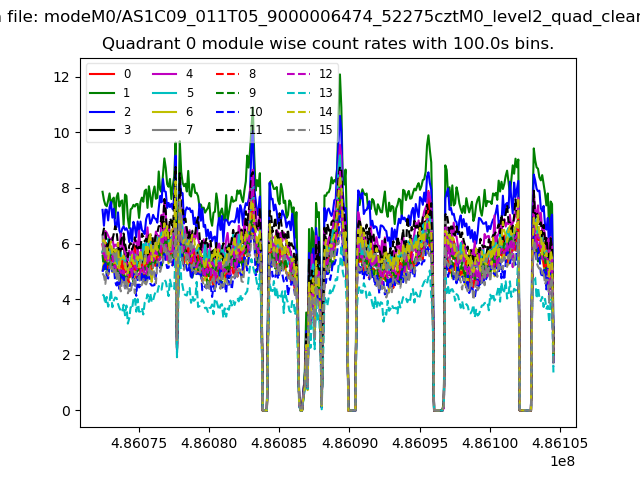 |
 |
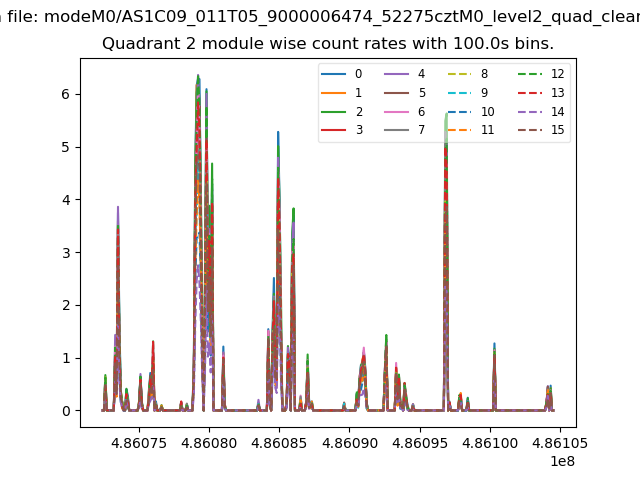
| Module-wise count rates for Quadrant B Data is divided into 100 sec bins |
 |
 |
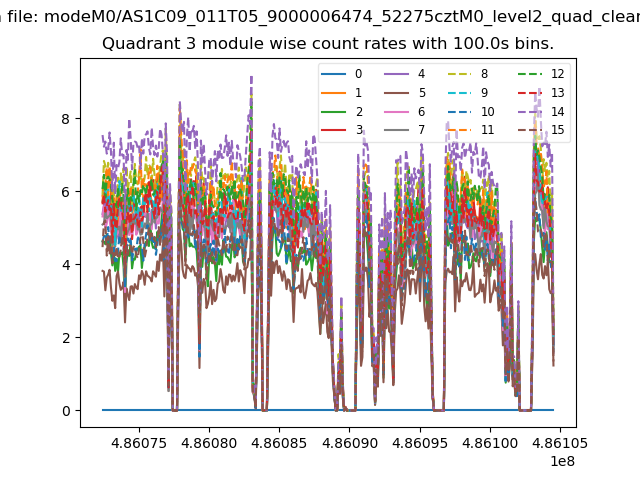
| Module-wise count rates for Quadrant C Data is divided into 100 sec bins |
 |
 |
| Module-wise count rates for Quadrant D Data is divided into 100 sec bins |
 |
 |
| Parameter | Plot |
|---|---|
| CZT HV Monitor | 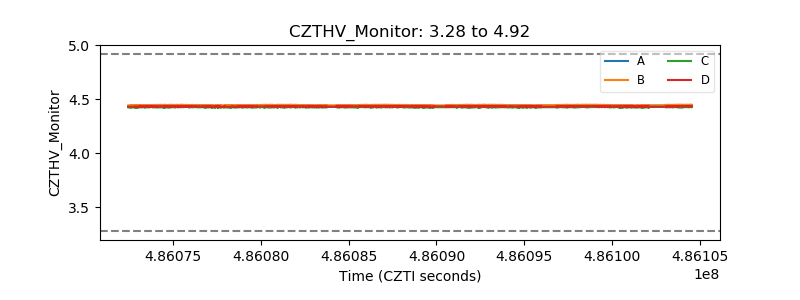 |
| D_VDD | 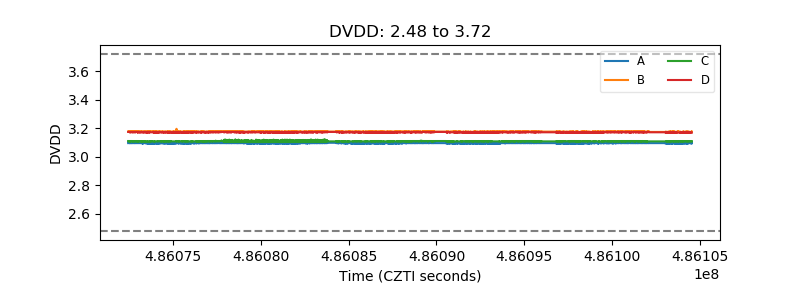 |
| Temperature 1 | 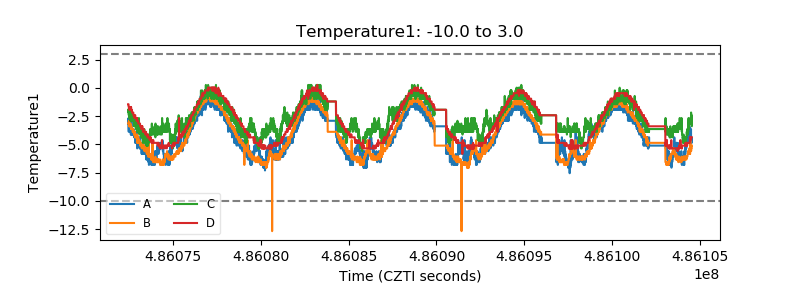 |
| Veto HV Monitor | 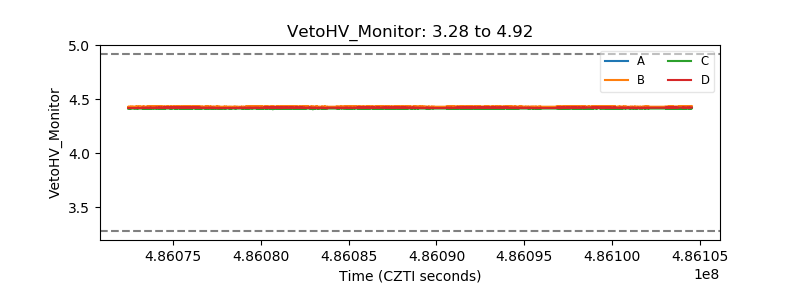 |
| Veto LLD | 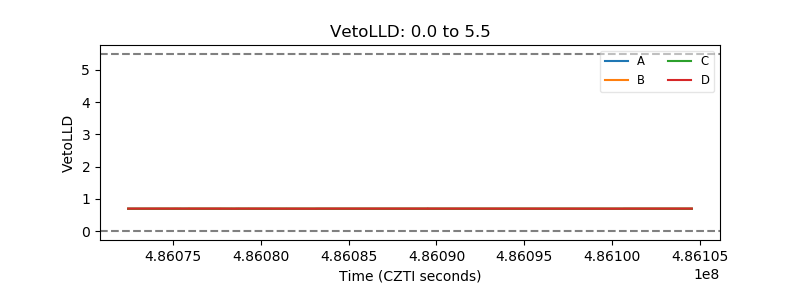 |
| Alpha Counter | 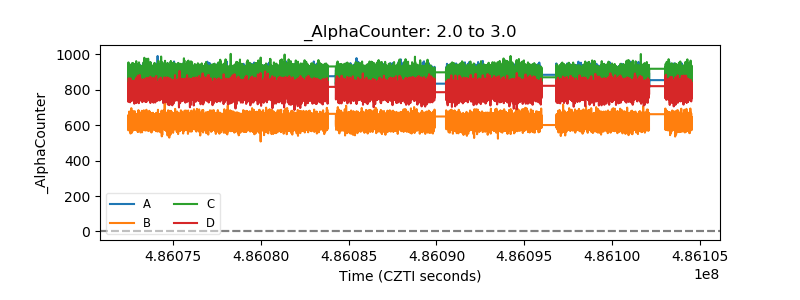 |
| _CPM_Rate | 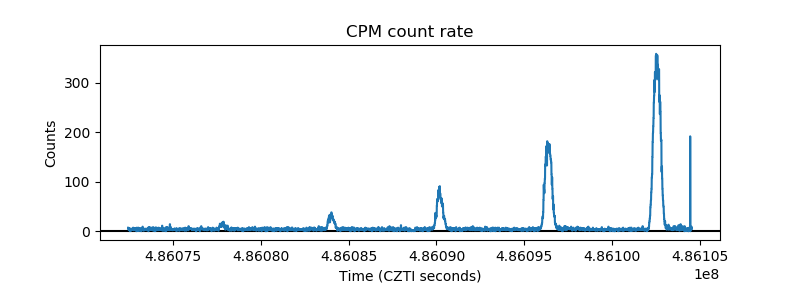 |
| CZT Counter |  |
| +2.5 Volts monitor |  |
| +5 Volts monitor |  |
| _ROLL_ROT | 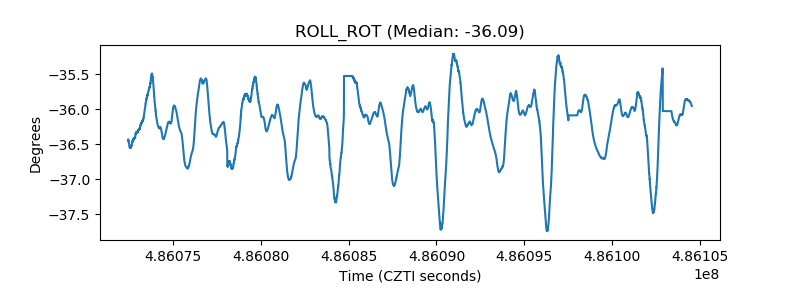 |
| _Roll_DEC | 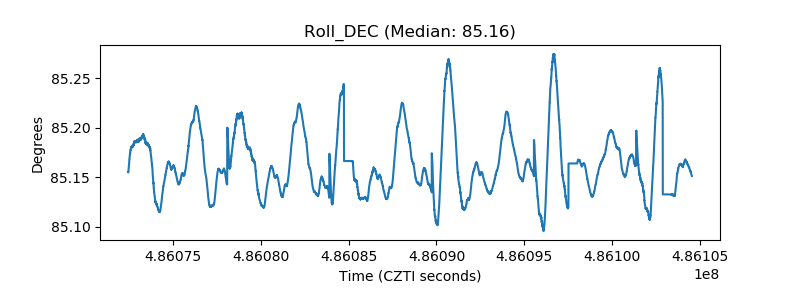 |
| _Roll_RA | 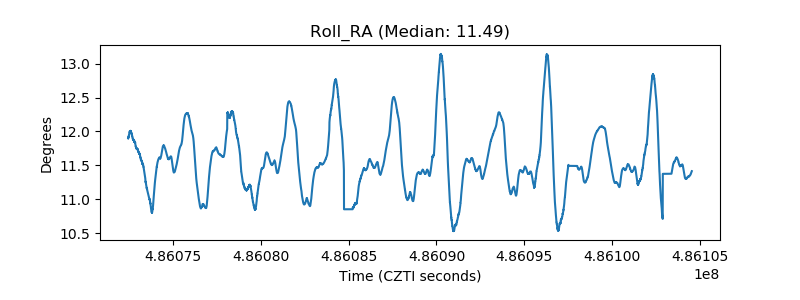 |
| Veto Counter | 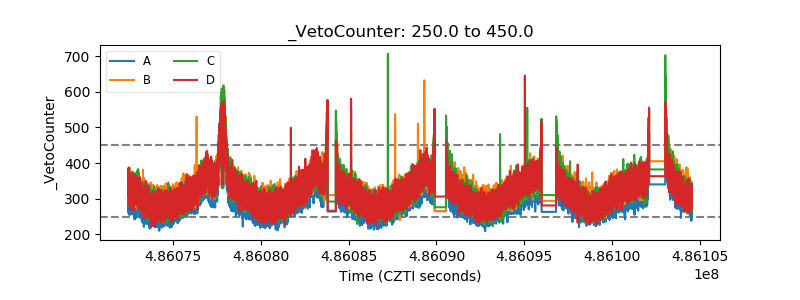 |