| Param | Original file | Final file |
|---|---|---|
| Filename | modeM0/AS1C09_011T05_9000006474_52277cztM0_level2.fits | modeM0/AS1C09_011T05_9000006474_52277cztM0_level2_quad_clean.evt |
| Size (bytes) | 823,703,040 | 69,163,200 |
| Size | 785.5 MB | 66.0 MB |
| Events in quadrant A | 3,557,702 | 586,184 |
| Events in quadrant B | 4,917,862 | 608,752 |
| Events in quadrant C | 13,858,256 | 7,170 |
| Events in quadrant D | 7,670,359 | 454,115 |
| Mode M0 | |||
|---|---|---|---|
| Quadrant | BADHDUFLAG | Total packets | Discarded packets |
| A | 0 | 14971 | 1 |
| B | 0 | 18914 | 1 |
| C | 0 | 45466 | 1 |
| D | 0 | 27218 | 4 |
| Mode SS | |||
|---|---|---|---|
| Quadrant | BADHDUFLAG | Total packets | Discarded packets |
| A | 0 | 128 | 0 |
| B | 0 | 128 | 0 |
| C | 0 | 128 | 0 |
| D | 0 | 128 | 0 |
| Mode M9 | |||
|---|---|---|---|
| Quadrant | BADHDUFLAG | Total packets | Discarded packets |
| A | 0 | 10 | 0 |
| B | 0 | 10 | 0 |
| C | 0 | 10 | 0 |
| D | 0 | 10 | 0 |
| Quadrant | Total seconds | Saturated seconds | Saturation percentage |
|---|---|---|---|
| A | 6267 | 142 | 2.265837% |
| B | 6267 | 381 | 6.079464% |
| C | 6267 | 6217 | 99.202170% |
| D | 6267 | 1073 | 17.121430% |
Noise dominated data is calculated using 1-second bins in cleaned event files. If a bin has >2000 counts, and if more than 50% of those come from <1% of pixels, then it is considered to be noise-dominated and hence unusable.
| Quadrant | # 1 sec bins | Bins with >0 counts | Bins with >2000 counts | High rate bins dominated by noise | Noise dominated (total time) | Noise dominated (detector-on time) | Marked lightcurve |
|---|---|---|---|---|---|---|---|
| A | 7297 | 6268 | 103 | 103 | 1.41% | 1.64% | 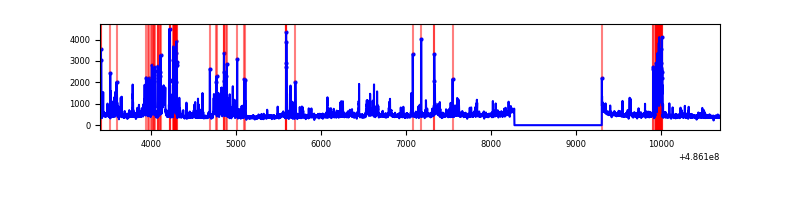 |
| B | 7297 | 6268 | 241 | 241 | 3.30% | 3.84% | 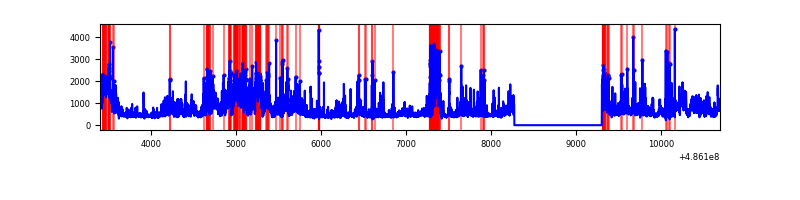 |
| C | 7296 | 6266 | 4788 | 4788 | 65.62% | 76.41% | 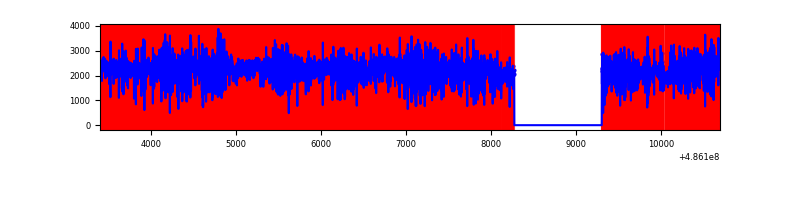 |
| D | 7297 | 6268 | 853 | 853 | 11.69% | 13.61% | 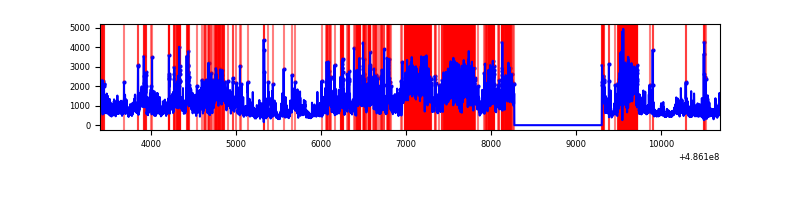 |
Top three noisy pixels from each quadrant. If the there are fewer than three noisy pixels in the level2.evt file, extra rows are filled as -1
| Pixel properties | Quadrant properties | ||||||
|---|---|---|---|---|---|---|---|
| Quadrant | DetID | PixID | Counts | Sigma | Mean | Median | Sigma |
| A | 4 | 249 | 375490 | 2311.68 | 646 | 630 | 162.2 |
| A | 7 | 206 | 268776 | 1653.59 | 646 | 630 | 162.2 |
| A | 12 | 3 | 102076 | 625.59 | 646 | 630 | 162.2 |
| B | 10 | 254 | 1065274 | 7984.37 | 634 | 613 | 133.3 |
| B | 0 | 213 | 407217 | 3049.31 | 634 | 613 | 133.3 |
| B | 4 | 171 | 170421 | 1273.47 | 634 | 613 | 133.3 |
| C | 15 | 158 | 5662656 | 88626.97 | 225 | 223 | 63.9 |
| C | 15 | 178 | 4451890 | 69676.37 | 225 | 223 | 63.9 |
| C | 15 | 224 | 1389447 | 21743.78 | 225 | 223 | 63.9 |
| D | 15 | 93 | 3395310 | 20227.75 | 586 | 560 | 167.8 |
| D | 12 | 128 | 372475 | 2216.07 | 586 | 560 | 167.8 |
| D | 8 | 176 | 180192 | 1070.34 | 586 | 560 | 167.8 |
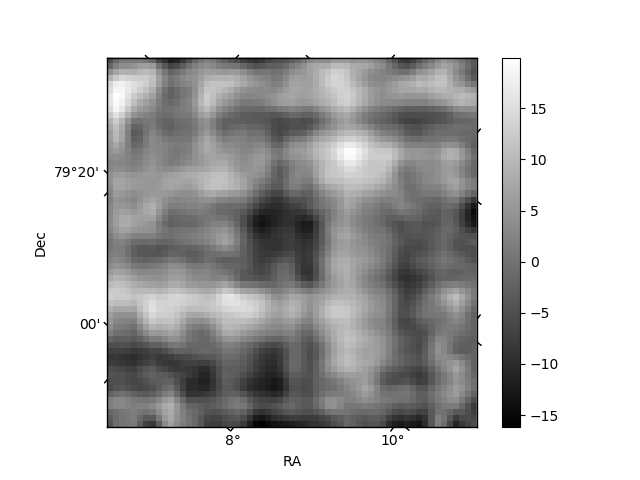
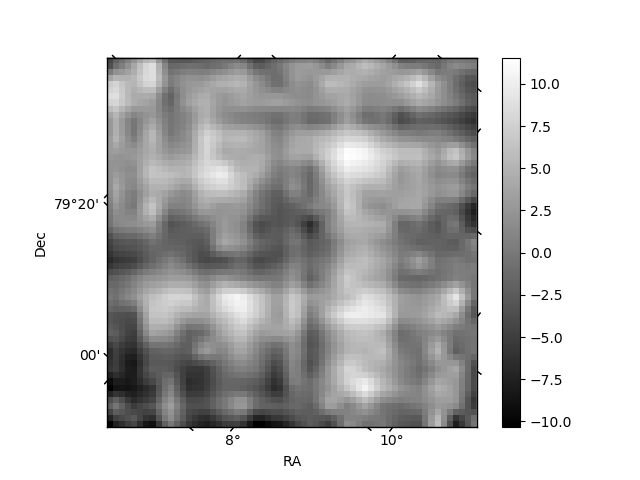
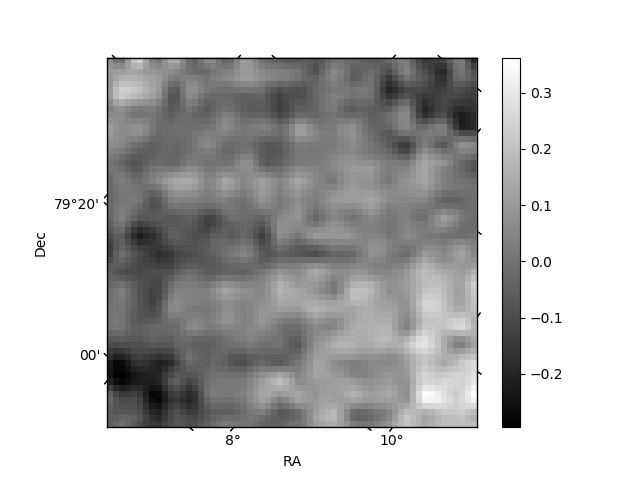
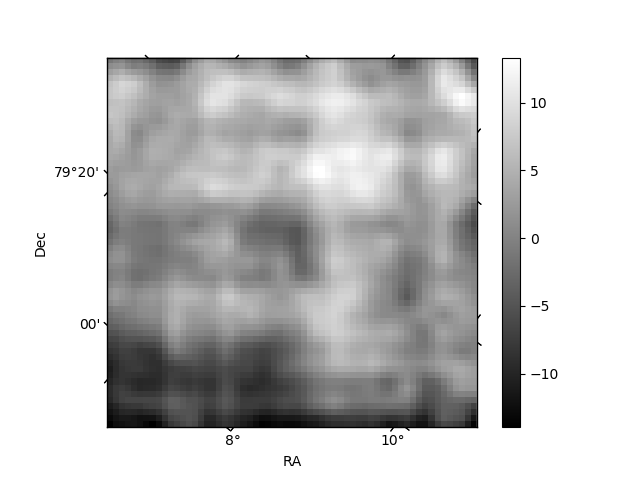
Histogram calculated using DETX and DETY for each event in the final _common_clean file
| Quadrant A | 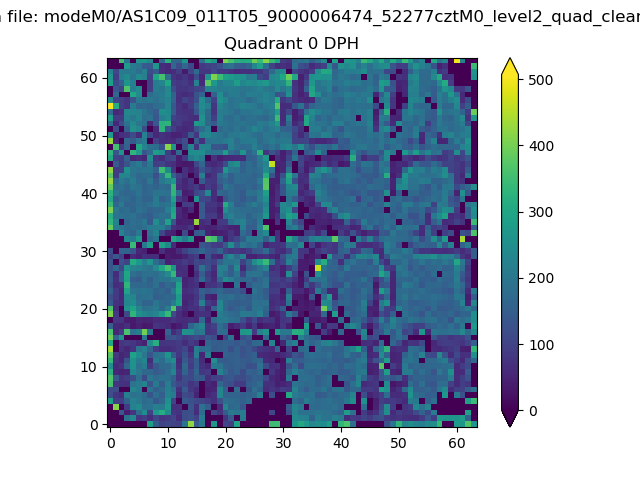 |
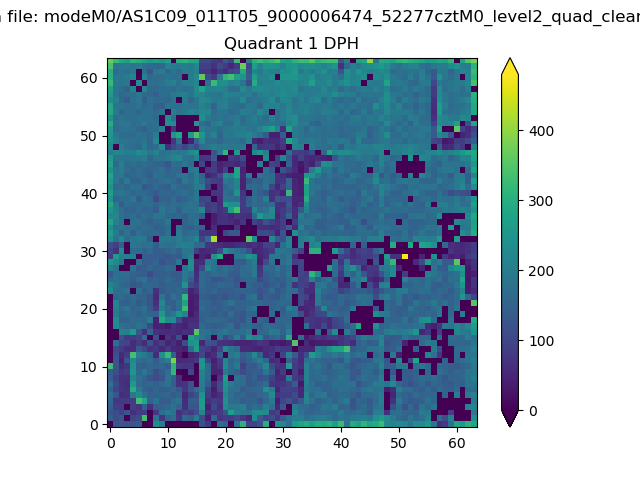 |
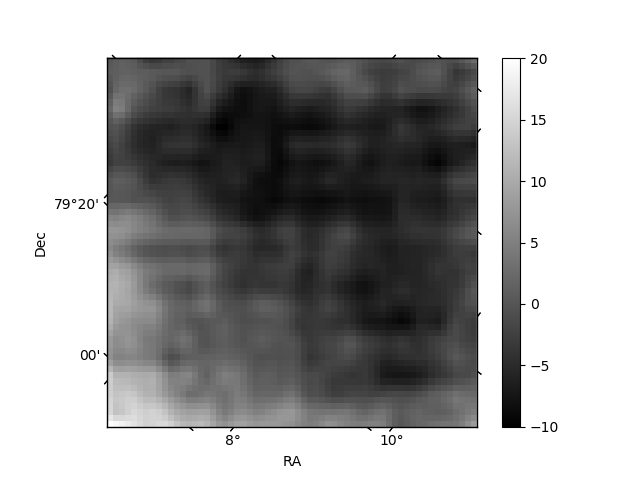
Quadrant B |
|---|---|---|---|
| Quadrant D | 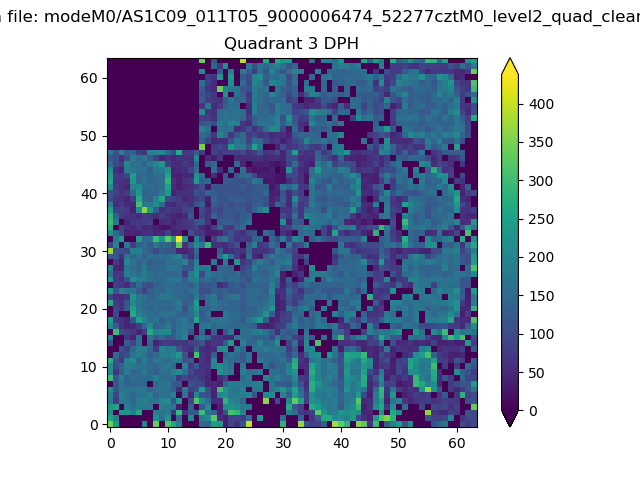 |
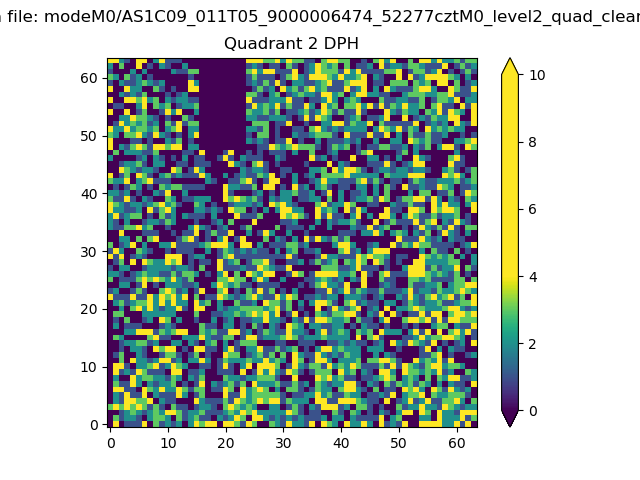 |
Quadrant C |
| Plot type | Count rate plots | Images |
|---|---|---|
| Comparison with Poisson distribution Blue bars denote a histogram of data divided into 1 sec bins. Red curve is a Poisson curve with rate = median count rate of data. |
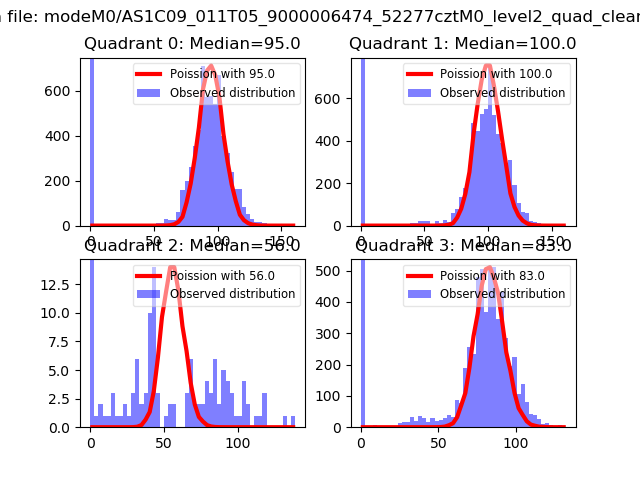 |
 |
| Quadrant-wise count rates Data is divided into 100 sec bins |
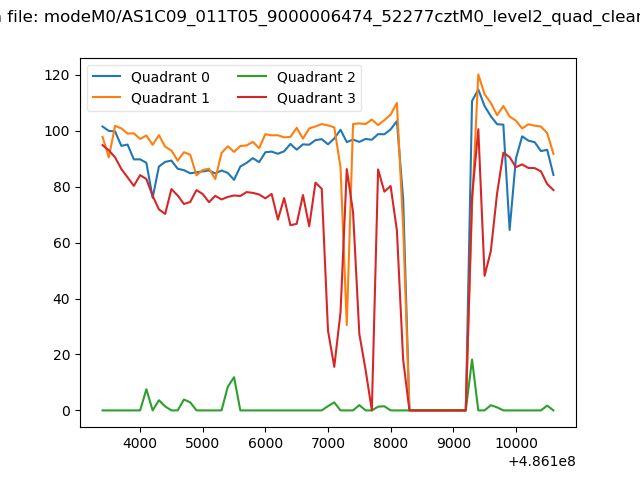 |
|
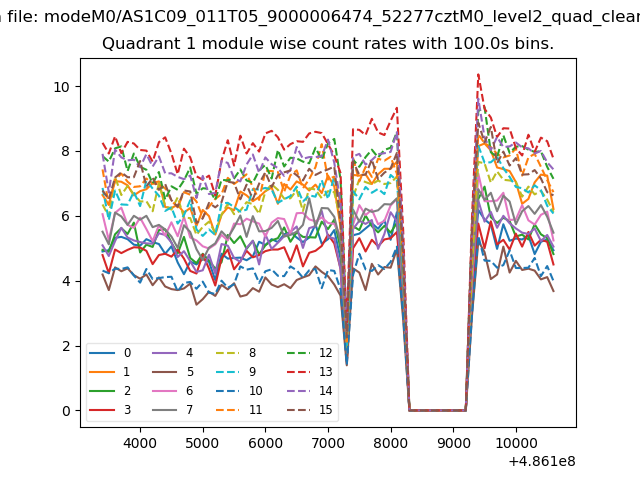
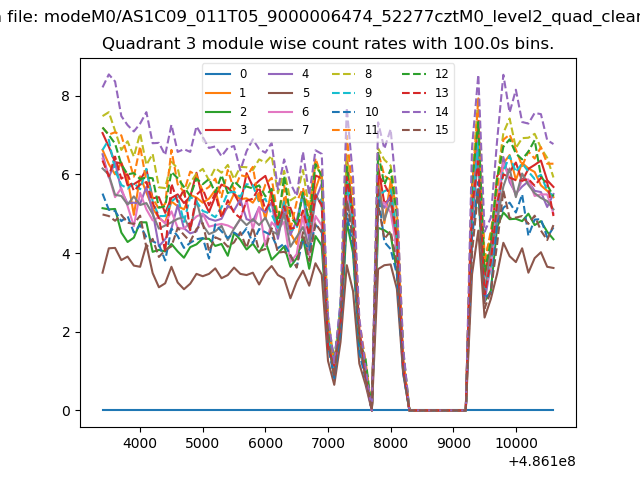
| Module-wise count rates for Quadrant A Data is divided into 100 sec bins |
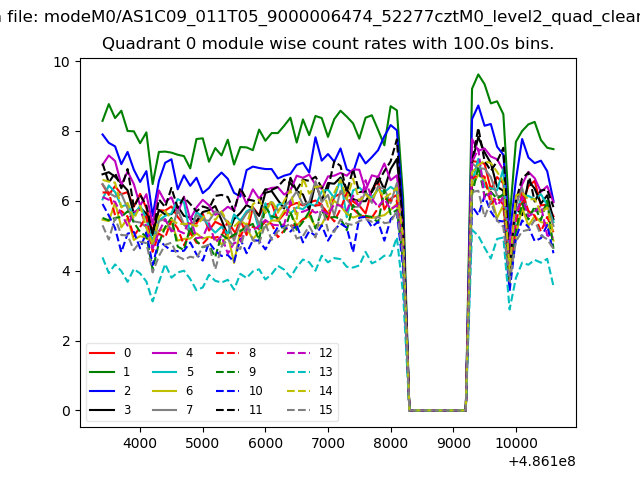 |
 |
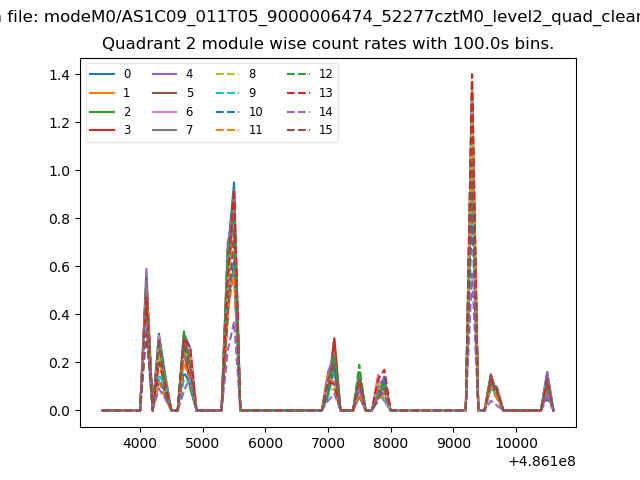
| Module-wise count rates for Quadrant B Data is divided into 100 sec bins |
 |
 |
| Module-wise count rates for Quadrant C Data is divided into 100 sec bins |
 |
 |
| Module-wise count rates for Quadrant D Data is divided into 100 sec bins |
 |
 |
| Parameter | Plot |
|---|---|
| CZT HV Monitor | 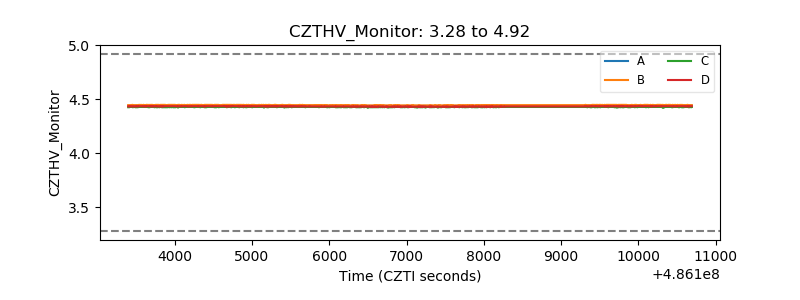 |
| D_VDD | 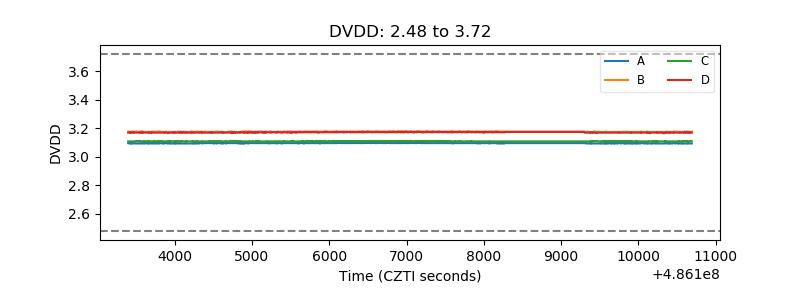 |
| Temperature 1 | 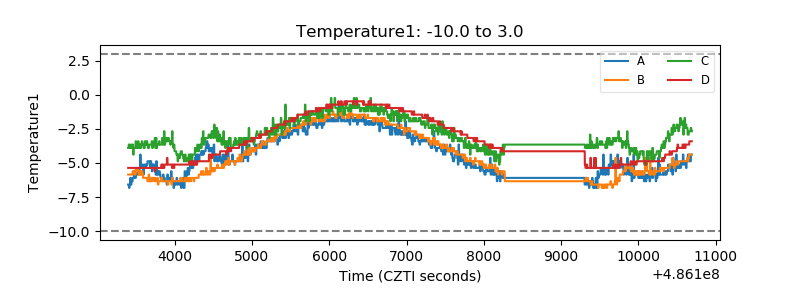 |
| Veto HV Monitor |  |
| Veto LLD | 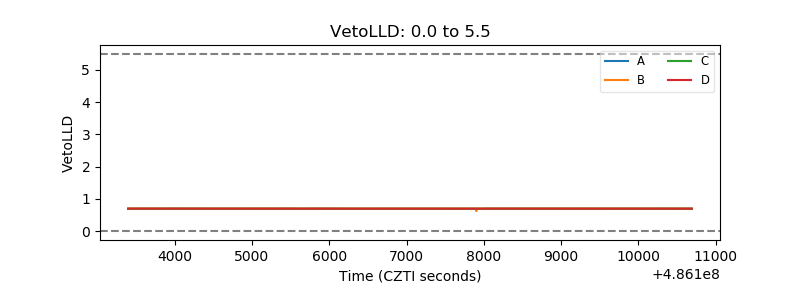 |
| Alpha Counter | 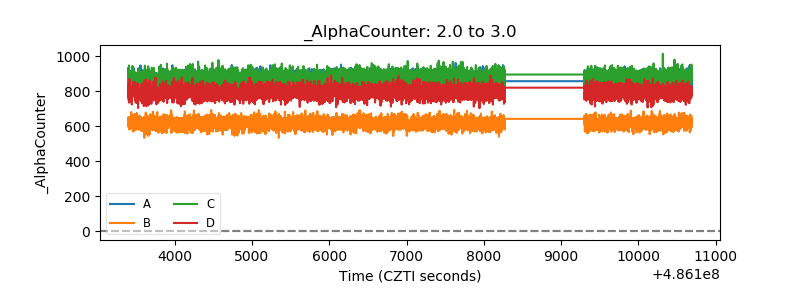 |
| _CPM_Rate | 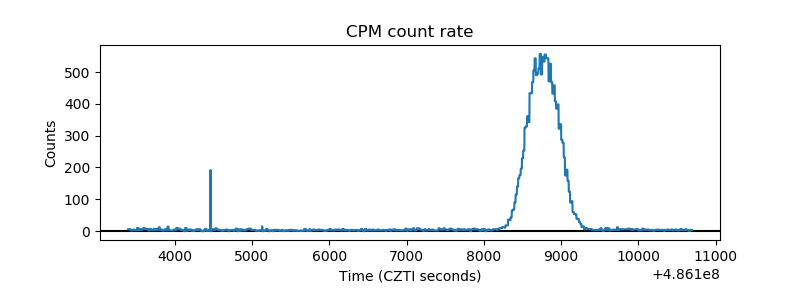 |
| CZT Counter | 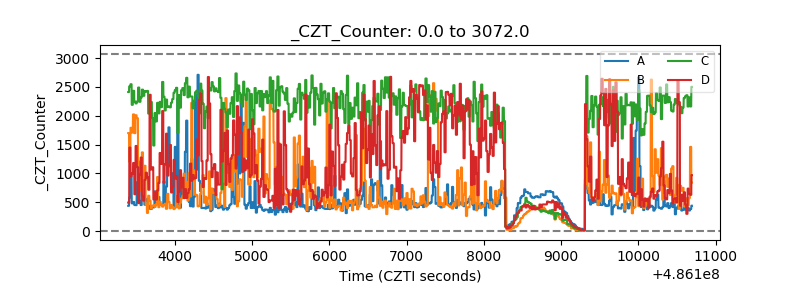 |
| +2.5 Volts monitor |  |
| +5 Volts monitor | 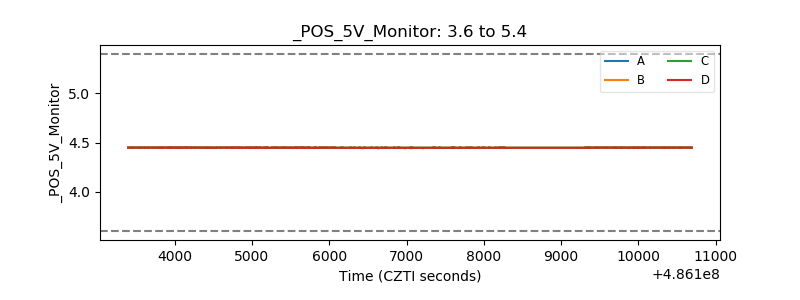 |
| _ROLL_ROT | 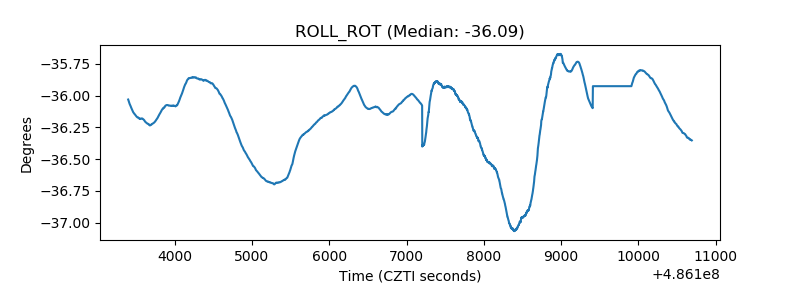 |
| _Roll_DEC | 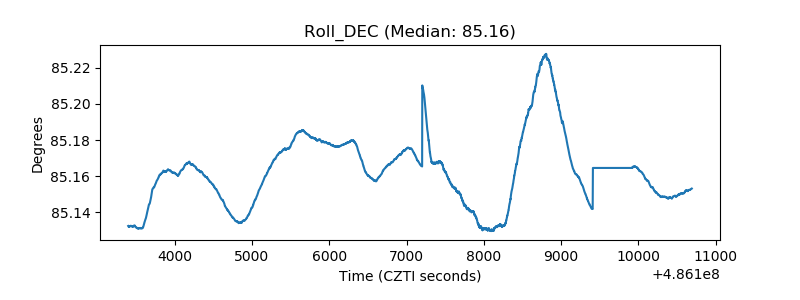 |
| _Roll_RA | 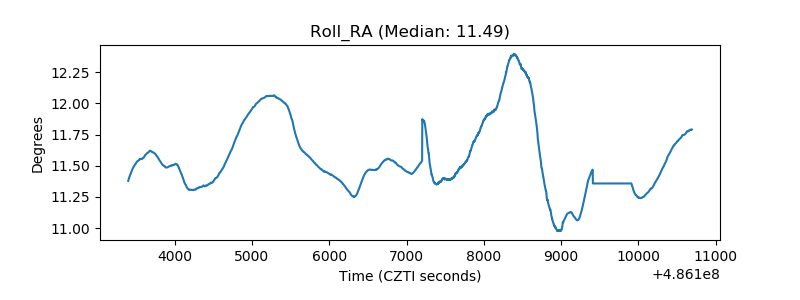 |
| Veto Counter | 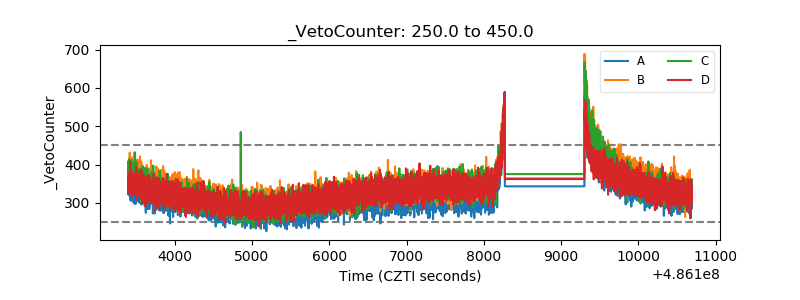 |