| Param | Original file | Final file |
|---|---|---|
| Filename | modeM0/AS1C09_011T05_9000006474_52278cztM0_level2.fits | modeM0/AS1C09_011T05_9000006474_52278cztM0_level2_quad_clean.evt |
| Size (bytes) | 721,154,880 | 71,066,880 |
| Size | 687.7 MB | 67.8 MB |
| Events in quadrant A | 3,085,427 | 568,135 |
| Events in quadrant B | 5,183,794 | 592,681 |
| Events in quadrant C | 12,759,729 | 72,191 |
| Events in quadrant D | 5,202,978 | 501,779 |
| Mode M0 | |||
|---|---|---|---|
| Quadrant | BADHDUFLAG | Total packets | Discarded packets |
| A | 0 | 13435 | 1 |
| B | 0 | 19562 | 1 |
| C | 0 | 41965 | 6 |
| D | 0 | 19656 | 1 |
| Mode SS | |||
|---|---|---|---|
| Quadrant | BADHDUFLAG | Total packets | Discarded packets |
| A | 0 | 124 | 0 |
| B | 0 | 124 | 0 |
| C | 0 | 124 | 0 |
| D | 0 | 124 | 0 |
| Mode M9 | |||
|---|---|---|---|
| Quadrant | BADHDUFLAG | Total packets | Discarded packets |
| A | 0 | 10 | 0 |
| B | 0 | 10 | 0 |
| C | 0 | 10 | 0 |
| D | 0 | 10 | 0 |
| Quadrant | Total seconds | Saturated seconds | Saturation percentage |
|---|---|---|---|
| A | 5958 | 155 | 2.601544% |
| B | 5959 | 361 | 6.058063% |
| C | 5958 | 5285 | 88.704263% |
| D | 5958 | 271 | 4.548506% |
Noise dominated data is calculated using 1-second bins in cleaned event files. If a bin has >2000 counts, and if more than 50% of those come from <1% of pixels, then it is considered to be noise-dominated and hence unusable.
| Quadrant | # 1 sec bins | Bins with >0 counts | Bins with >2000 counts | High rate bins dominated by noise | Noise dominated (total time) | Noise dominated (detector-on time) | Marked lightcurve |
|---|---|---|---|---|---|---|---|
| A | 7028 | 5959 | 78 | 78 | 1.11% | 1.31% | 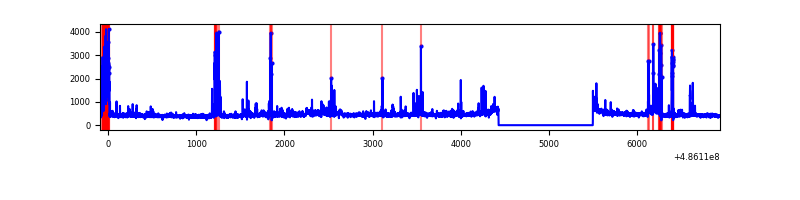 |
| B | 7029 | 5960 | 173 | 173 | 2.46% | 2.90% | 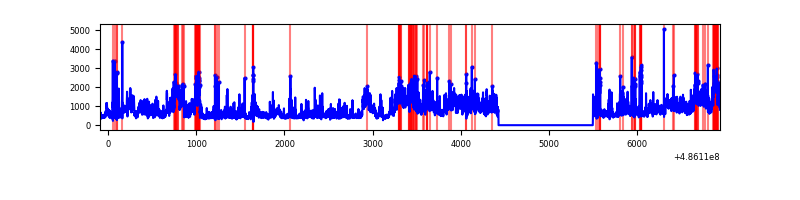 |
| C | 7027 | 5957 | 4199 | 4199 | 59.76% | 70.49% | 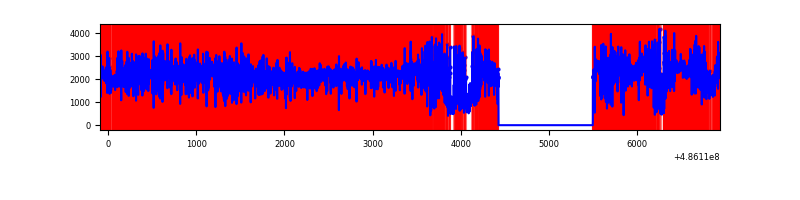 |
| D | 7028 | 5959 | 205 | 205 | 2.92% | 3.44% | 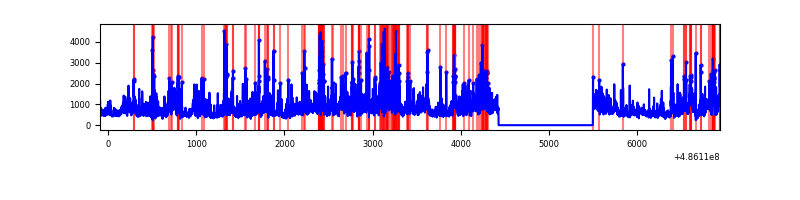 |
Top three noisy pixels from each quadrant. If the there are fewer than three noisy pixels in the level2.evt file, extra rows are filled as -1
| Pixel properties | Quadrant properties | ||||||
|---|---|---|---|---|---|---|---|
| Quadrant | DetID | PixID | Counts | Sigma | Mean | Median | Sigma |
| A | 4 | 249 | 342845 | 2176.92 | 624 | 607 | 157.2 |
| A | 5 | 240 | 78483 | 495.36 | 624 | 607 | 157.2 |
| A | 10 | 253 | 50794 | 319.23 | 624 | 607 | 157.2 |
| B | 7 | 0 | 1190482 | 9252.09 | 610 | 590 | 128.6 |
| B | 10 | 254 | 546537 | 4245.05 | 610 | 590 | 128.6 |
| B | 4 | 171 | 280619 | 2177.39 | 610 | 590 | 128.6 |
| C | 15 | 158 | 5492851 | 74959.86 | 259 | 256 | 73.3 |
| C | 15 | 178 | 3871736 | 52835.79 | 259 | 256 | 73.3 |
| C | 15 | 224 | 1216045 | 16592.41 | 259 | 256 | 73.3 |
| D | 15 | 93 | 1453284 | 8621.94 | 593 | 565 | 168.5 |
| D | 8 | 176 | 428544 | 2540.07 | 593 | 565 | 168.5 |
| D | 2 | 120 | 205122 | 1214.05 | 593 | 565 | 168.5 |
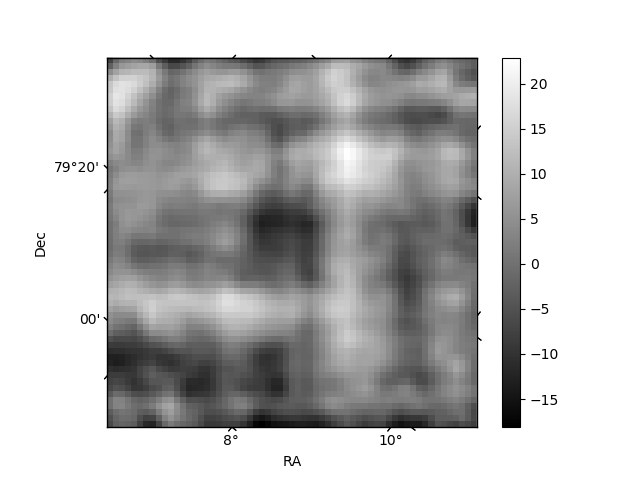
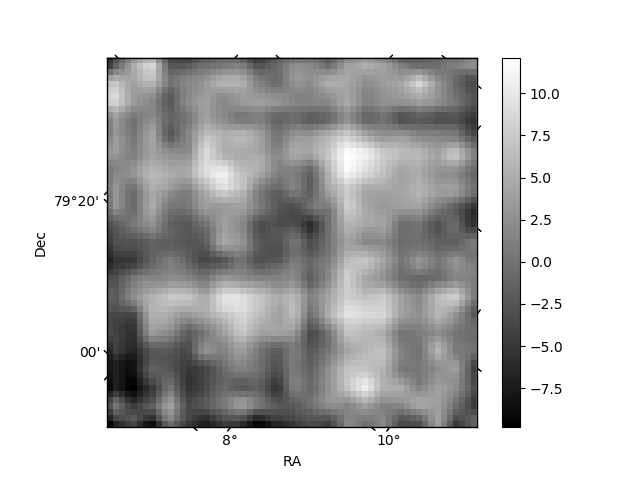
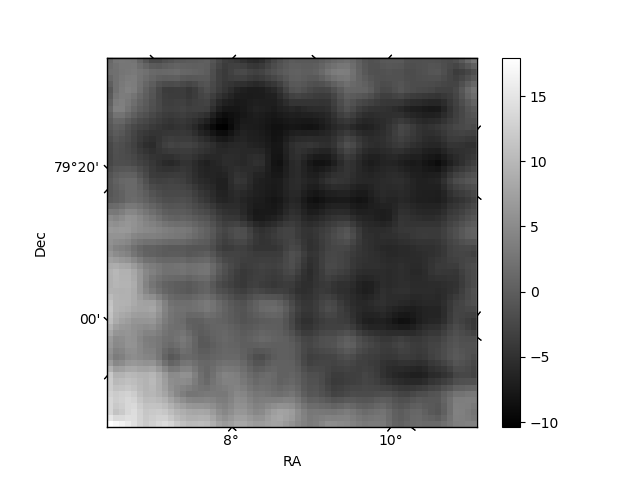
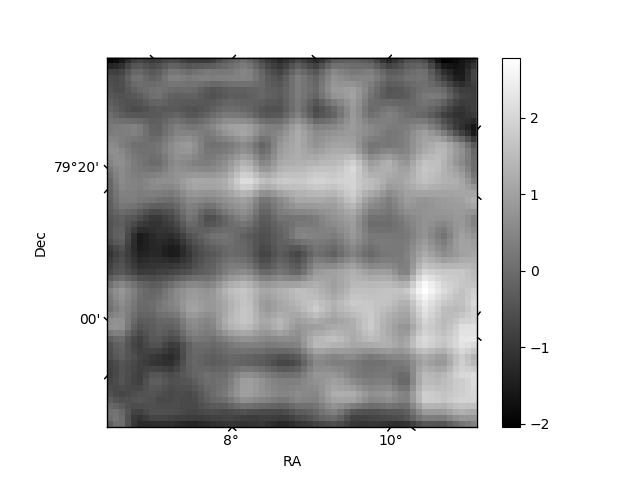
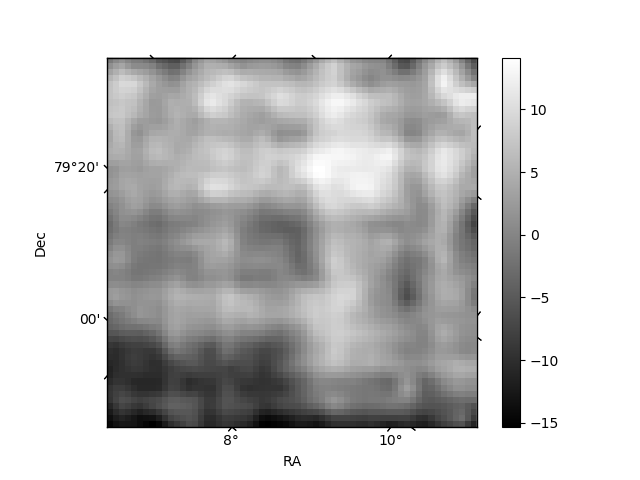
Histogram calculated using DETX and DETY for each event in the final _common_clean file
| Quadrant A | 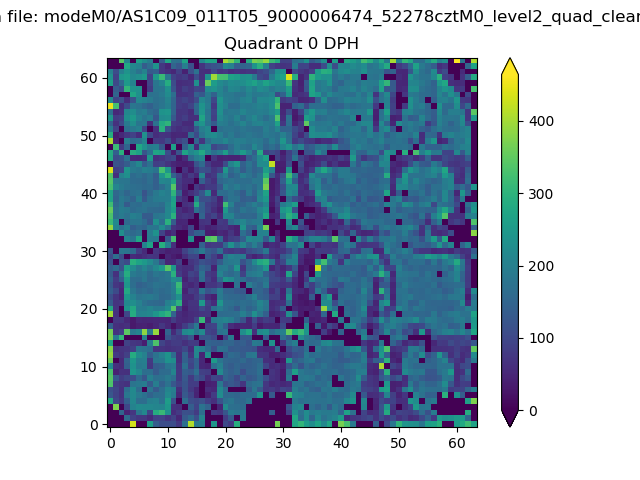 |
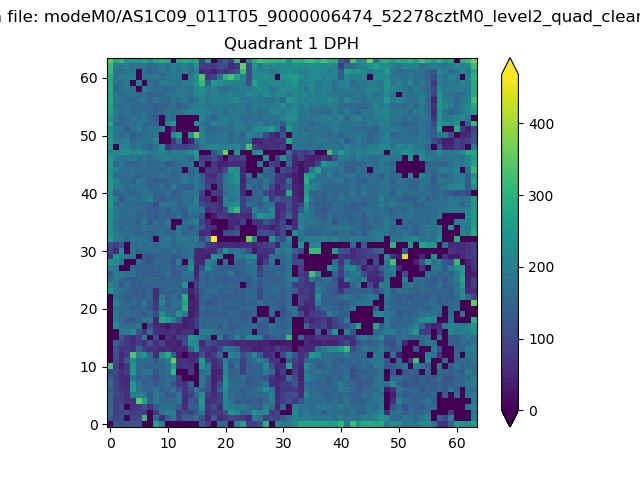 |
Quadrant B |
|---|---|---|---|
| Quadrant D | 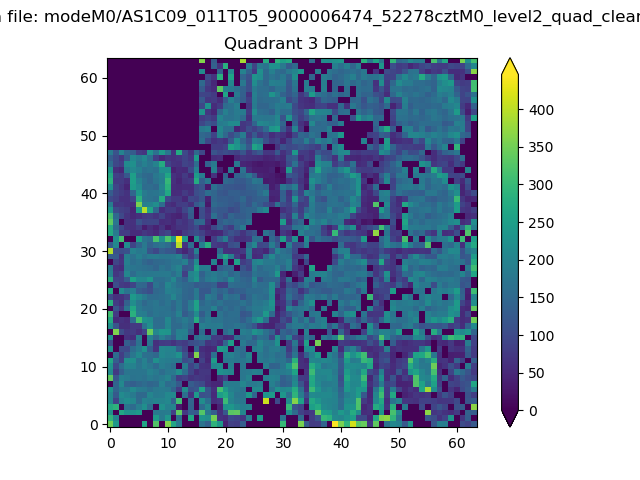 |
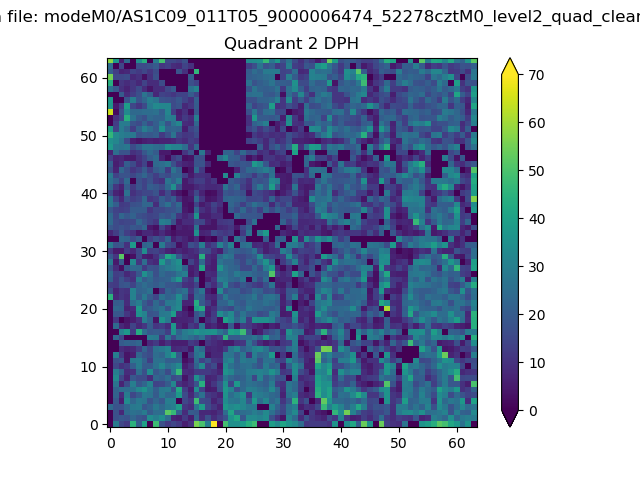 |
Quadrant C |
| Plot type | Count rate plots | Images |
|---|---|---|
| Comparison with Poisson distribution Blue bars denote a histogram of data divided into 1 sec bins. Red curve is a Poisson curve with rate = median count rate of data. |
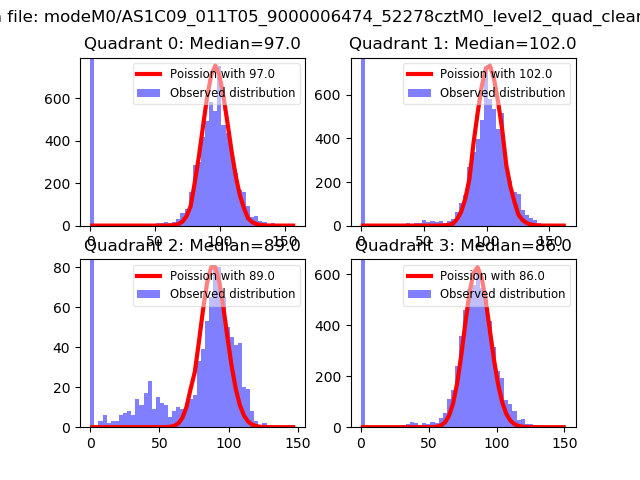 |
 |
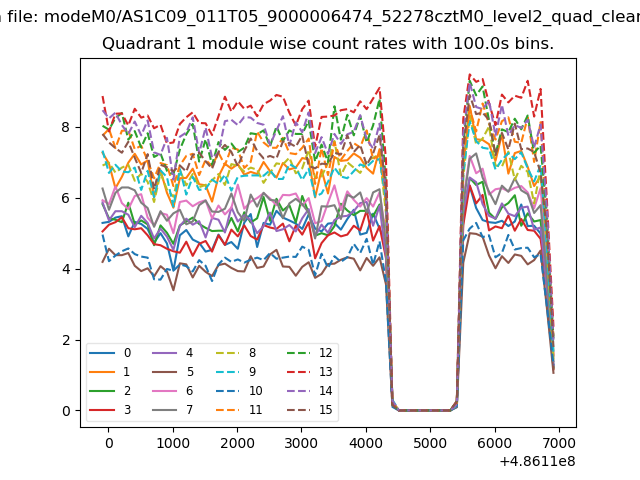
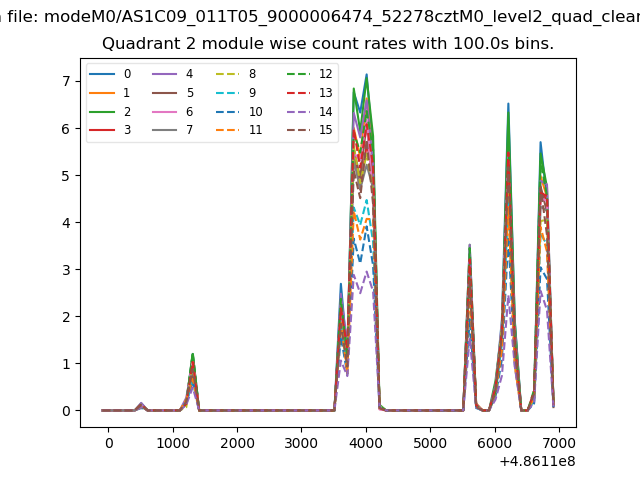
| Quadrant-wise count rates Data is divided into 100 sec bins |
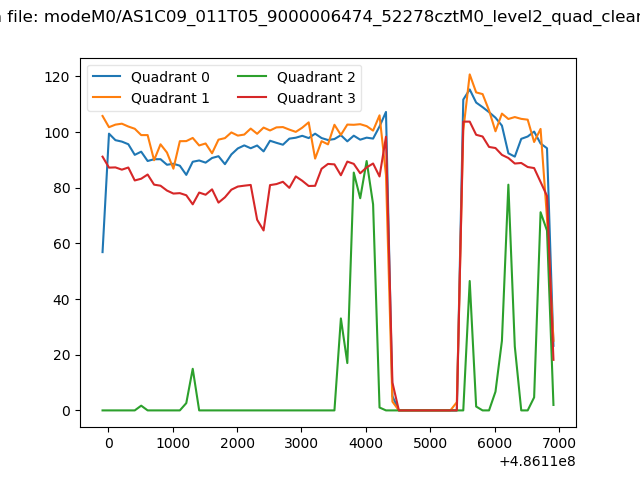 |
|
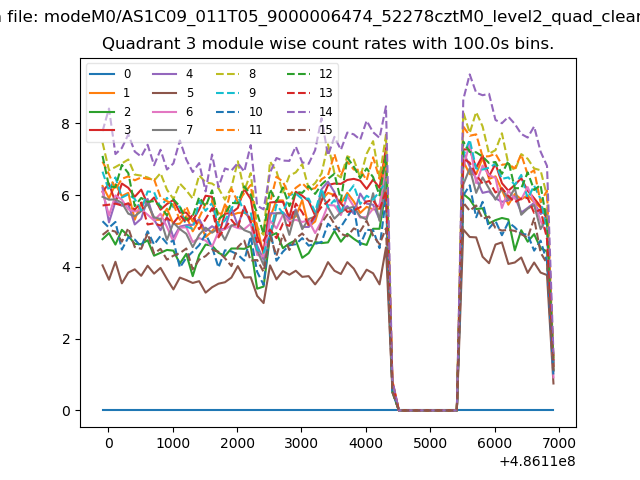
| Module-wise count rates for Quadrant A Data is divided into 100 sec bins |
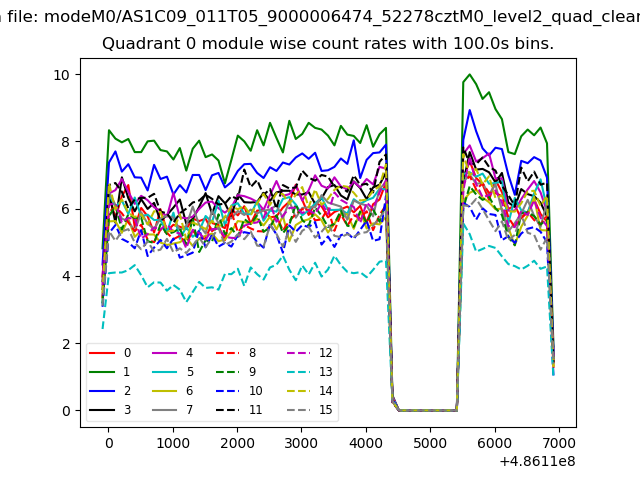 |
 |
| Module-wise count rates for Quadrant B Data is divided into 100 sec bins |
 |
 |
| Module-wise count rates for Quadrant C Data is divided into 100 sec bins |
 |
 |
| Module-wise count rates for Quadrant D Data is divided into 100 sec bins |
 |
 |
| Parameter | Plot |
|---|---|
| CZT HV Monitor | 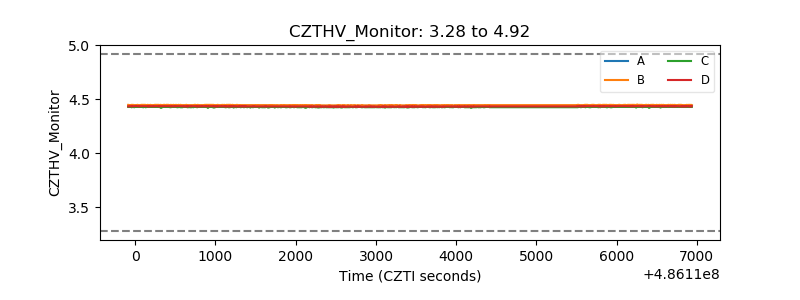 |
| D_VDD | 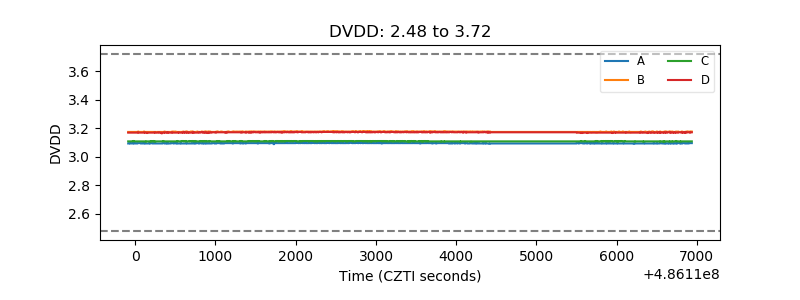 |
| Temperature 1 | 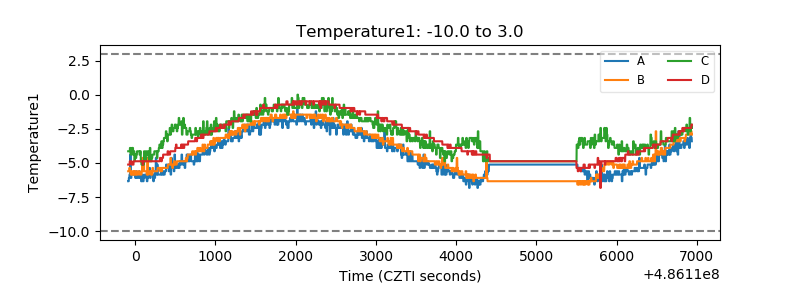 |
| Veto HV Monitor | 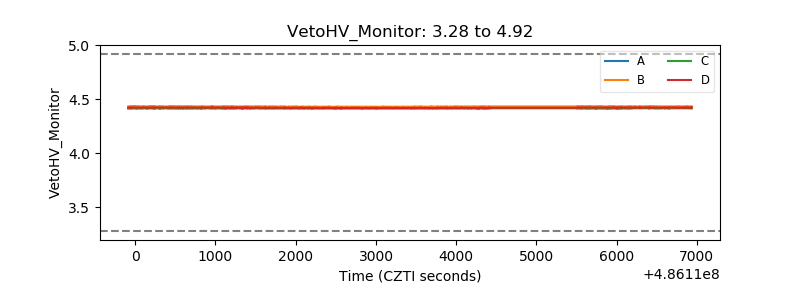 |
| Veto LLD | 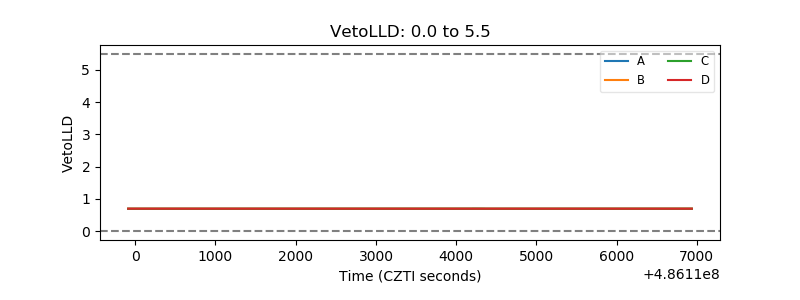 |
| Alpha Counter | 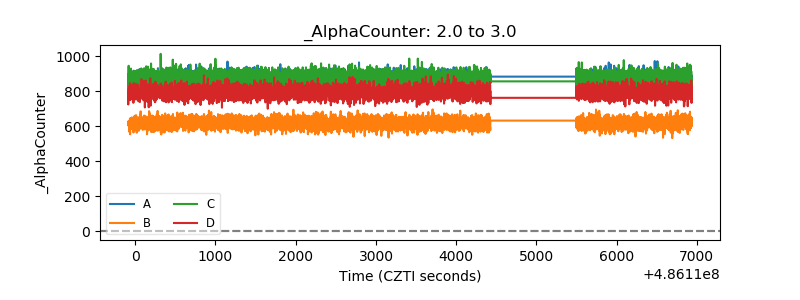 |
| _CPM_Rate | 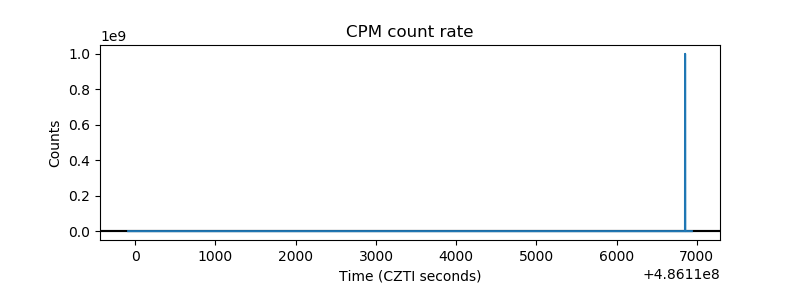 |
| CZT Counter | 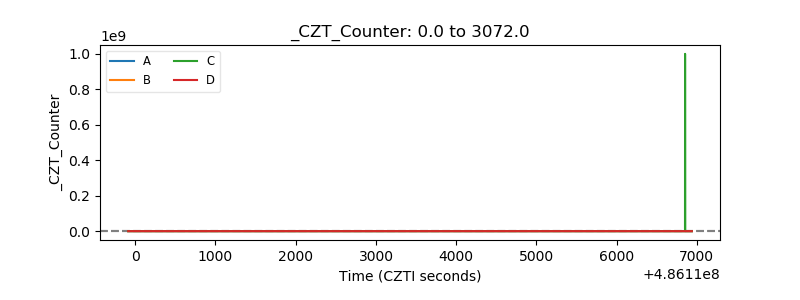 |
| +2.5 Volts monitor |  |
| +5 Volts monitor |  |
| _ROLL_ROT | 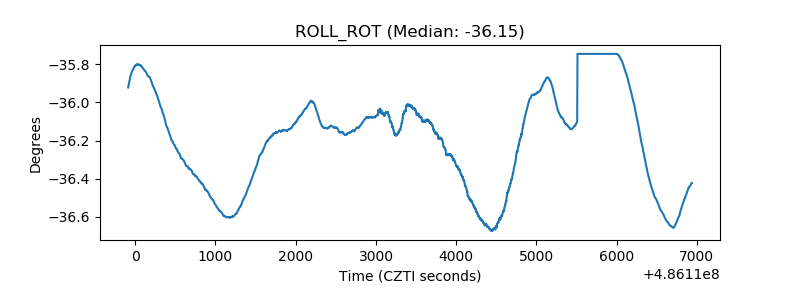 |
| _Roll_DEC | 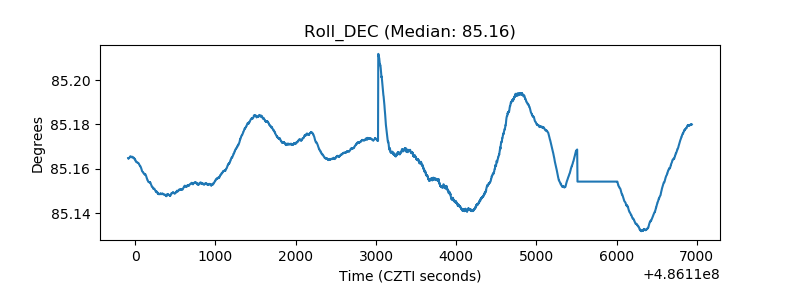 |
| _Roll_RA | 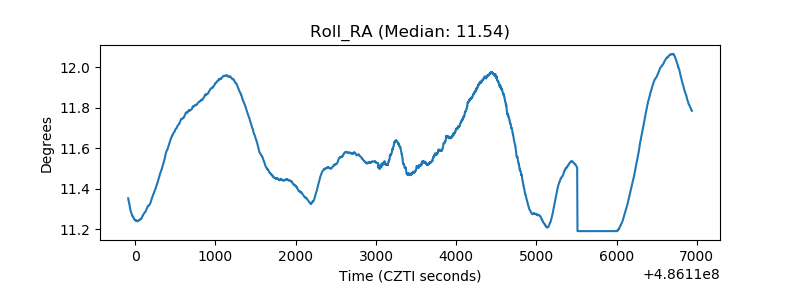 |
| Veto Counter | 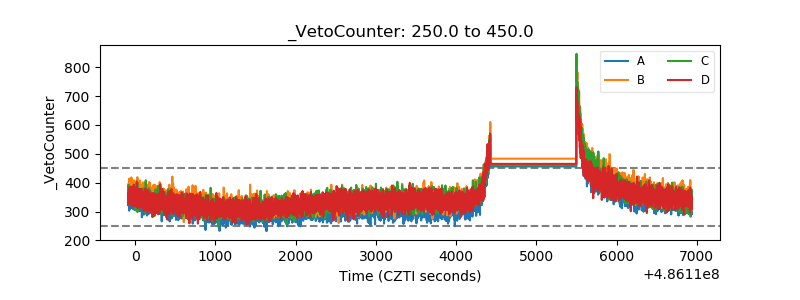 |