| Param | Original file | Final file |
|---|---|---|
| Filename | modeM0/AS1C09_011T05_9000006474_52284cztM0_level2.fits | modeM0/AS1C09_011T05_9000006474_52284cztM0_level2_quad_clean.evt |
| Size (bytes) | 1,077,586,560 | 77,587,200 |
| Size | 1.0 GB | 74.0 MB |
| Events in quadrant A | 4,274,330 | 699,534 |
| Events in quadrant B | 7,408,701 | 703,990 |
| Events in quadrant C | 15,855,987 | 4,075 |
| Events in quadrant D | 11,763,237 | 414,274 |
| Mode M0 | |||
|---|---|---|---|
| Quadrant | BADHDUFLAG | Total packets | Discarded packets |
| A | 0 | 18028 | 2 |
| B | 0 | 27269 | 0 |
| C | 0 | 52281 | 0 |
| D | 0 | 40193 | 0 |
| Mode SS | |||
|---|---|---|---|
| Quadrant | BADHDUFLAG | Total packets | Discarded packets |
| A | 0 | 152 | 0 |
| B | 0 | 152 | 0 |
| C | 0 | 152 | 0 |
| D | 0 | 152 | 0 |
| Quadrant | Total seconds | Saturated seconds | Saturation percentage |
|---|---|---|---|
| A | 7572 | 183 | 2.416799% |
| B | 7573 | 771 | 10.180906% |
| C | 7573 | 7539 | 99.551037% |
| D | 7573 | 2996 | 39.561600% |
Noise dominated data is calculated using 1-second bins in cleaned event files. If a bin has >2000 counts, and if more than 50% of those come from <1% of pixels, then it is considered to be noise-dominated and hence unusable.
| Quadrant | # 1 sec bins | Bins with >0 counts | Bins with >2000 counts | High rate bins dominated by noise | Noise dominated (total time) | Noise dominated (detector-on time) | Marked lightcurve |
|---|---|---|---|---|---|---|---|
| A | 7572 | 7572 | 124 | 124 | 1.64% | 1.64% | 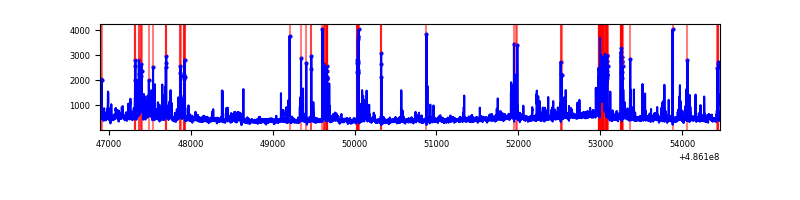 |
| B | 7573 | 7573 | 460 | 460 | 6.07% | 6.07% | 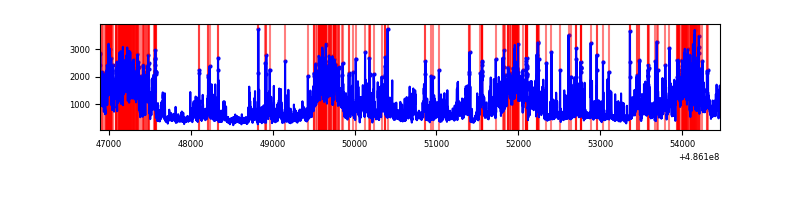 |
| C | 7572 | 7572 | 4928 | 4928 | 65.08% | 65.08% | 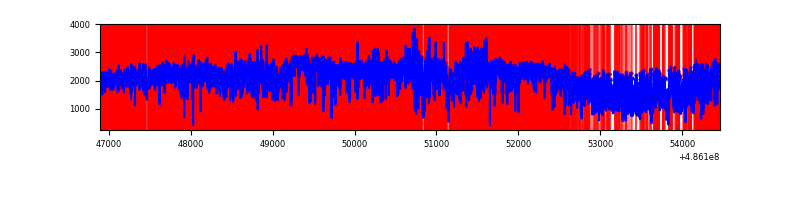 |
| D | 7573 | 7573 | 2659 | 2659 | 35.11% | 35.11% | 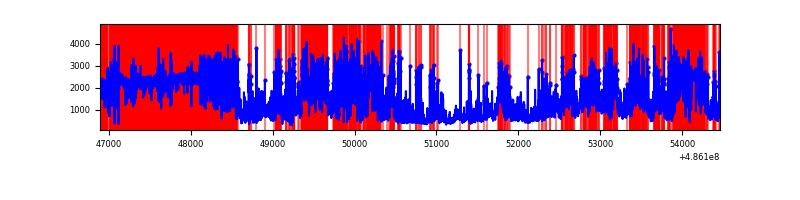 |
Top three noisy pixels from each quadrant. If the there are fewer than three noisy pixels in the level2.evt file, extra rows are filled as -1
| Pixel properties | Quadrant properties | ||||||
|---|---|---|---|---|---|---|---|
| Quadrant | DetID | PixID | Counts | Sigma | Mean | Median | Sigma |
| A | 4 | 249 | 384816 | 1965.34 | 787 | 767 | 195.4 |
| A | 7 | 206 | 254317 | 1297.52 | 787 | 767 | 195.4 |
| A | 5 | 240 | 69351 | 350.97 | 787 | 767 | 195.4 |
| B | 7 | 0 | 1695592 | 10439.08 | 765 | 738 | 162.4 |
| B | 4 | 81 | 840775 | 5174.02 | 765 | 738 | 162.4 |
| B | 0 | 213 | 380024 | 2336.13 | 765 | 738 | 162.4 |
| C | 15 | 178 | 6357293 | 152246.19 | 145 | 143 | 41.8 |
| C | 15 | 158 | 3504158 | 83916.99 | 145 | 143 | 41.8 |
| C | 0 | 161 | 2807943 | 67243.47 | 145 | 143 | 41.8 |
| D | 7 | 60 | 3084479 | 17893.15 | 599 | 572 | 172.4 |
| D | 12 | 18 | 1890218 | 10963.92 | 599 | 572 | 172.4 |
| D | 15 | 93 | 1507424 | 8742.91 | 599 | 572 | 172.4 |
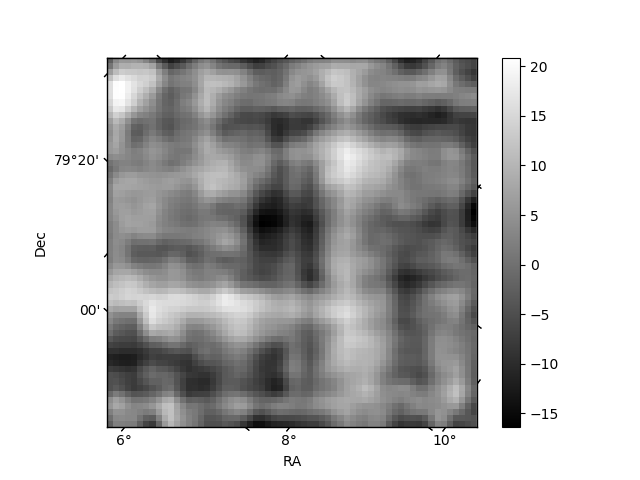
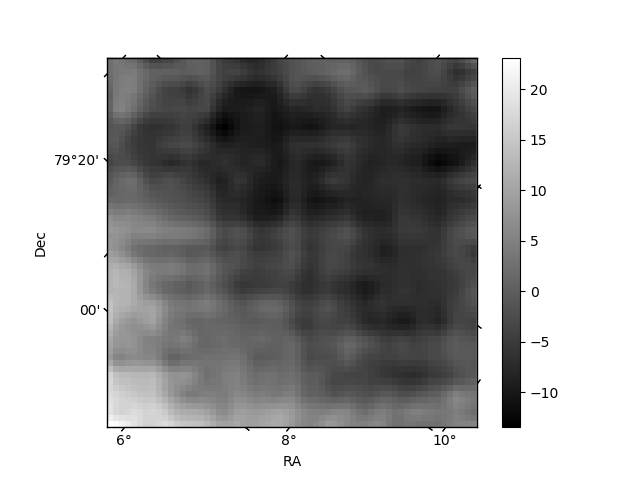
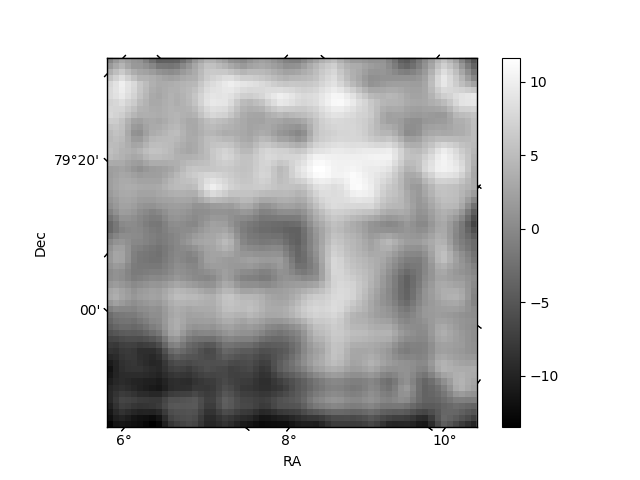
Histogram calculated using DETX and DETY for each event in the final _common_clean file
| Quadrant A | 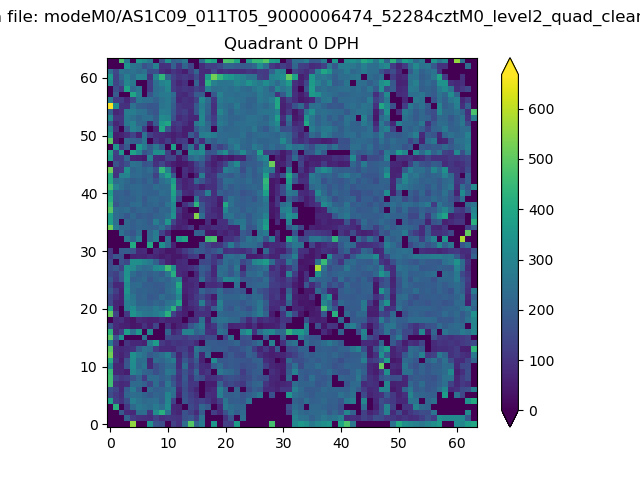 |
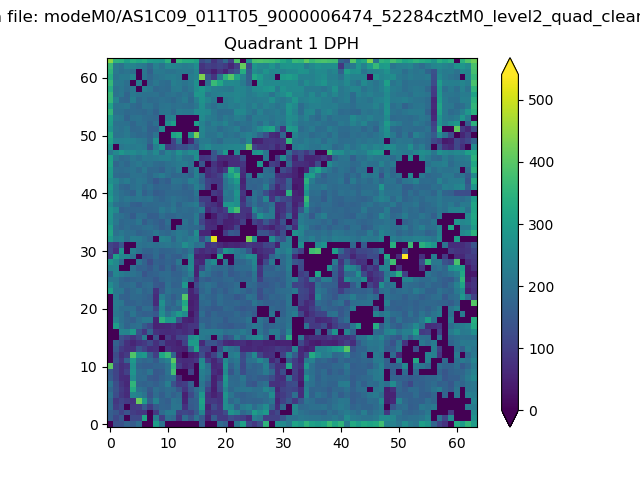 |
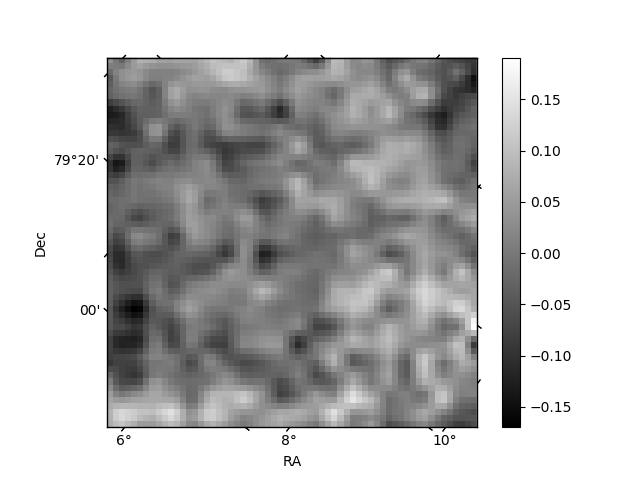
Quadrant B |
|---|---|---|---|
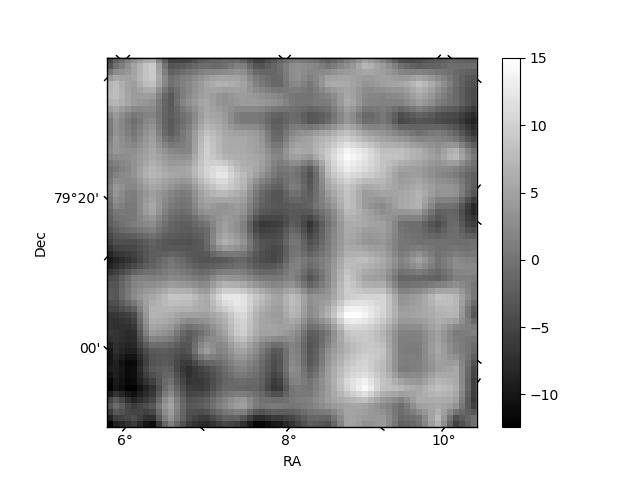
| Quadrant D |  |
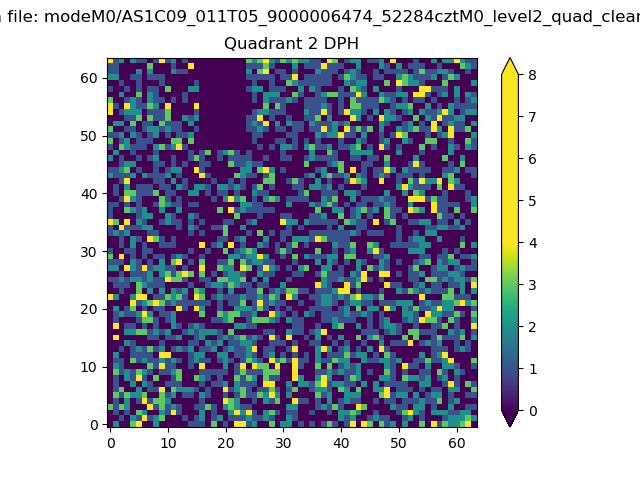 |
Quadrant C |
| Plot type | Count rate plots | Images |
|---|---|---|
| Comparison with Poisson distribution Blue bars denote a histogram of data divided into 1 sec bins. Red curve is a Poisson curve with rate = median count rate of data. |
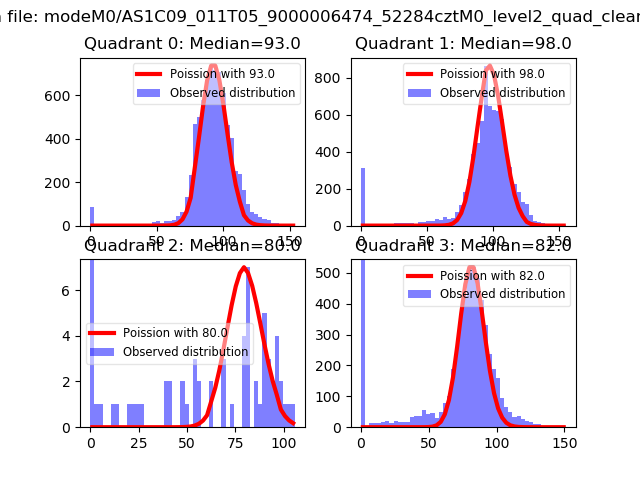 |
 |
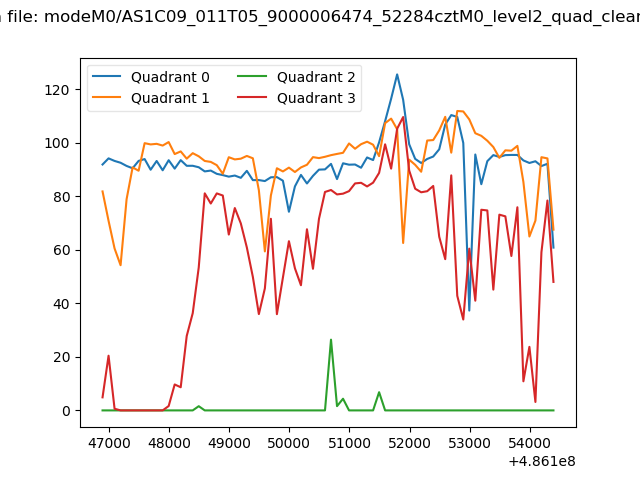
| Quadrant-wise count rates Data is divided into 100 sec bins |
 |
|
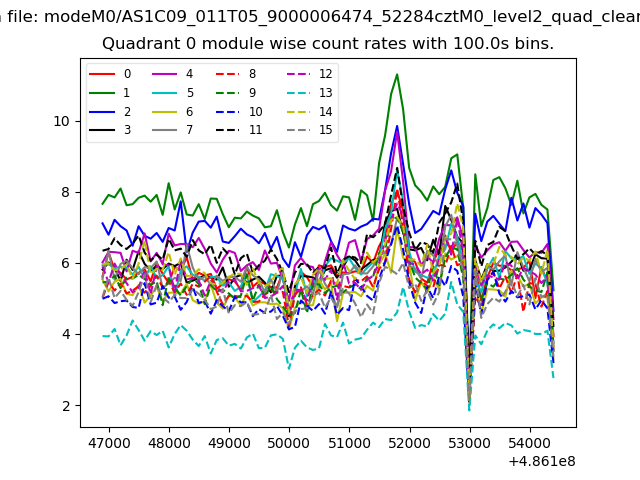
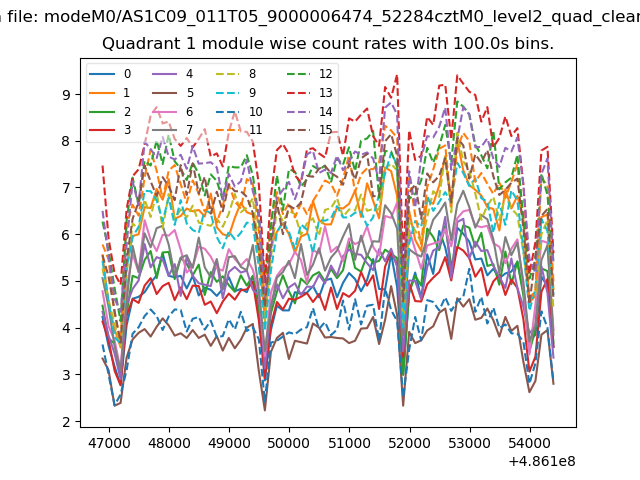
| Module-wise count rates for Quadrant A Data is divided into 100 sec bins |
 |
 |
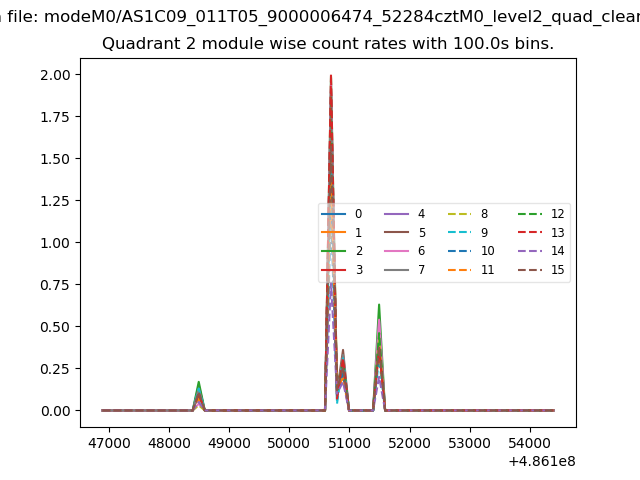
| Module-wise count rates for Quadrant B Data is divided into 100 sec bins |
 |
 |
| Module-wise count rates for Quadrant C Data is divided into 100 sec bins |
 |
 |
| Module-wise count rates for Quadrant D Data is divided into 100 sec bins |
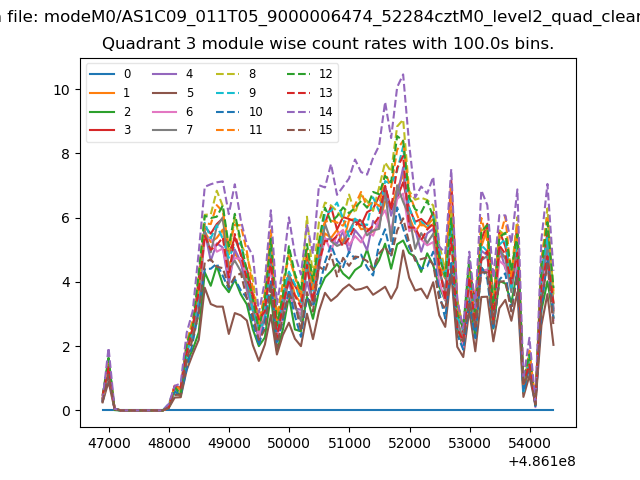 |
 |
| Parameter | Plot |
|---|---|
| CZT HV Monitor | 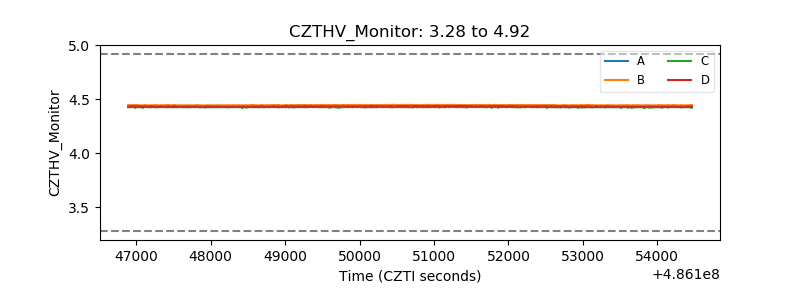 |
| D_VDD | 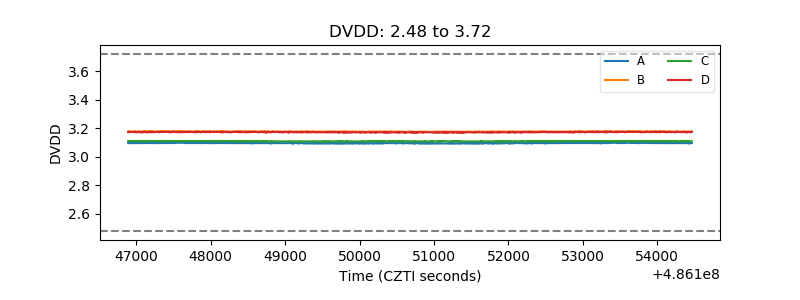 |
| Temperature 1 | 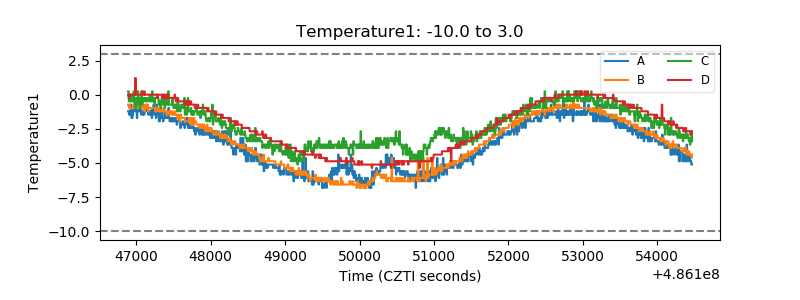 |
| Veto HV Monitor | 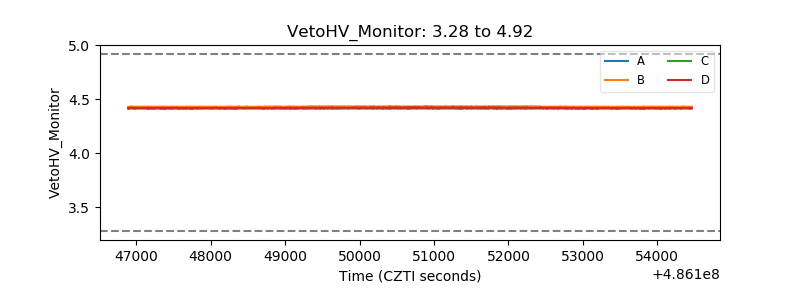 |
| Veto LLD | 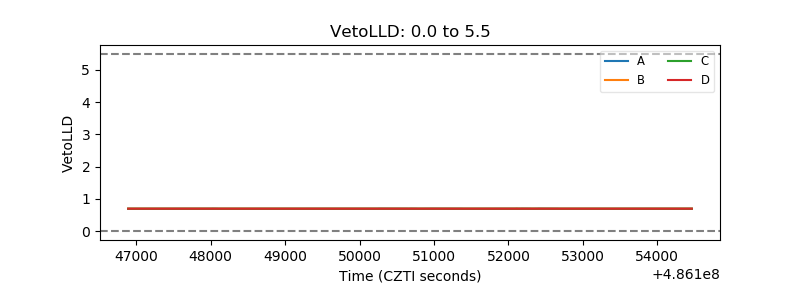 |
| Alpha Counter | 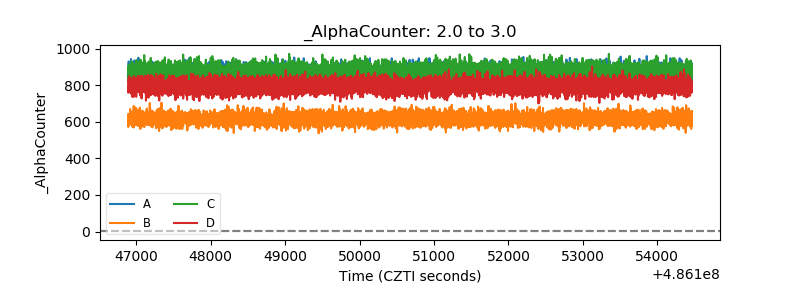 |
| _CPM_Rate | 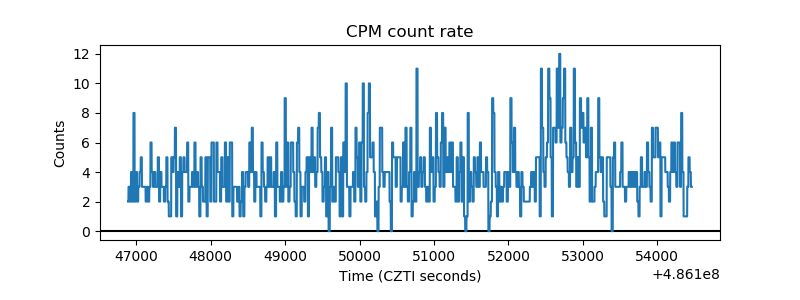 |
| CZT Counter |  |
| +2.5 Volts monitor |  |
| +5 Volts monitor |  |
| _ROLL_ROT | 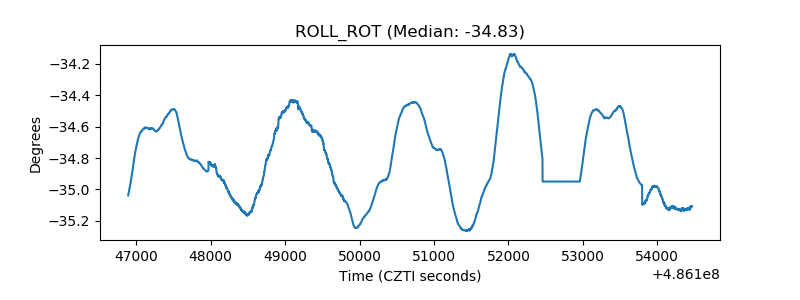 |
| _Roll_DEC | 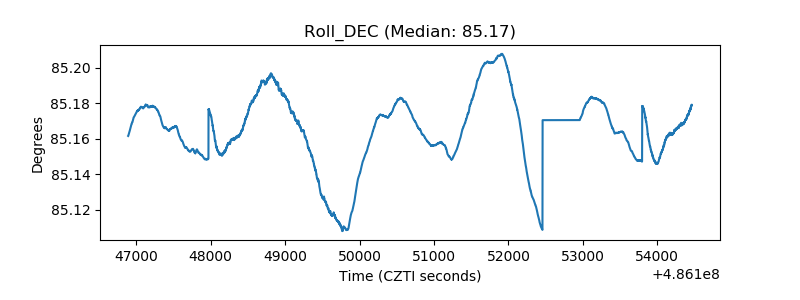 |
| _Roll_RA | 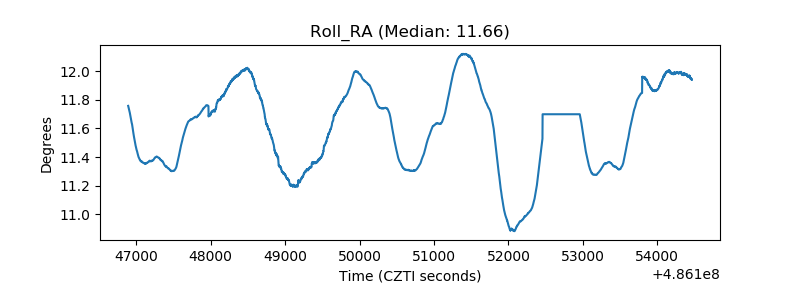 |
| Veto Counter | 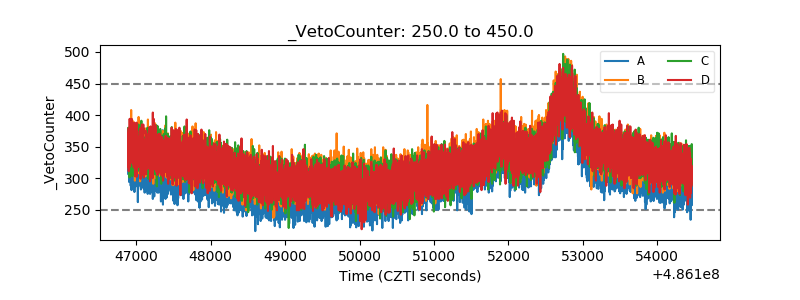 |