| Param | Original file | Final file |
|---|---|---|
| Filename | modeM0/AS1C09_011T05_9000006474_52285cztM0_level2.fits | modeM0/AS1C09_011T05_9000006474_52285cztM0_level2_quad_clean.evt |
| Size (bytes) | 1,075,089,600 | 80,369,280 |
| Size | 1.0 GB | 76.6 MB |
| Events in quadrant A | 4,681,956 | 713,625 |
| Events in quadrant B | 7,027,060 | 739,206 |
| Events in quadrant C | 15,923,953 | 11,508 |
| Events in quadrant D | 11,554,469 | 423,073 |
| Mode M0 | |||
|---|---|---|---|
| Quadrant | BADHDUFLAG | Total packets | Discarded packets |
| A | 0 | 19476 | 0 |
| B | 0 | 26327 | 0 |
| C | 0 | 52694 | 0 |
| D | 0 | 39785 | 0 |
| Mode SS | |||
|---|---|---|---|
| Quadrant | BADHDUFLAG | Total packets | Discarded packets |
| A | 0 | 156 | 0 |
| B | 0 | 156 | 0 |
| C | 0 | 156 | 0 |
| D | 0 | 156 | 0 |
| Quadrant | Total seconds | Saturated seconds | Saturation percentage |
|---|---|---|---|
| A | 7851 | 303 | 3.859381% |
| B | 7851 | 677 | 8.623105% |
| C | 7850 | 7740 | 98.598726% |
| D | 7850 | 3019 | 38.458599% |
Noise dominated data is calculated using 1-second bins in cleaned event files. If a bin has >2000 counts, and if more than 50% of those come from <1% of pixels, then it is considered to be noise-dominated and hence unusable.
| Quadrant | # 1 sec bins | Bins with >0 counts | Bins with >2000 counts | High rate bins dominated by noise | Noise dominated (total time) | Noise dominated (detector-on time) | Marked lightcurve |
|---|---|---|---|---|---|---|---|
| A | 7851 | 7851 | 202 | 202 | 2.57% | 2.57% | 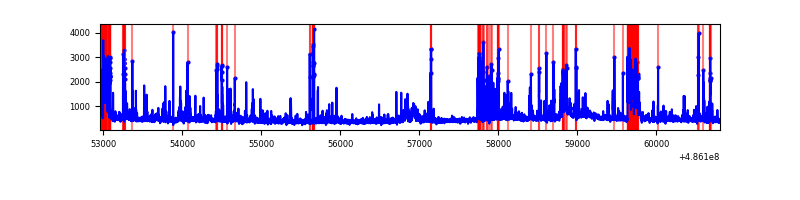 |
| B | 7851 | 7851 | 375 | 375 | 4.78% | 4.78% | 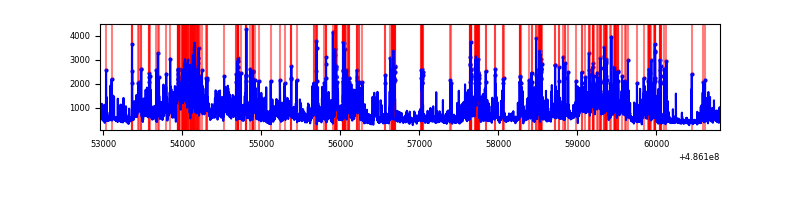 |
| C | 7849 | 7849 | 4589 | 4589 | 58.47% | 58.47% | 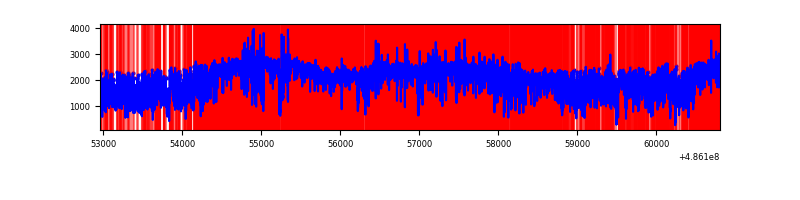 |
| D | 7850 | 7850 | 2658 | 2658 | 33.86% | 33.86% | 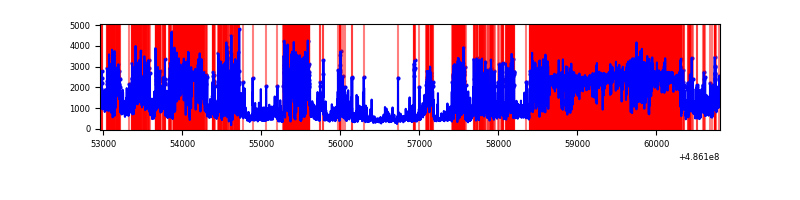 |
Top three noisy pixels from each quadrant. If the there are fewer than three noisy pixels in the level2.evt file, extra rows are filled as -1
| Pixel properties | Quadrant properties | ||||||
|---|---|---|---|---|---|---|---|
| Quadrant | DetID | PixID | Counts | Sigma | Mean | Median | Sigma |
| A | 4 | 249 | 522588 | 2561.85 | 819 | 799 | 203.7 |
| A | 3 | 114 | 171570 | 838.44 | 819 | 799 | 203.7 |
| A | 5 | 240 | 127482 | 621.98 | 819 | 799 | 203.7 |
| B | 7 | 0 | 1127979 | 6610.58 | 806 | 779 | 170.5 |
| B | 10 | 254 | 435545 | 2549.73 | 806 | 779 | 170.5 |
| B | 4 | 171 | 404682 | 2368.73 | 806 | 779 | 170.5 |
| C | 15 | 178 | 6318484 | 131466.58 | 168 | 166 | 48.1 |
| C | 0 | 161 | 4055489 | 84379.97 | 168 | 166 | 48.1 |
| C | 15 | 158 | 3346885 | 69635.89 | 168 | 166 | 48.1 |
| D | 7 | 60 | 3941147 | 22046.66 | 621 | 591 | 178.7 |
| D | 12 | 18 | 1416226 | 7920.21 | 621 | 591 | 178.7 |
| D | 15 | 93 | 1309159 | 7321.19 | 621 | 591 | 178.7 |
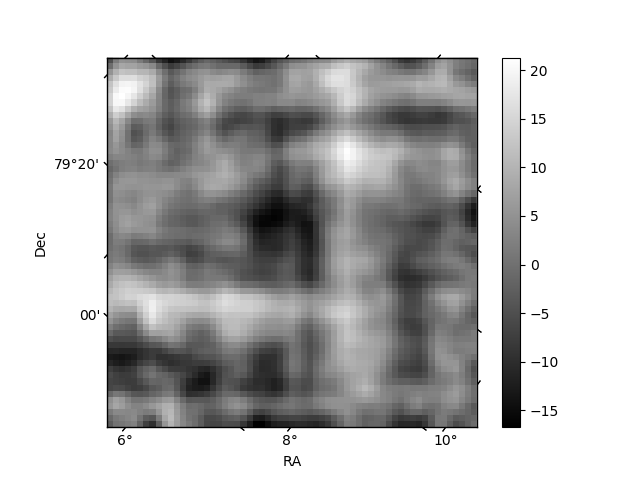
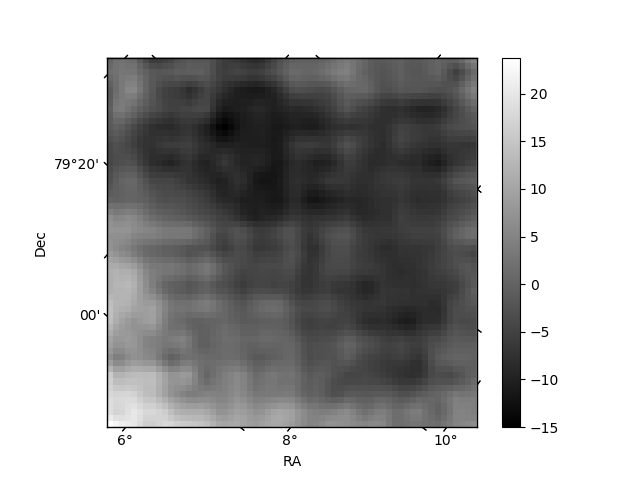
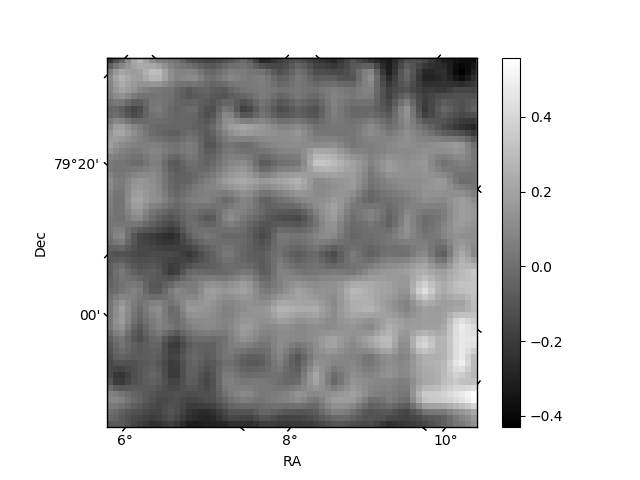
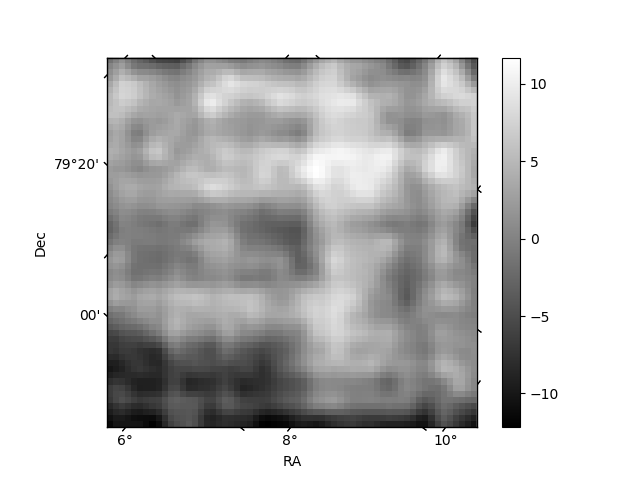
Histogram calculated using DETX and DETY for each event in the final _common_clean file
| Quadrant A | 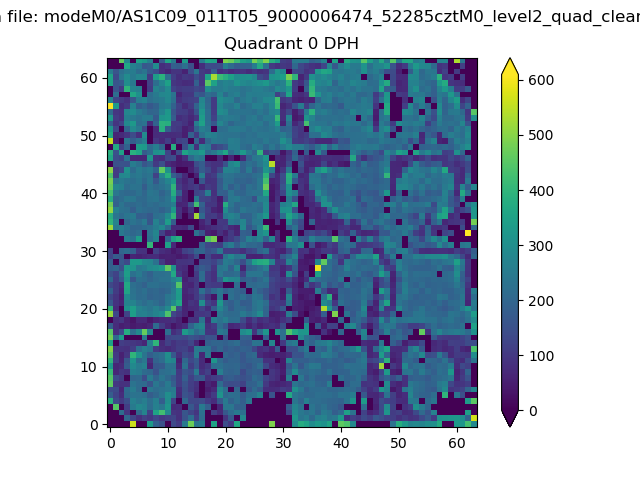 |
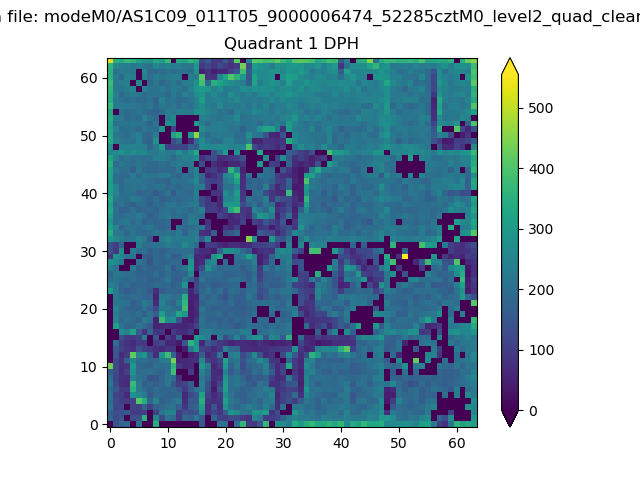 |
Quadrant B |
|---|---|---|---|
| Quadrant D | 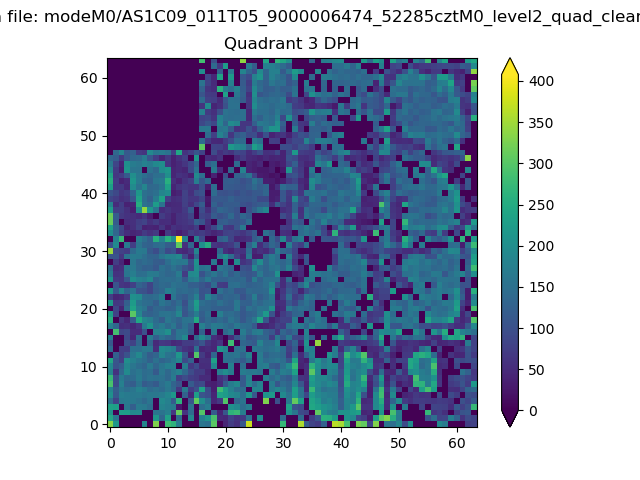 |
 |
Quadrant C |
| Plot type | Count rate plots | Images |
|---|---|---|
| Comparison with Poisson distribution Blue bars denote a histogram of data divided into 1 sec bins. Red curve is a Poisson curve with rate = median count rate of data. |
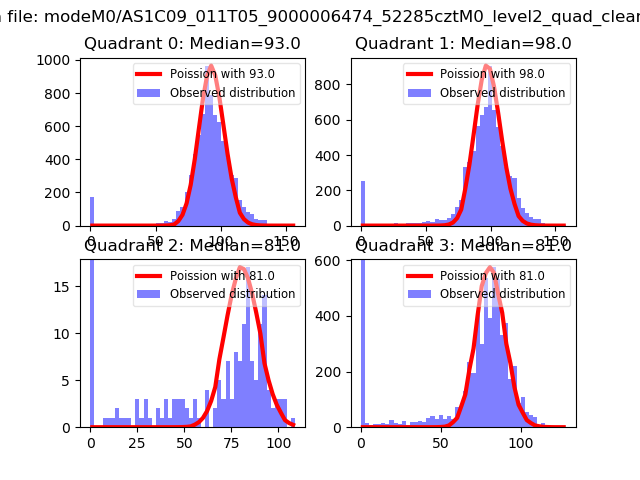 |
 |
| Quadrant-wise count rates Data is divided into 100 sec bins |
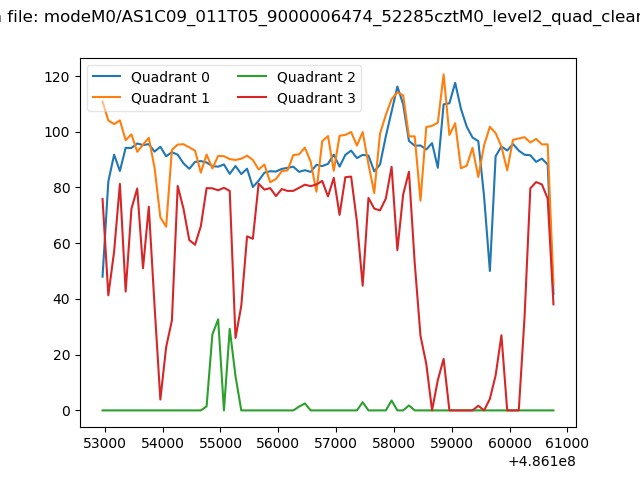 |
|
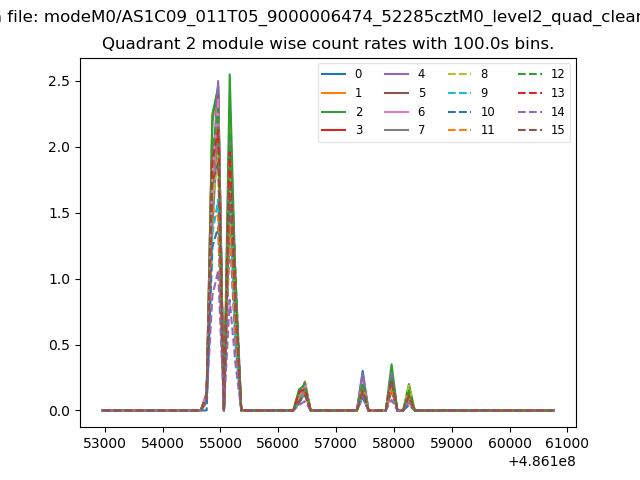
| Module-wise count rates for Quadrant A Data is divided into 100 sec bins |
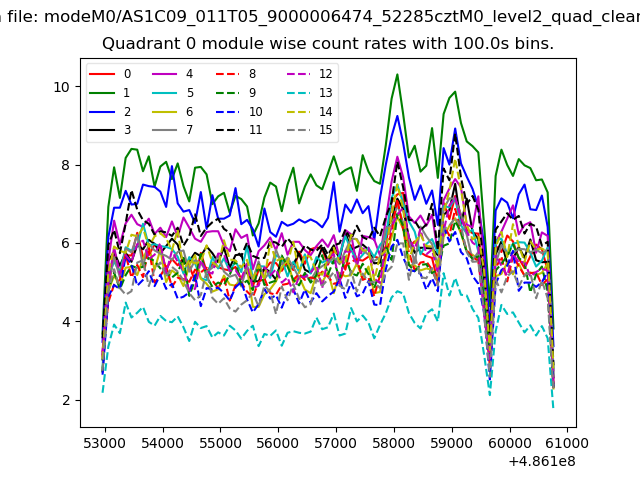 |
 |
| Module-wise count rates for Quadrant B Data is divided into 100 sec bins |
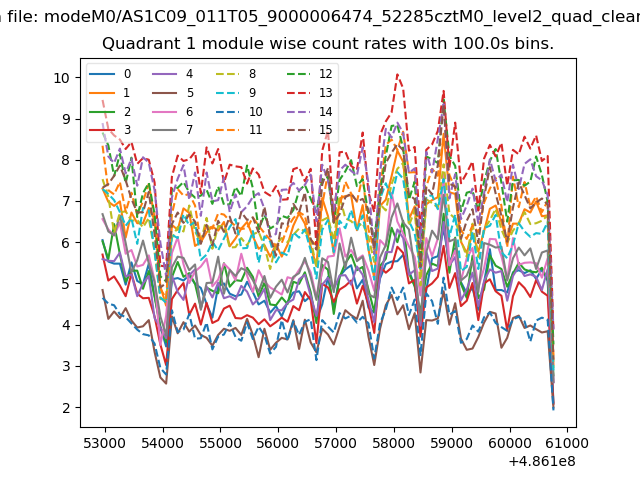 |
 |
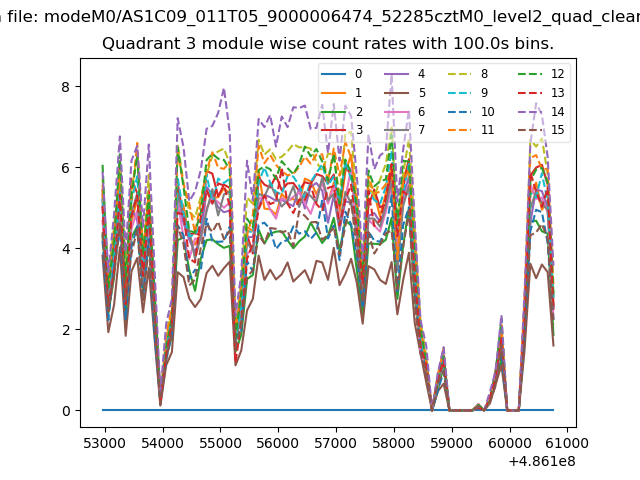
| Module-wise count rates for Quadrant C Data is divided into 100 sec bins |
 |
 |
| Module-wise count rates for Quadrant D Data is divided into 100 sec bins |
 |
 |
| Parameter | Plot |
|---|---|
| CZT HV Monitor | 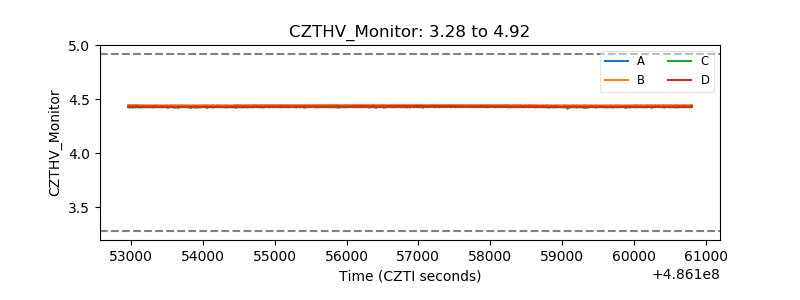 |
| D_VDD | 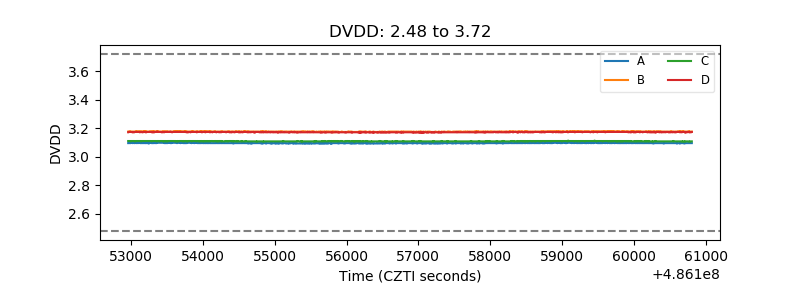 |
| Temperature 1 | 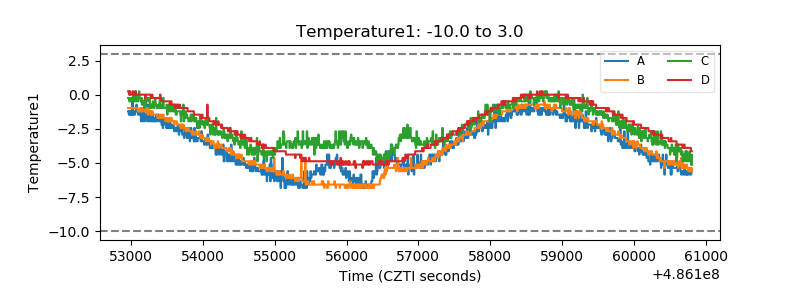 |
| Veto HV Monitor | 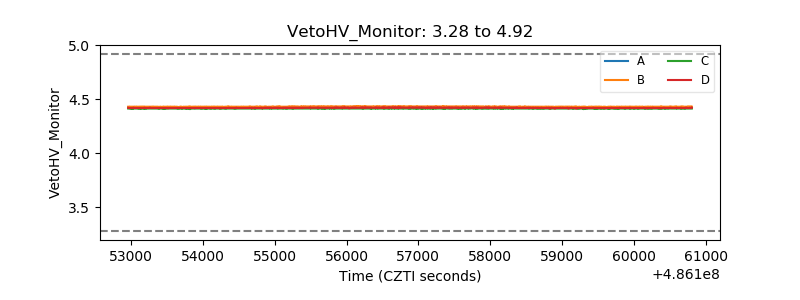 |
| Veto LLD | 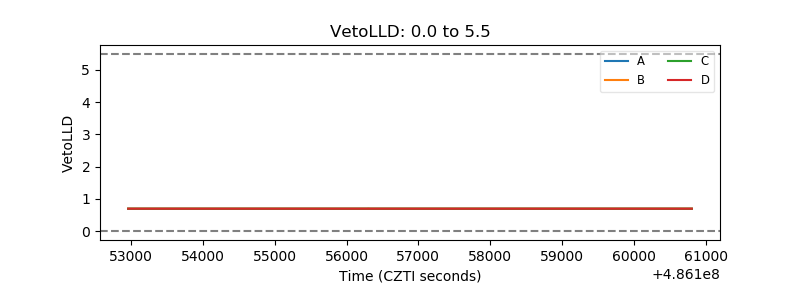 |
| Alpha Counter | 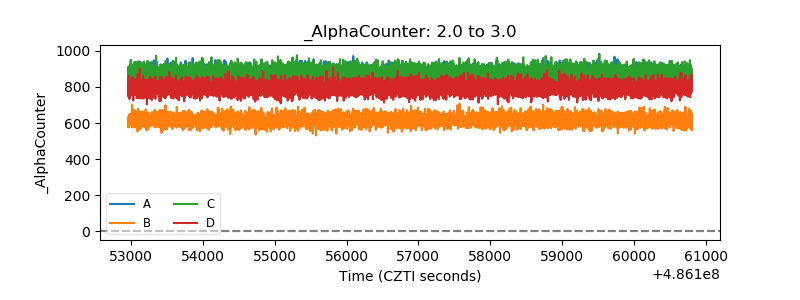 |
| _CPM_Rate | 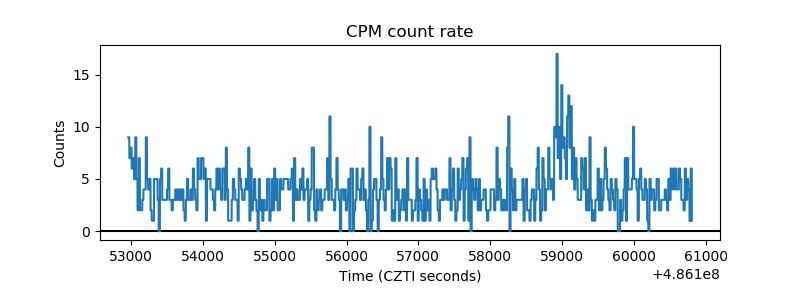 |
| CZT Counter | 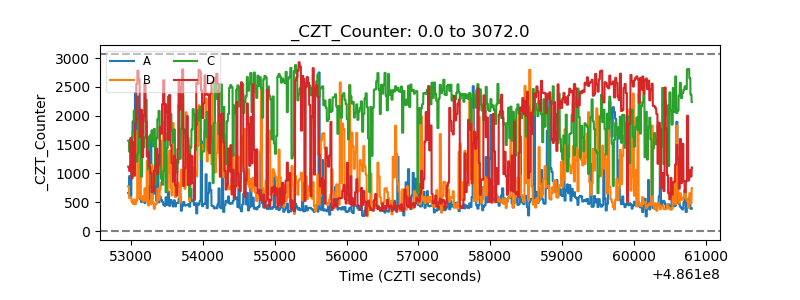 |
| +2.5 Volts monitor |  |
| +5 Volts monitor | 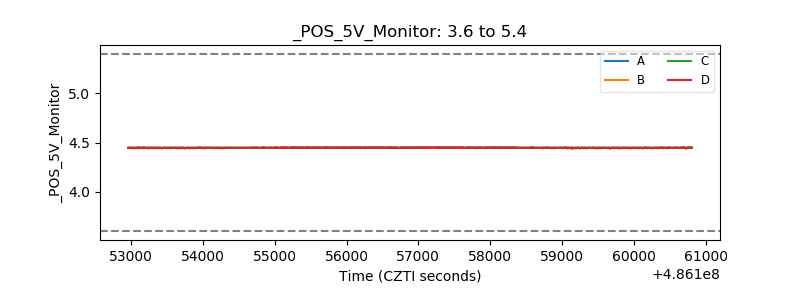 |
| _ROLL_ROT | 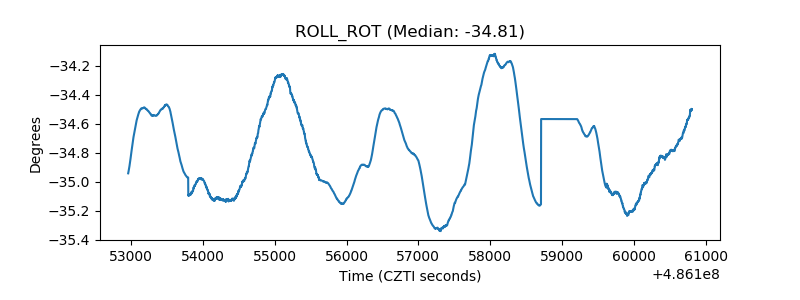 |
| _Roll_DEC | 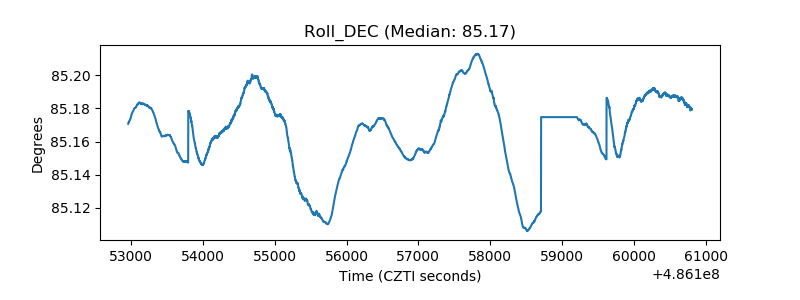 |
| _Roll_RA | 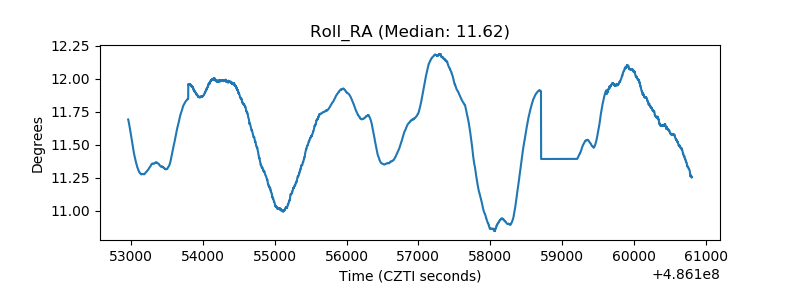 |
| Veto Counter | 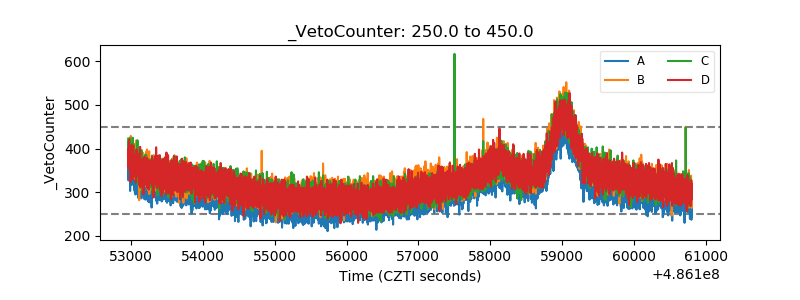 |