| Param | Original file | Final file |
|---|---|---|
| Filename | modeM0/AS1C09_011T05_9000006474_52292cztM0_level2.fits | modeM0/AS1C09_011T05_9000006474_52292cztM0_level2_quad_clean.evt |
| Size (bytes) | 843,232,320 | 76,006,080 |
| Size | 804.2 MB | 72.5 MB |
| Events in quadrant A | 3,218,533 | 722,306 |
| Events in quadrant B | 4,256,850 | 690,509 |
| Events in quadrant C | 13,265,604 | 113,959 |
| Events in quadrant D | 10,000,438 | 348,854 |
| Mode M0 | |||
|---|---|---|---|
| Quadrant | BADHDUFLAG | Total packets | Discarded packets |
| A | 0 | 14050 | 1 |
| B | 0 | 16869 | 1 |
| C | 0 | 43592 | 6 |
| D | 0 | 33871 | 1 |
| Mode SS | |||
|---|---|---|---|
| Quadrant | BADHDUFLAG | Total packets | Discarded packets |
| A | 0 | 124 | 0 |
| B | 0 | 124 | 0 |
| C | 0 | 124 | 0 |
| D | 0 | 124 | 0 |
| Mode M9 | |||
|---|---|---|---|
| Quadrant | BADHDUFLAG | Total packets | Discarded packets |
| A | 0 | 11 | 0 |
| B | 0 | 11 | 0 |
| C | 0 | 11 | 0 |
| D | 0 | 11 | 0 |
| Quadrant | Total seconds | Saturated seconds | Saturation percentage |
|---|---|---|---|
| A | 6095 | 113 | 1.853979% |
| B | 6096 | 213 | 3.494094% |
| C | 6095 | 5259 | 86.283839% |
| D | 6095 | 2389 | 39.196062% |
Noise dominated data is calculated using 1-second bins in cleaned event files. If a bin has >2000 counts, and if more than 50% of those come from <1% of pixels, then it is considered to be noise-dominated and hence unusable.
| Quadrant | # 1 sec bins | Bins with >0 counts | Bins with >2000 counts | High rate bins dominated by noise | Noise dominated (total time) | Noise dominated (detector-on time) | Marked lightcurve |
|---|---|---|---|---|---|---|---|
| A | 7195 | 6095 | 35 | 35 | 0.49% | 0.57% | 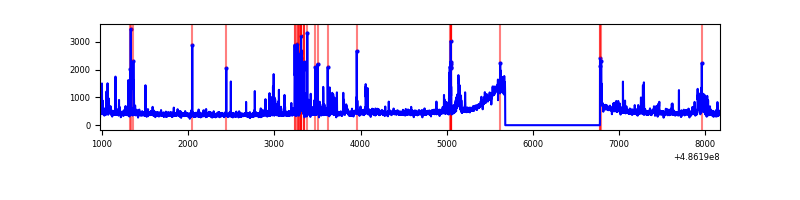 |
| B | 7196 | 6097 | 107 | 107 | 1.49% | 1.75% | 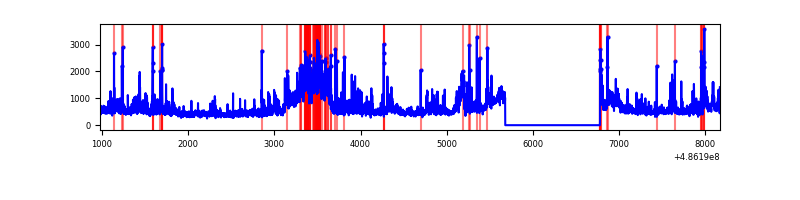 |
| C | 7194 | 6094 | 4240 | 4240 | 58.94% | 69.58% | 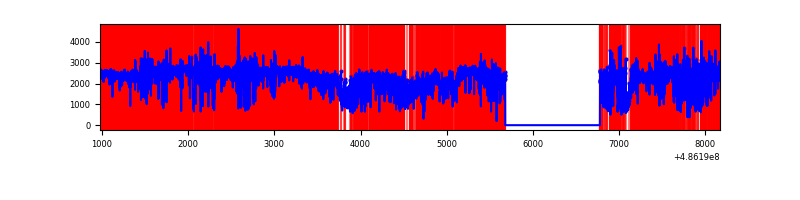 |
| D | 7195 | 6095 | 2262 | 2262 | 31.44% | 37.11% | 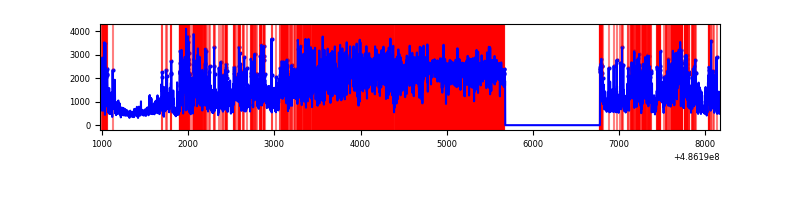 |
Top three noisy pixels from each quadrant. If the there are fewer than three noisy pixels in the level2.evt file, extra rows are filled as -1
| Pixel properties | Quadrant properties | ||||||
|---|---|---|---|---|---|---|---|
| Quadrant | DetID | PixID | Counts | Sigma | Mean | Median | Sigma |
| A | 12 | 3 | 66399 | 345.17 | 692 | 675 | 190.4 |
| A | 13 | 248 | 63277 | 328.77 | 692 | 675 | 190.4 |
| A | 5 | 240 | 62010 | 322.12 | 692 | 675 | 190.4 |
| B | 7 | 0 | 583836 | 4155.95 | 648 | 628 | 140.3 |
| B | 10 | 254 | 313271 | 2227.9 | 648 | 628 | 140.3 |
| B | 4 | 171 | 181368 | 1287.96 | 648 | 628 | 140.3 |
| C | 15 | 178 | 4952559 | 63165.87 | 256 | 252 | 78.4 |
| C | 0 | 161 | 1974995 | 25187.53 | 256 | 252 | 78.4 |
| C | 15 | 158 | 1826598 | 23294.75 | 256 | 252 | 78.4 |
| D | 15 | 93 | 5491150 | 34192.28 | 524 | 499 | 160.6 |
| D | 12 | 1 | 938125 | 5838.94 | 524 | 499 | 160.6 |
| D | 8 | 176 | 577964 | 3596.09 | 524 | 499 | 160.6 |
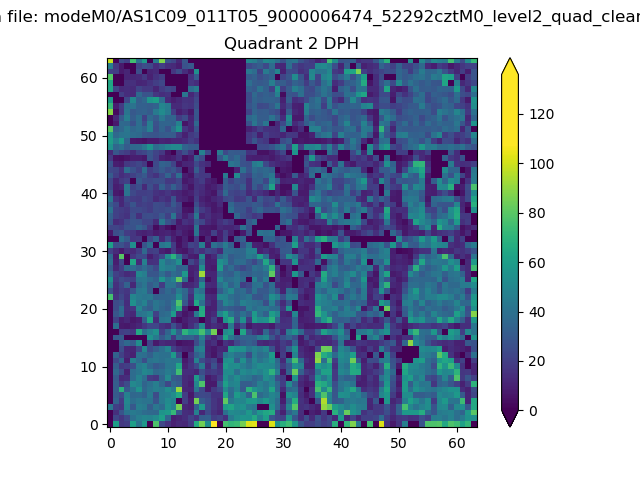
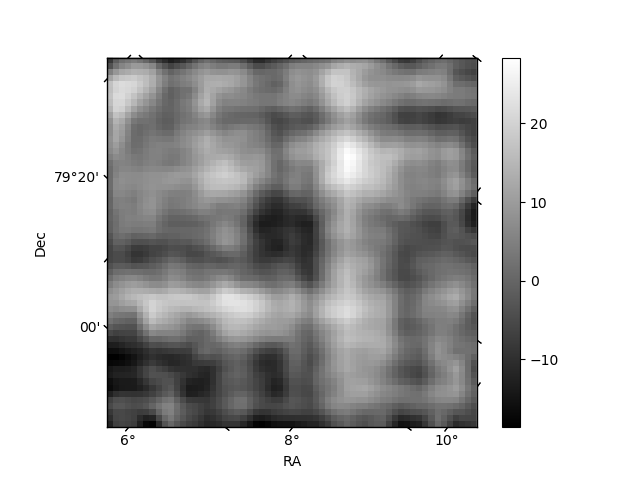
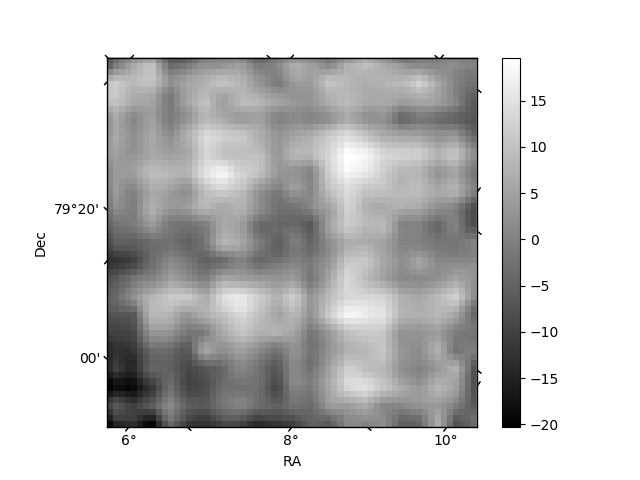
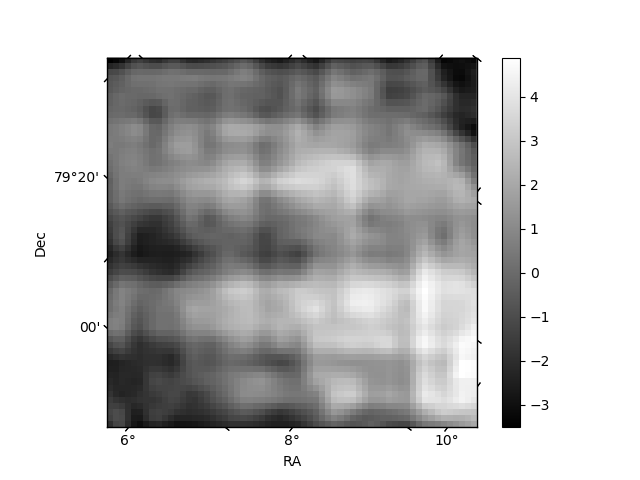
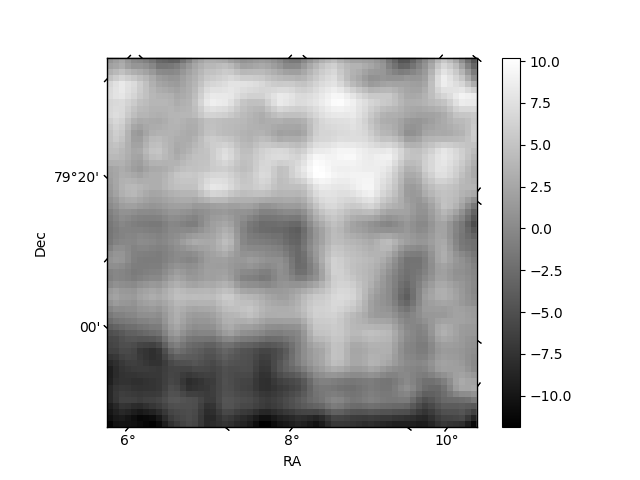
Histogram calculated using DETX and DETY for each event in the final _common_clean file
| Quadrant A | 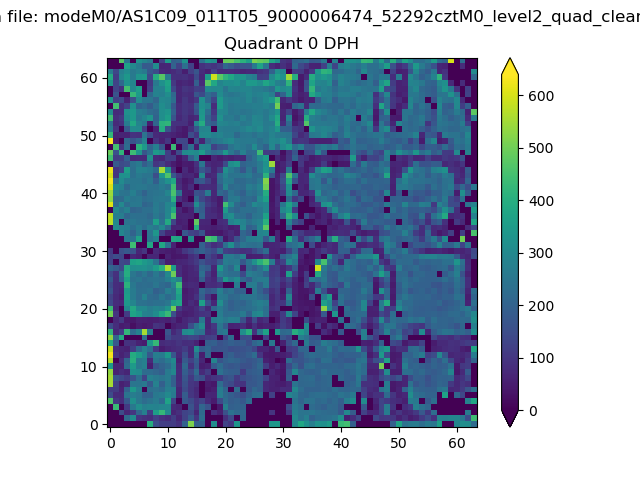 |
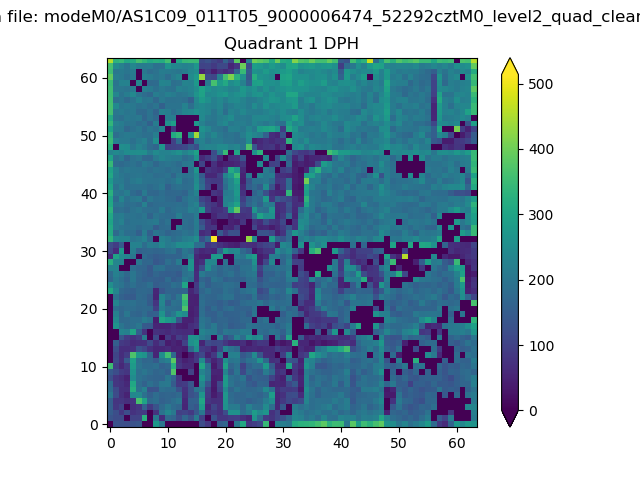 |
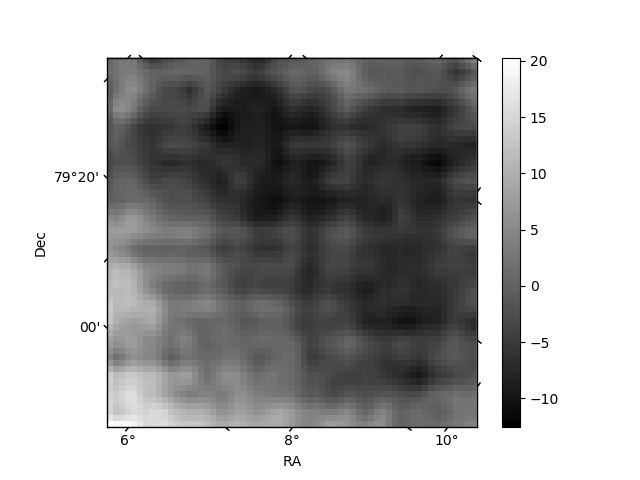
Quadrant B |
|---|---|---|---|
| Quadrant D | 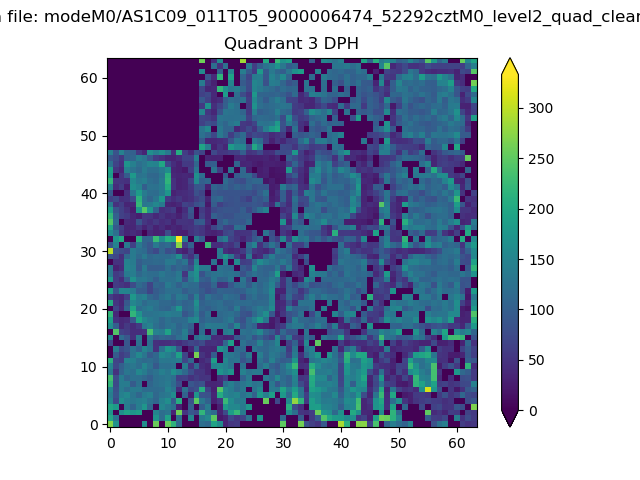 |
 |
Quadrant C |
| Plot type | Count rate plots | Images |
|---|---|---|
| Comparison with Poisson distribution Blue bars denote a histogram of data divided into 1 sec bins. Red curve is a Poisson curve with rate = median count rate of data. |
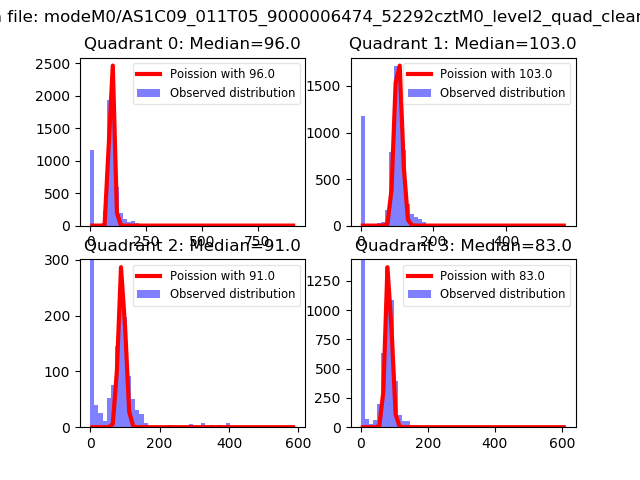 |
 |
| Quadrant-wise count rates Data is divided into 100 sec bins |
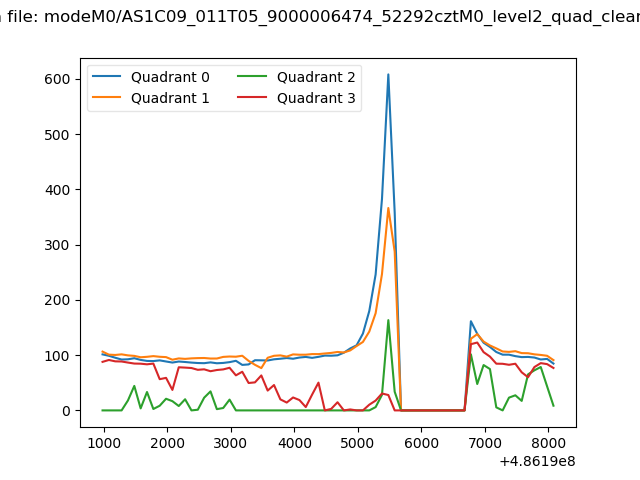 |
|
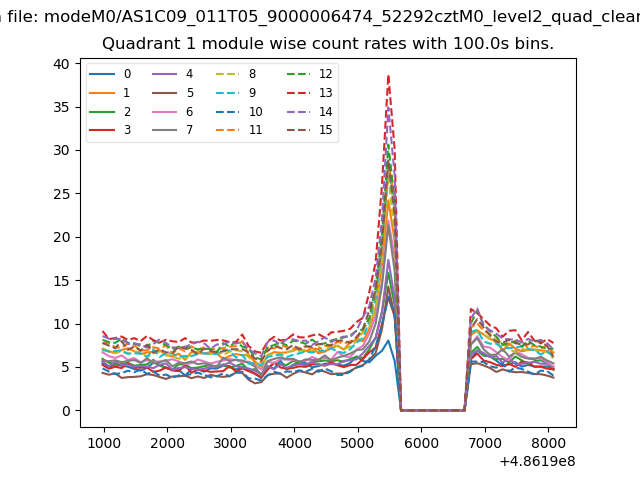
| Module-wise count rates for Quadrant A Data is divided into 100 sec bins |
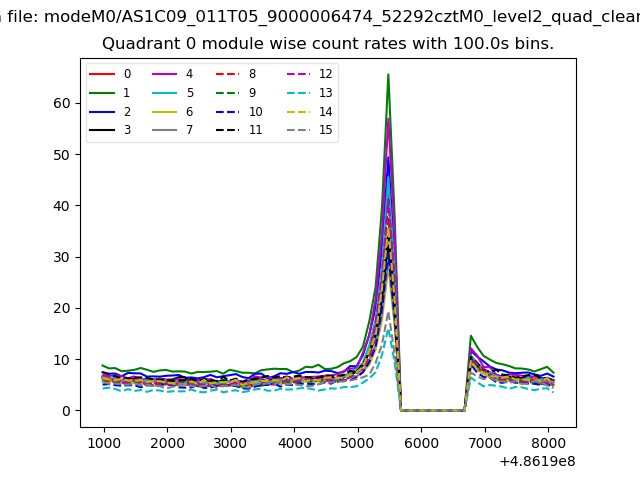 |
 |
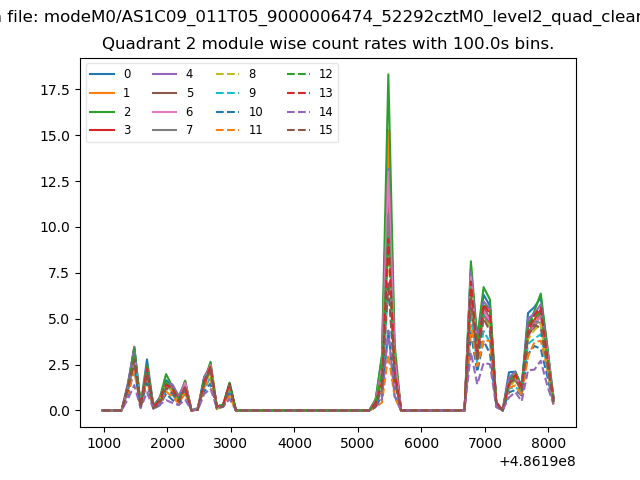
| Module-wise count rates for Quadrant B Data is divided into 100 sec bins |
 |
 |
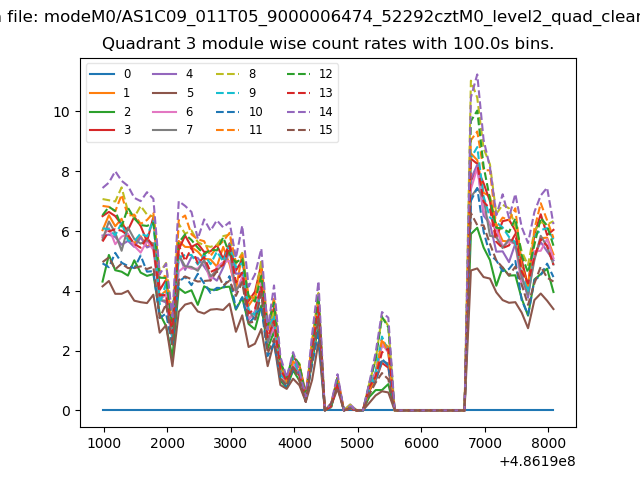
| Module-wise count rates for Quadrant C Data is divided into 100 sec bins |
 |
 |
| Module-wise count rates for Quadrant D Data is divided into 100 sec bins |
 |
 |
| Parameter | Plot |
|---|---|
| CZT HV Monitor |  |
| D_VDD | 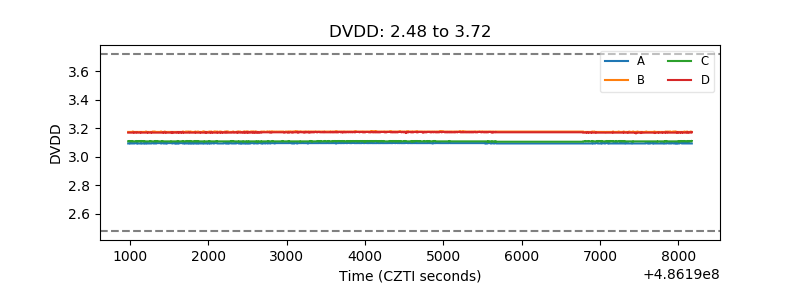 |
| Temperature 1 | 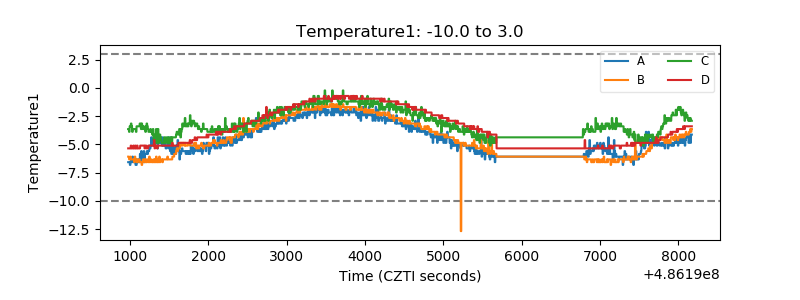 |
| Veto HV Monitor | 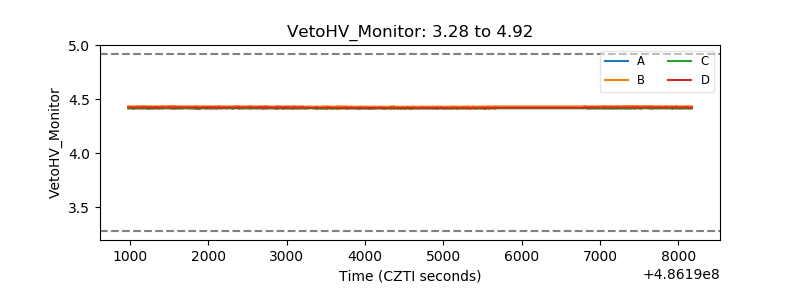 |
| Veto LLD | 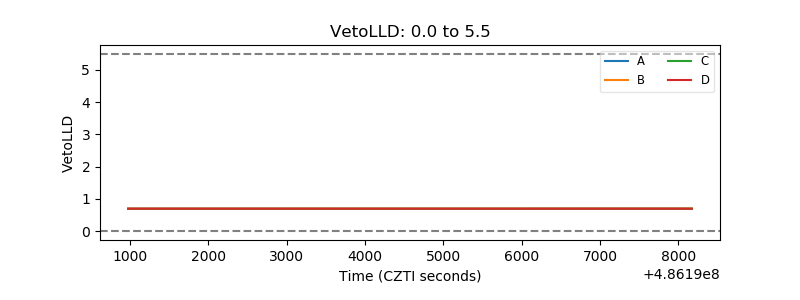 |
| Alpha Counter | 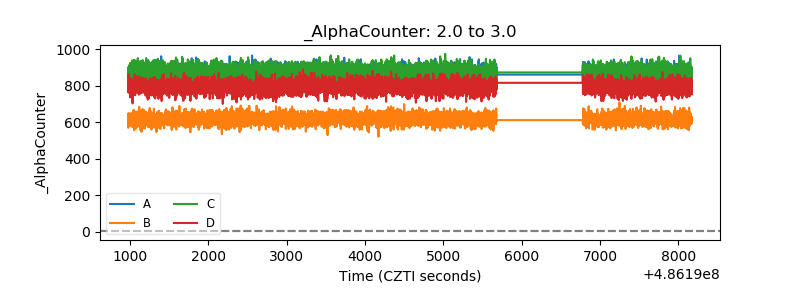 |
| _CPM_Rate | 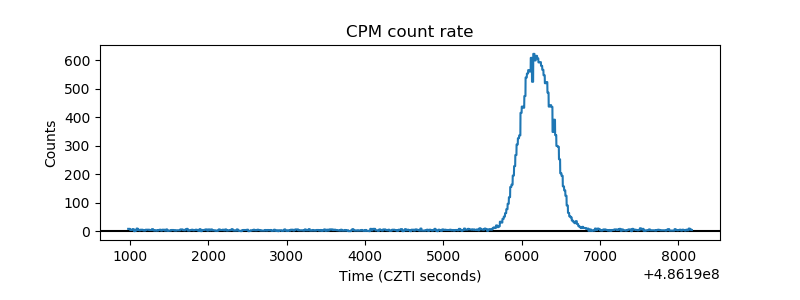 |
| CZT Counter | 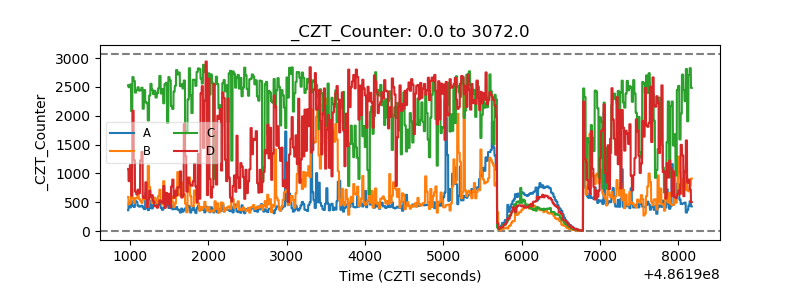 |
| +2.5 Volts monitor |  |
| +5 Volts monitor | 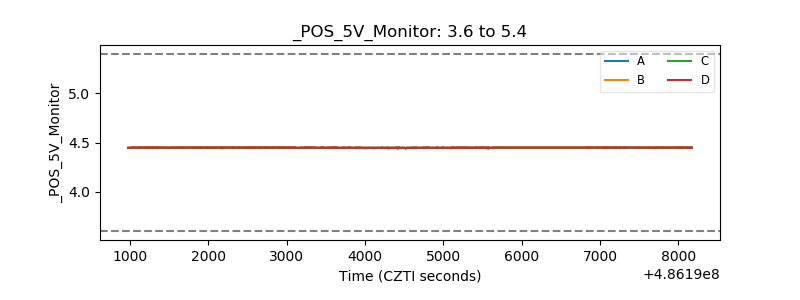 |
| _ROLL_ROT | 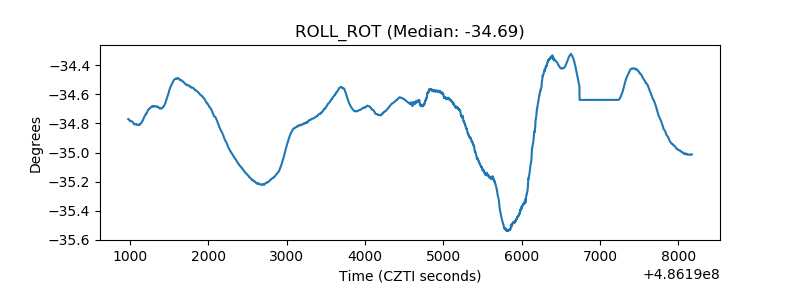 |
| _Roll_DEC | 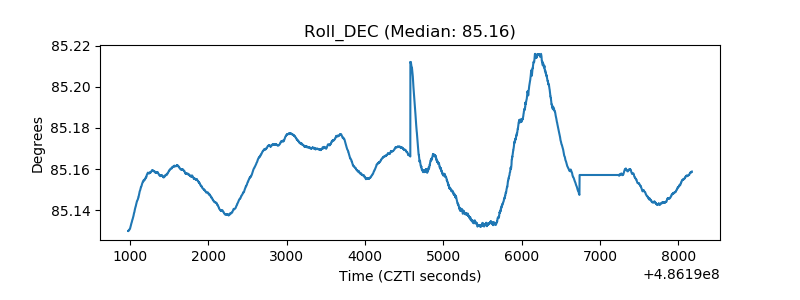 |
| _Roll_RA | 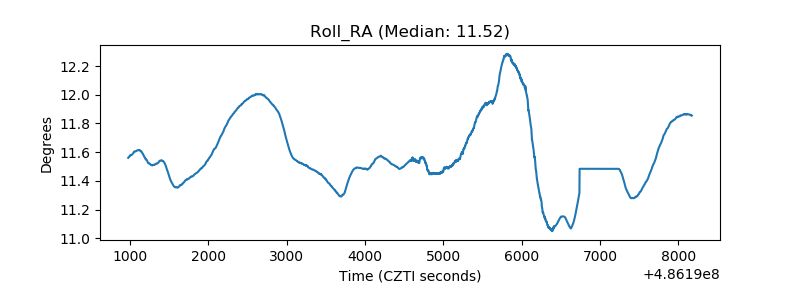 |
| Veto Counter | 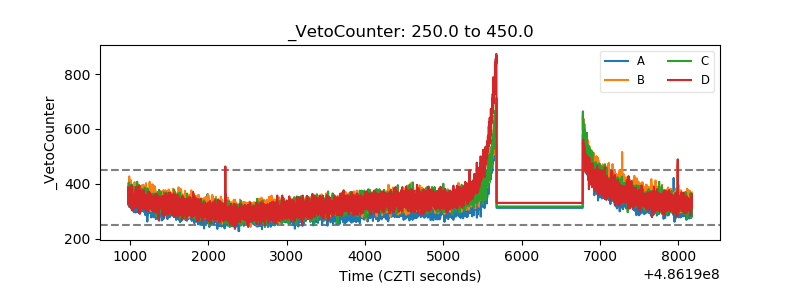 |