| Param | Original file | Final file |
|---|---|---|
| Filename | modeM0/AS1C09_011T05_9000006474_52293cztM0_level2.fits | modeM0/AS1C09_011T05_9000006474_52293cztM0_level2_quad_clean.evt |
| Size (bytes) | 891,126,720 | 75,720,960 |
| Size | 849.8 MB | 72.2 MB |
| Events in quadrant A | 4,032,585 | 781,055 |
| Events in quadrant B | 4,482,821 | 731,790 |
| Events in quadrant C | 12,784,995 | 75,732 |
| Events in quadrant D | 11,216,555 | 280,914 |
| Mode M0 | |||
|---|---|---|---|
| Quadrant | BADHDUFLAG | Total packets | Discarded packets |
| A | 0 | 16207 | 1 |
| B | 0 | 17466 | 1 |
| C | 0 | 42166 | 1 |
| D | 0 | 37480 | 1 |
| Mode SS | |||
|---|---|---|---|
| Quadrant | BADHDUFLAG | Total packets | Discarded packets |
| A | 0 | 122 | 0 |
| B | 0 | 122 | 0 |
| C | 0 | 122 | 0 |
| D | 0 | 122 | 0 |
| Mode M9 | |||
|---|---|---|---|
| Quadrant | BADHDUFLAG | Total packets | Discarded packets |
| A | 0 | 11 | 0 |
| B | 0 | 11 | 0 |
| C | 0 | 11 | 0 |
| D | 0 | 11 | 0 |
| Quadrant | Total seconds | Saturated seconds | Saturation percentage |
|---|---|---|---|
| A | 6063 | 269 | 4.436747% |
| B | 6064 | 287 | 4.732850% |
| C | 6064 | 5386 | 88.819261% |
| D | 6064 | 3100 | 51.121372% |
Noise dominated data is calculated using 1-second bins in cleaned event files. If a bin has >2000 counts, and if more than 50% of those come from <1% of pixels, then it is considered to be noise-dominated and hence unusable.
| Quadrant | # 1 sec bins | Bins with >0 counts | Bins with >2000 counts | High rate bins dominated by noise | Noise dominated (total time) | Noise dominated (detector-on time) | Marked lightcurve |
|---|---|---|---|---|---|---|---|
| A | 7163 | 6064 | 146 | 146 | 2.04% | 2.41% | 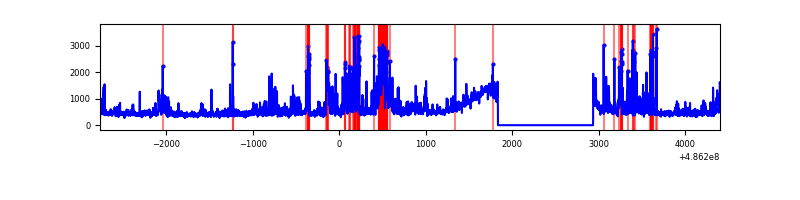 |
| B | 7164 | 6065 | 173 | 173 | 2.41% | 2.85% | 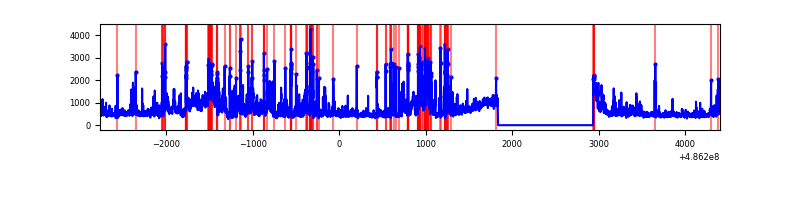 |
| C | 7163 | 6063 | 4032 | 4032 | 56.29% | 66.50% | 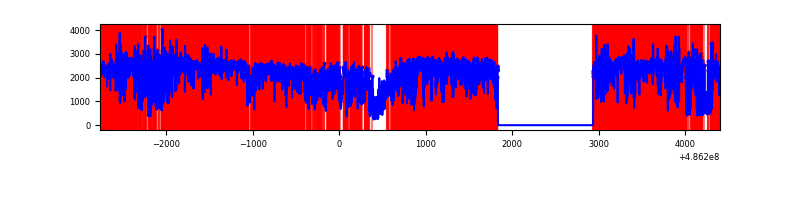 |
| D | 7164 | 6064 | 3015 | 3015 | 42.09% | 49.72% | 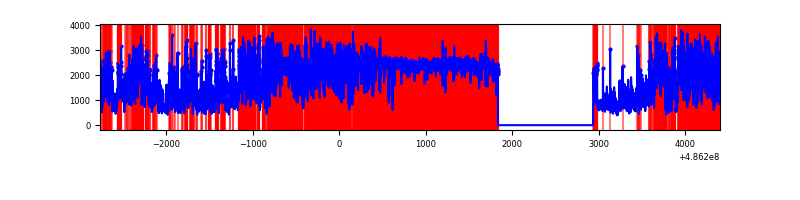 |
Top three noisy pixels from each quadrant. If the there are fewer than three noisy pixels in the level2.evt file, extra rows are filled as -1
| Pixel properties | Quadrant properties | ||||||
|---|---|---|---|---|---|---|---|
| Quadrant | DetID | PixID | Counts | Sigma | Mean | Median | Sigma |
| A | 12 | 3 | 370019 | 1798.41 | 711 | 694 | 205.4 |
| A | 3 | 62 | 282431 | 1371.9 | 711 | 694 | 205.4 |
| A | 4 | 249 | 148551 | 719.98 | 711 | 694 | 205.4 |
| B | 7 | 0 | 547893 | 3708.08 | 660 | 644 | 147.6 |
| B | 10 | 44 | 372172 | 2517.42 | 660 | 644 | 147.6 |
| B | 0 | 216 | 167427 | 1130.1 | 660 | 644 | 147.6 |
| C | 0 | 161 | 4474774 | 71135.73 | 212 | 210 | 62.9 |
| C | 15 | 178 | 2632210 | 41843.01 | 212 | 210 | 62.9 |
| C | 15 | 158 | 1923844 | 30581.55 | 212 | 210 | 62.9 |
| D | 15 | 93 | 7453418 | 50718.11 | 478 | 456 | 146.9 |
| D | 8 | 176 | 669729 | 4554.47 | 478 | 456 | 146.9 |
| D | 12 | 1 | 376494 | 2558.97 | 478 | 456 | 146.9 |
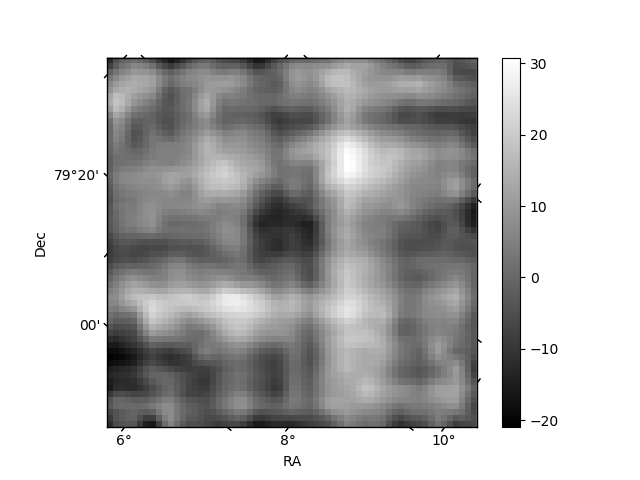
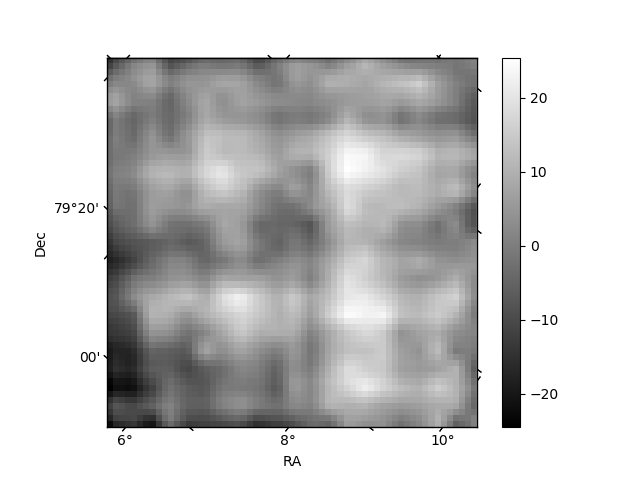
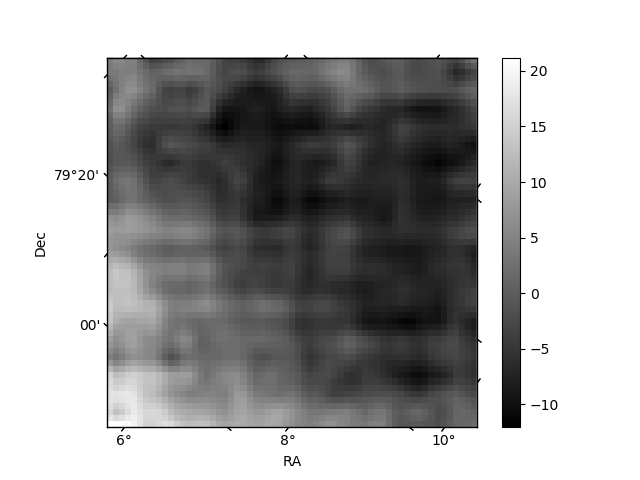
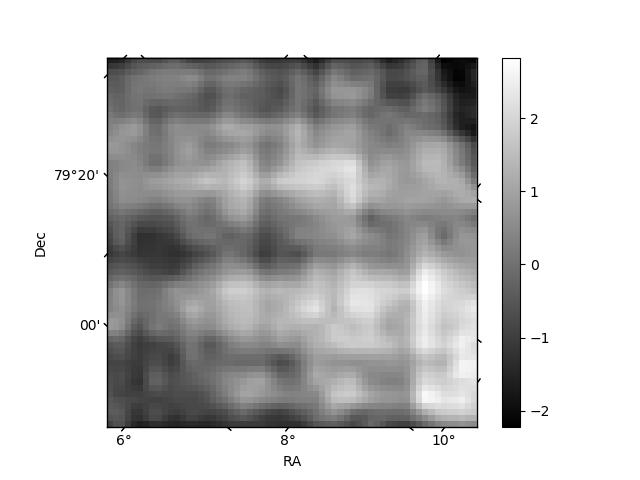
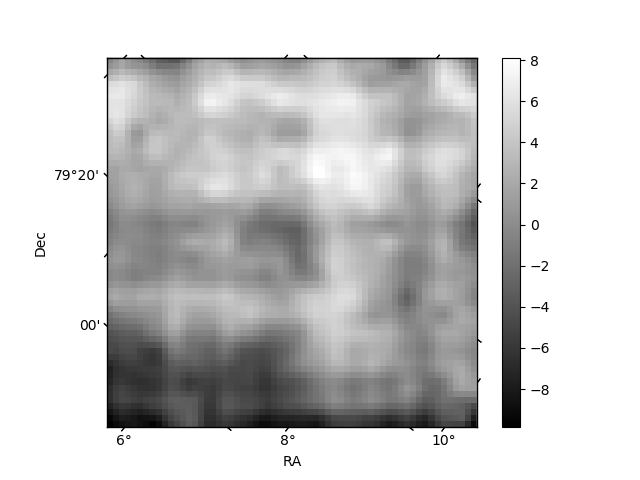
Histogram calculated using DETX and DETY for each event in the final _common_clean file
| Quadrant A | 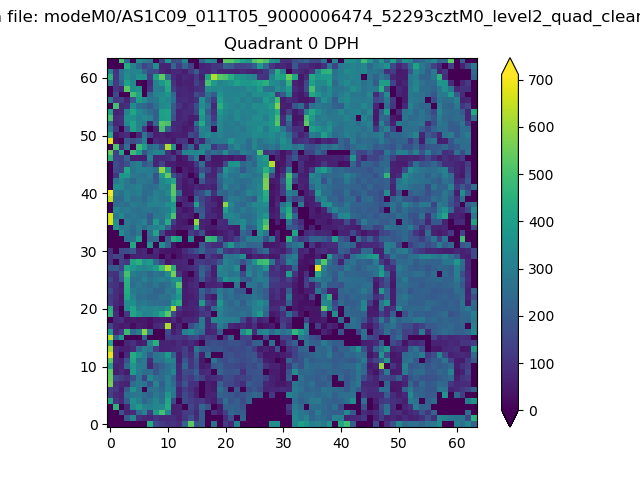 |
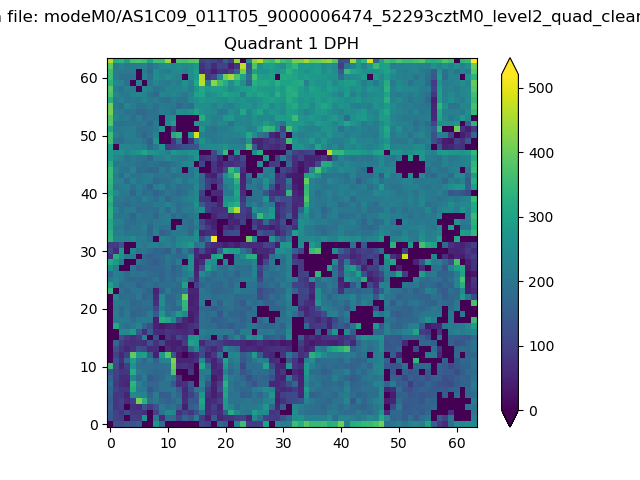 |
Quadrant B |
|---|---|---|---|
| Quadrant D | 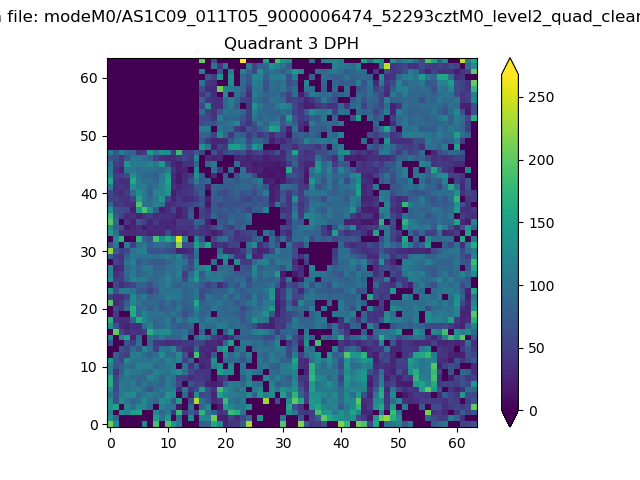 |
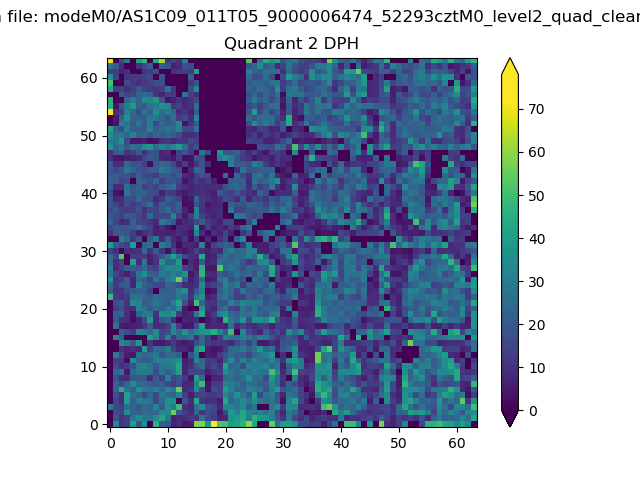 |
Quadrant C |
| Plot type | Count rate plots | Images |
|---|---|---|
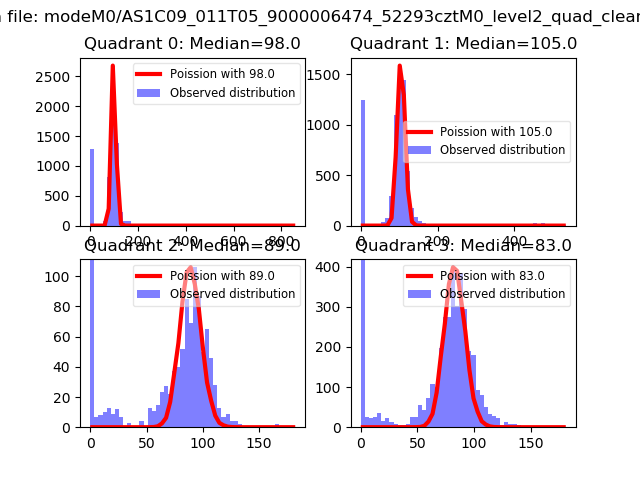
| Comparison with Poisson distribution Blue bars denote a histogram of data divided into 1 sec bins. Red curve is a Poisson curve with rate = median count rate of data. |
 |
 |
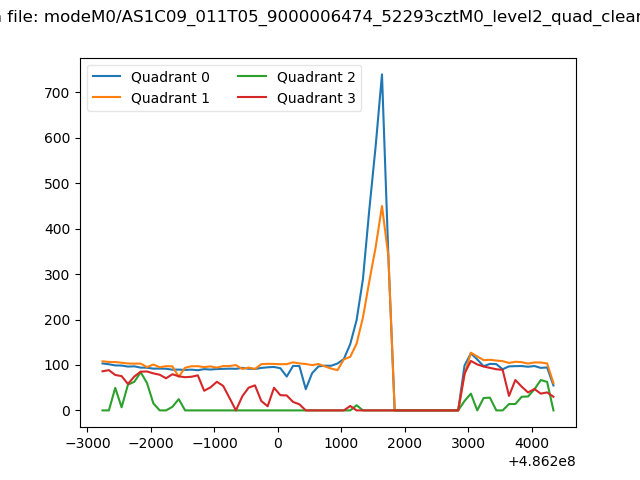
| Quadrant-wise count rates Data is divided into 100 sec bins |
 |
|
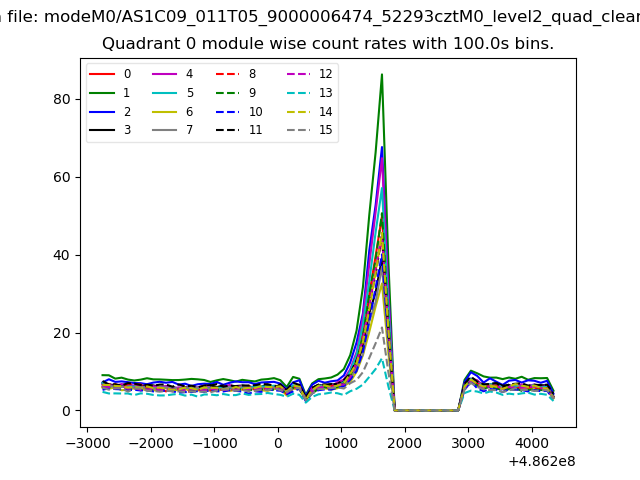
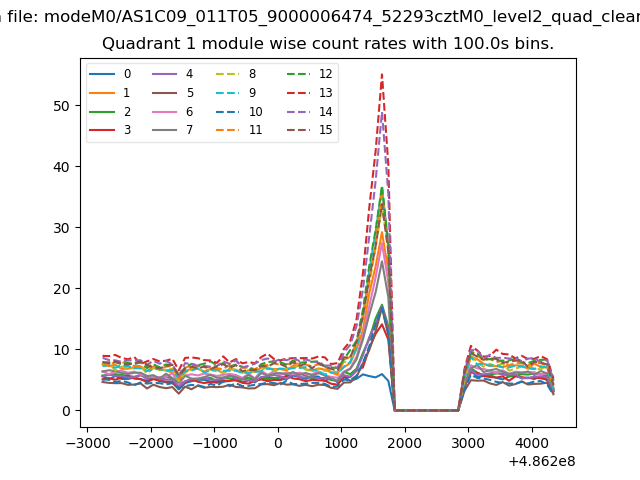
| Module-wise count rates for Quadrant A Data is divided into 100 sec bins |
 |
 |
| Module-wise count rates for Quadrant B Data is divided into 100 sec bins |
 |
 |
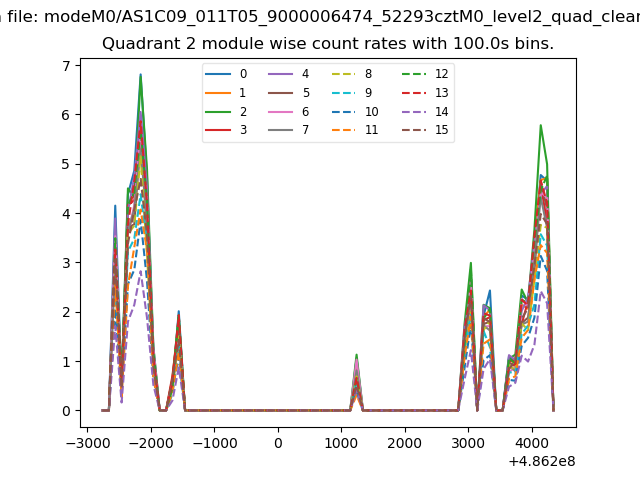
| Module-wise count rates for Quadrant C Data is divided into 100 sec bins |
 |
 |
| Module-wise count rates for Quadrant D Data is divided into 100 sec bins |
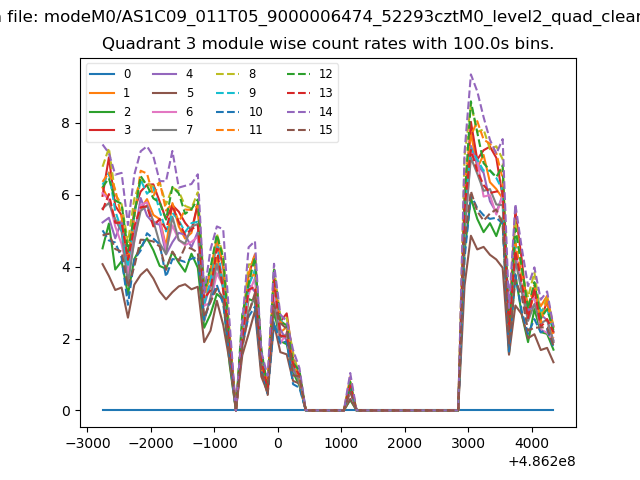 |
 |
| Parameter | Plot |
|---|---|
| CZT HV Monitor | 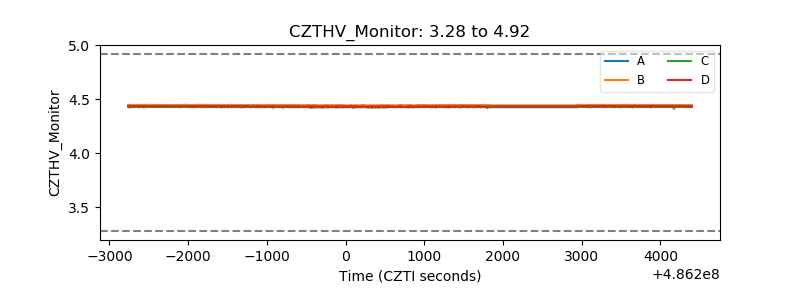 |
| D_VDD | 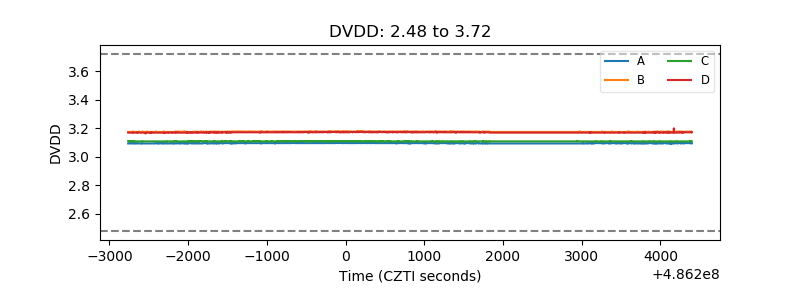 |
| Temperature 1 | 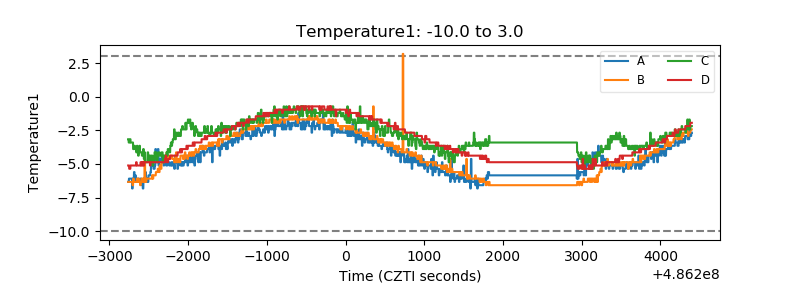 |
| Veto HV Monitor | 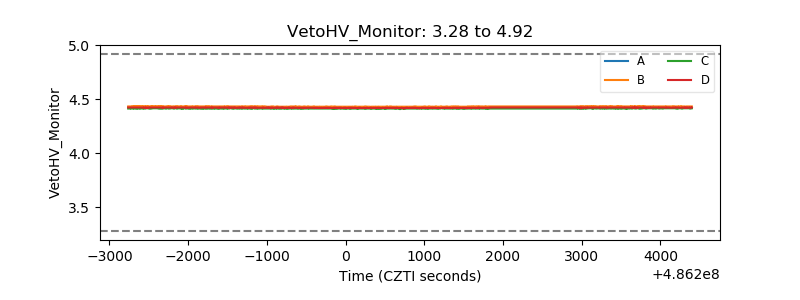 |
| Veto LLD | 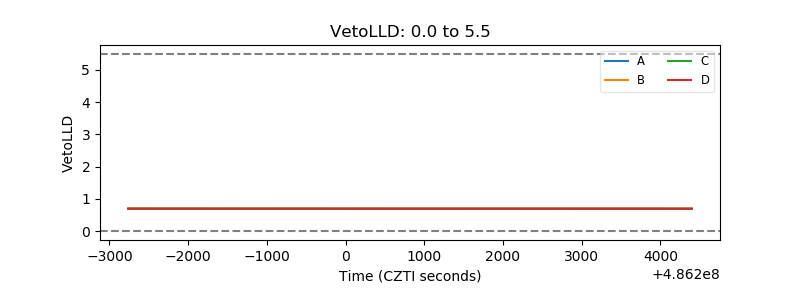 |
| Alpha Counter | 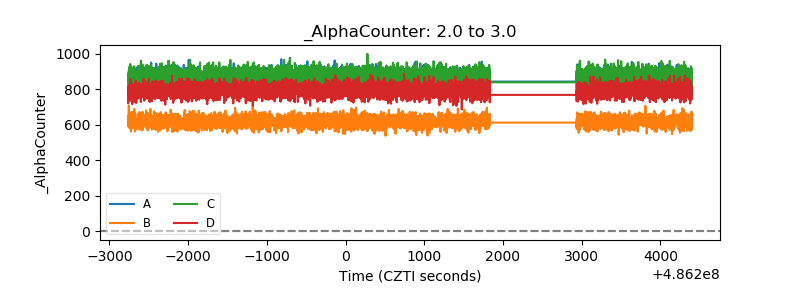 |
| _CPM_Rate | 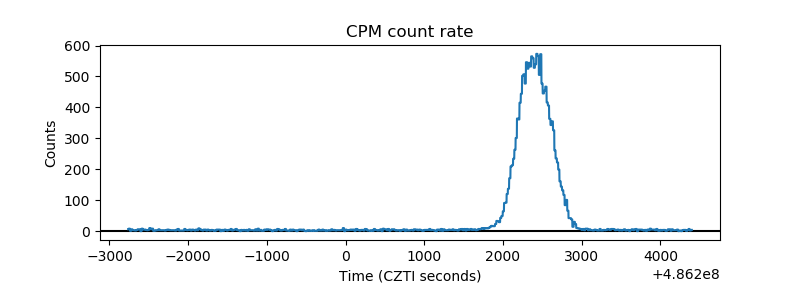 |
| CZT Counter | 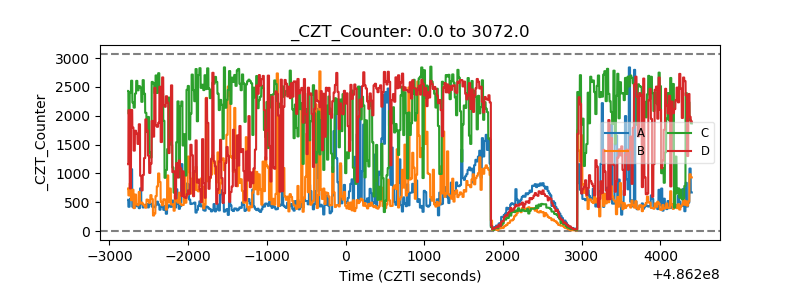 |
| +2.5 Volts monitor | 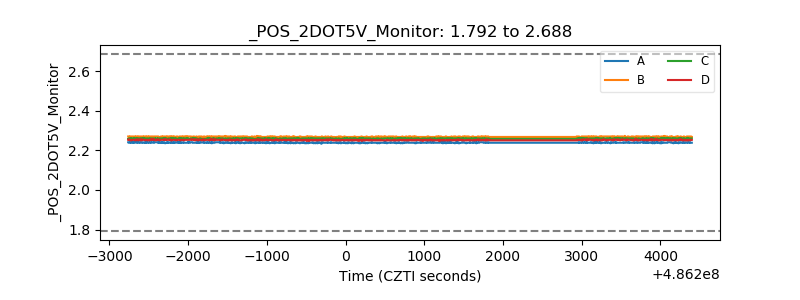 |
| +5 Volts monitor |  |
| _ROLL_ROT | 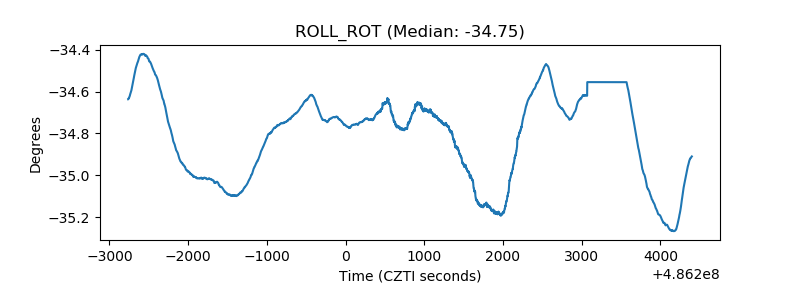 |
| _Roll_DEC | 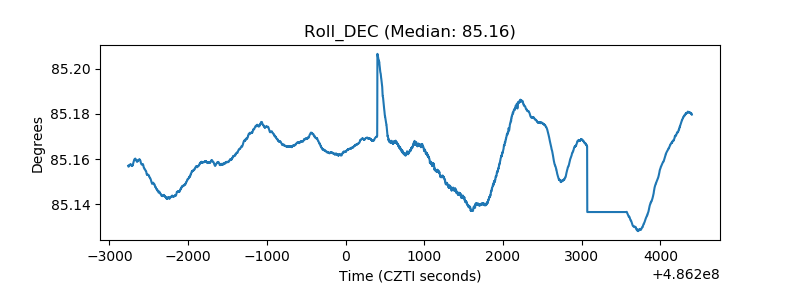 |
| _Roll_RA | 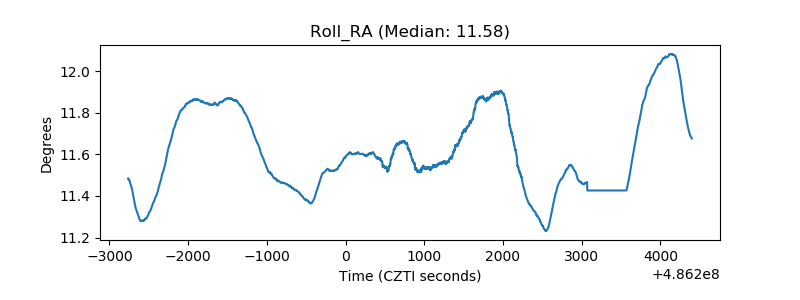 |
| Veto Counter | 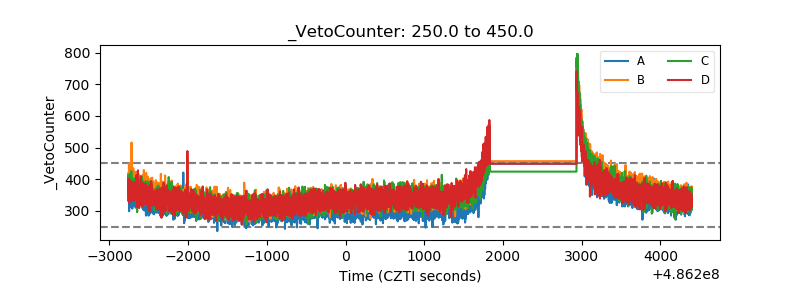 |