| Param | Original file | Final file |
|---|---|---|
| Filename | modeM0/AS1C09_011T05_9000006474_52295cztM0_level2.fits | modeM0/AS1C09_011T05_9000006474_52295cztM0_level2_quad_clean.evt |
| Size (bytes) | 770,172,480 | 77,423,040 |
| Size | 734.5 MB | 73.8 MB |
| Events in quadrant A | 4,256,553 | 595,549 |
| Events in quadrant B | 4,755,170 | 638,857 |
| Events in quadrant C | 13,411,699 | 158,137 |
| Events in quadrant D | 5,591,540 | 506,482 |
| Mode M0 | |||
|---|---|---|---|
| Quadrant | BADHDUFLAG | Total packets | Discarded packets |
| A | 0 | 17027 | 1 |
| B | 0 | 18557 | 3 |
| C | 0 | 44194 | 1 |
| D | 0 | 20985 | 1 |
| Mode SS | |||
|---|---|---|---|
| Quadrant | BADHDUFLAG | Total packets | Discarded packets |
| A | 0 | 130 | 0 |
| B | 0 | 130 | 0 |
| C | 0 | 130 | 0 |
| D | 0 | 130 | 0 |
| Mode M9 | |||
|---|---|---|---|
| Quadrant | BADHDUFLAG | Total packets | Discarded packets |
| A | 0 | 10 | 0 |
| B | 0 | 10 | 0 |
| C | 0 | 10 | 0 |
| D | 0 | 10 | 0 |
| Quadrant | Total seconds | Saturated seconds | Saturation percentage |
|---|---|---|---|
| A | 6376 | 233 | 3.654329% |
| B | 6376 | 247 | 3.873902% |
| C | 6376 | 4865 | 76.301757% |
| D | 6376 | 620 | 9.723965% |
Noise dominated data is calculated using 1-second bins in cleaned event files. If a bin has >2000 counts, and if more than 50% of those come from <1% of pixels, then it is considered to be noise-dominated and hence unusable.
| Quadrant | # 1 sec bins | Bins with >0 counts | Bins with >2000 counts | High rate bins dominated by noise | Noise dominated (total time) | Noise dominated (detector-on time) | Marked lightcurve |
|---|---|---|---|---|---|---|---|
| A | 7391 | 6377 | 174 | 174 | 2.35% | 2.73% | 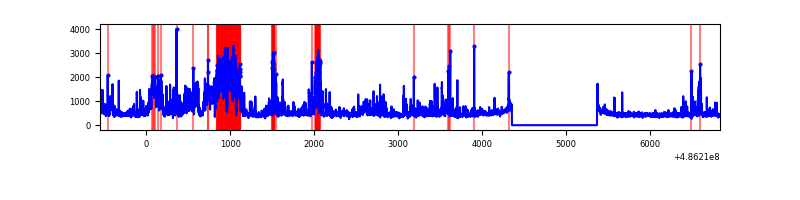 |
| B | 7391 | 6377 | 121 | 121 | 1.64% | 1.90% | 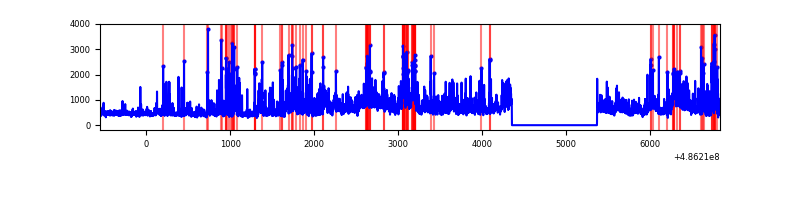 |
| C | 7390 | 6375 | 4398 | 4398 | 59.51% | 68.99% | 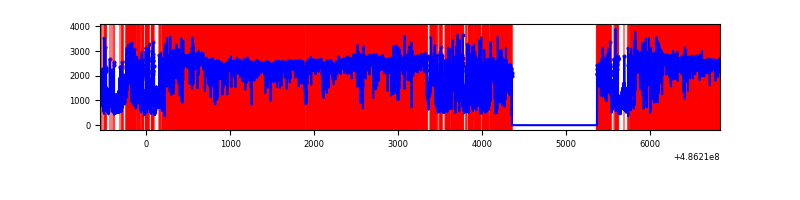 |
| D | 7391 | 6377 | 562 | 562 | 7.60% | 8.81% | 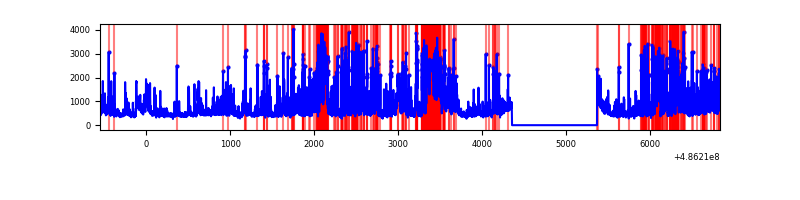 |
Top three noisy pixels from each quadrant. If the there are fewer than three noisy pixels in the level2.evt file, extra rows are filled as -1
| Pixel properties | Quadrant properties | ||||||
|---|---|---|---|---|---|---|---|
| Quadrant | DetID | PixID | Counts | Sigma | Mean | Median | Sigma |
| A | 12 | 3 | 791815 | 4843.79 | 664 | 649 | 163.3 |
| A | 10 | 253 | 105873 | 644.22 | 664 | 649 | 163.3 |
| A | 12 | 194 | 98608 | 599.74 | 664 | 649 | 163.3 |
| B | 10 | 254 | 687674 | 5017.25 | 651 | 630 | 136.9 |
| B | 0 | 216 | 296433 | 2160.15 | 651 | 630 | 136.9 |
| B | 4 | 171 | 289028 | 2106.07 | 651 | 630 | 136.9 |
| C | 15 | 178 | 5944043 | 67147.36 | 315 | 312 | 88.5 |
| C | 15 | 158 | 1509463 | 17049.14 | 315 | 312 | 88.5 |
| C | 5 | 250 | 1457088 | 16457.45 | 315 | 312 | 88.5 |
| D | 15 | 93 | 1199276 | 6819.25 | 619 | 591 | 175.8 |
| D | 8 | 176 | 1196725 | 6804.73 | 619 | 591 | 175.8 |
| D | 7 | 96 | 152066 | 861.73 | 619 | 591 | 175.8 |
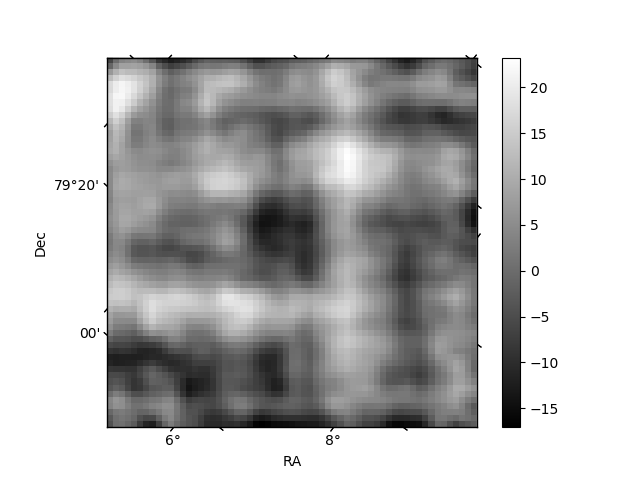
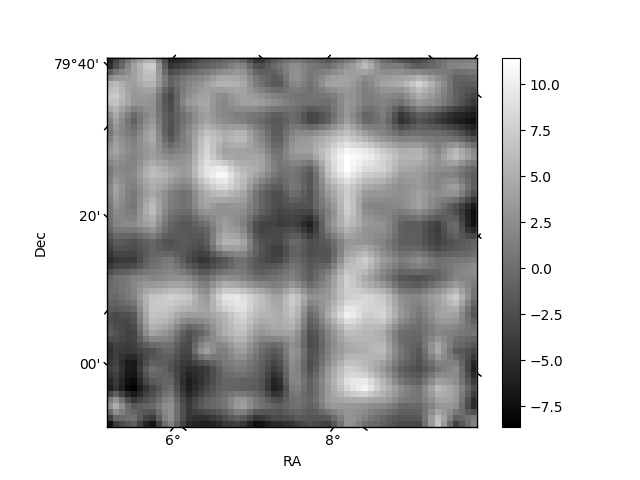
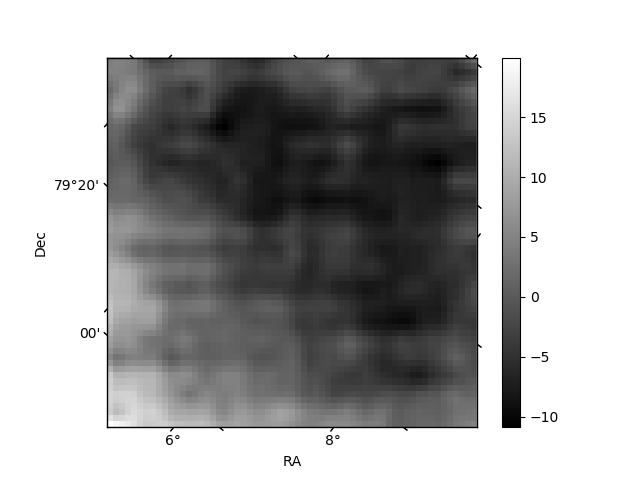
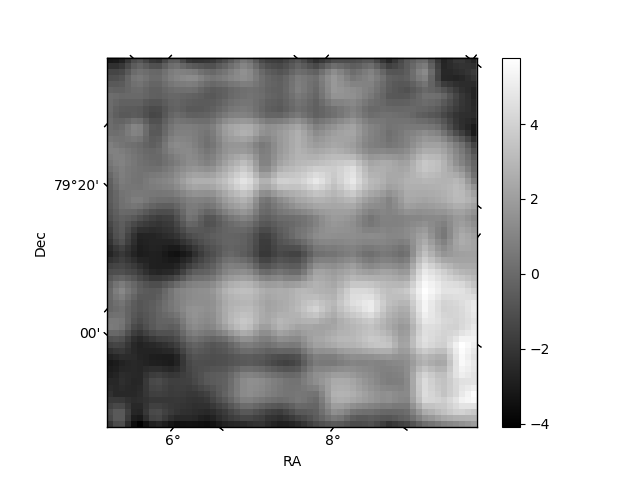
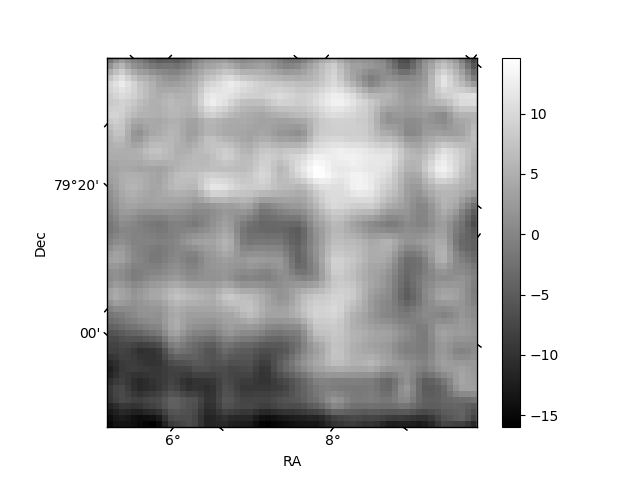
Histogram calculated using DETX and DETY for each event in the final _common_clean file
| Quadrant A | 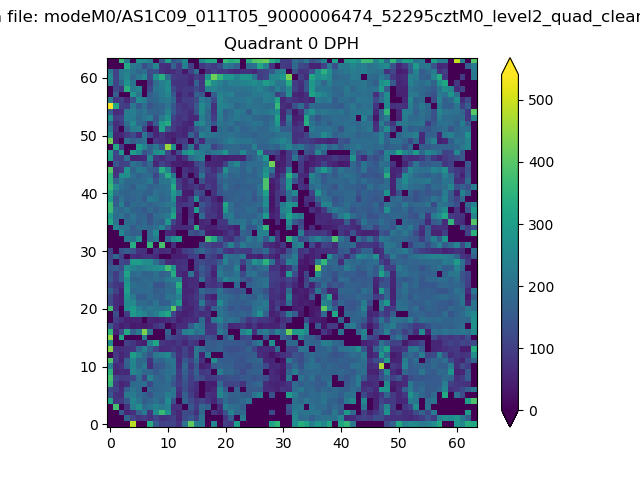 |
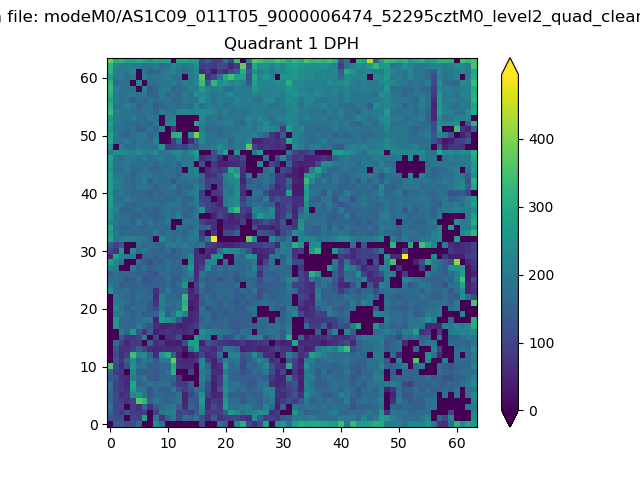 |
Quadrant B |
|---|---|---|---|
| Quadrant D | 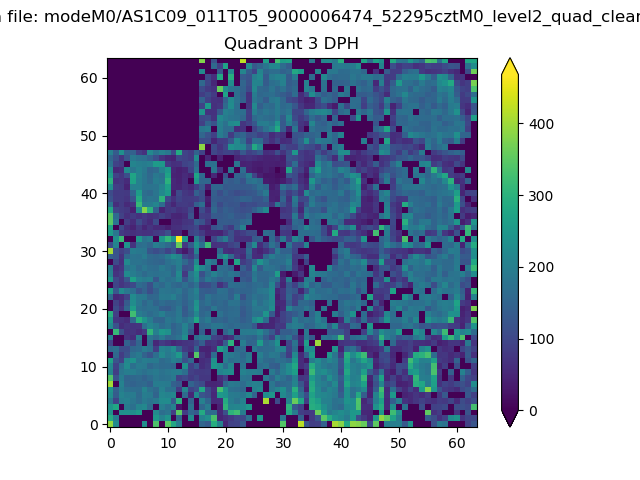 |
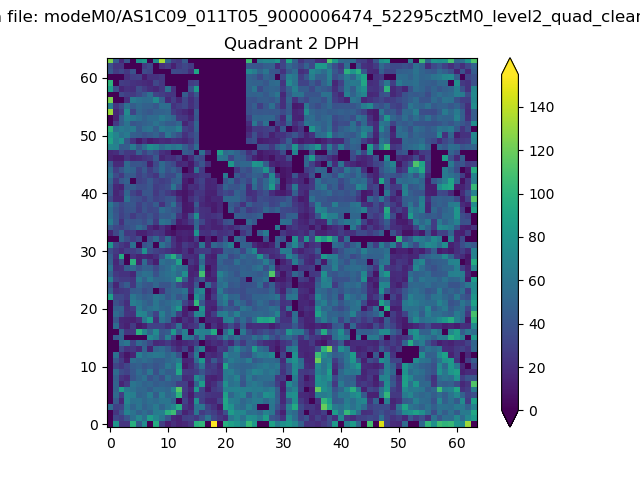 |
Quadrant C |
| Plot type | Count rate plots | Images |
|---|---|---|
| Comparison with Poisson distribution Blue bars denote a histogram of data divided into 1 sec bins. Red curve is a Poisson curve with rate = median count rate of data. |
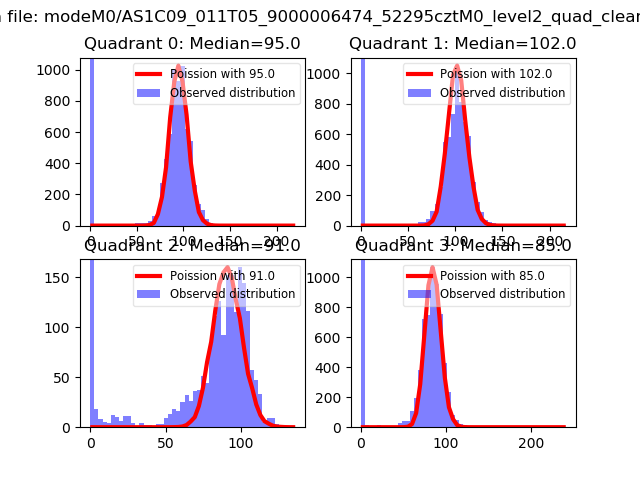 |
 |
| Quadrant-wise count rates Data is divided into 100 sec bins |
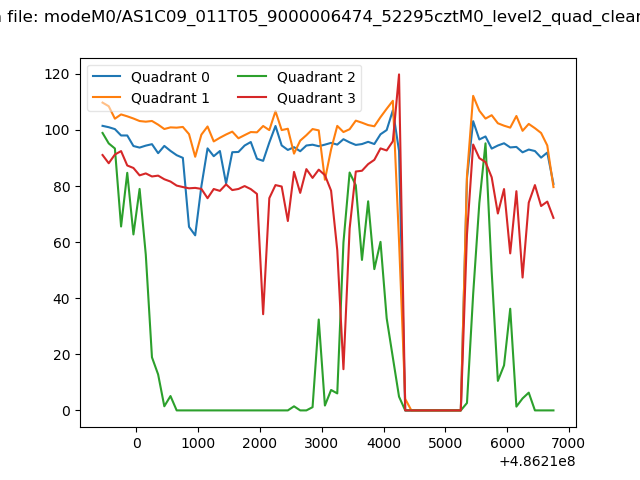 |
|
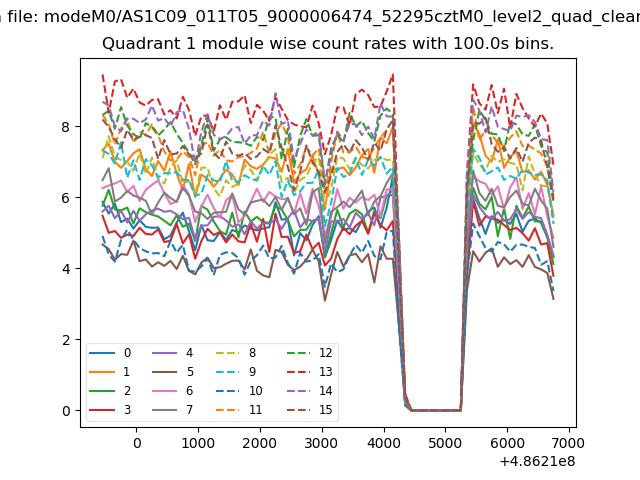
| Module-wise count rates for Quadrant A Data is divided into 100 sec bins |
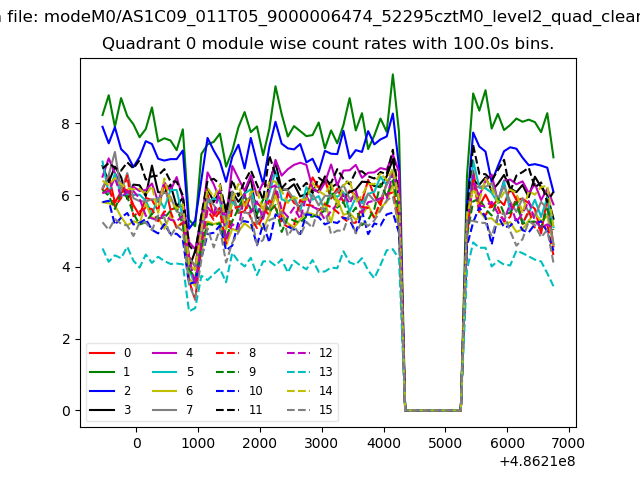 |
 |
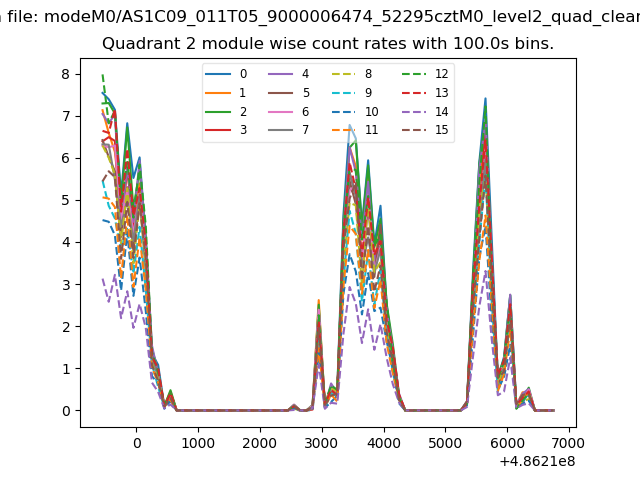
| Module-wise count rates for Quadrant B Data is divided into 100 sec bins |
 |
 |
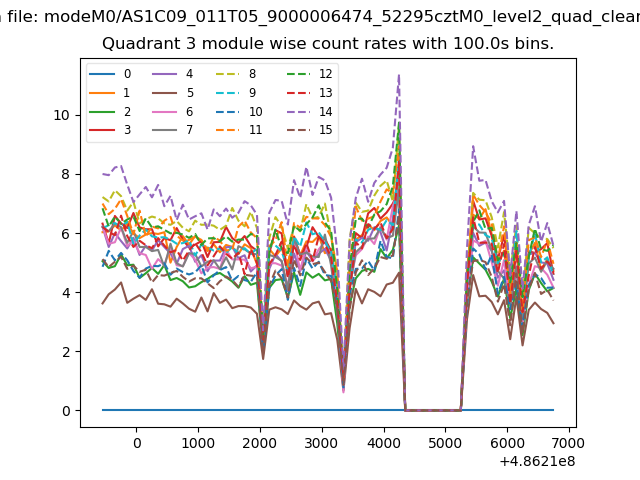
| Module-wise count rates for Quadrant C Data is divided into 100 sec bins |
 |
 |
| Module-wise count rates for Quadrant D Data is divided into 100 sec bins |
 |
 |
| Parameter | Plot |
|---|---|
| CZT HV Monitor | 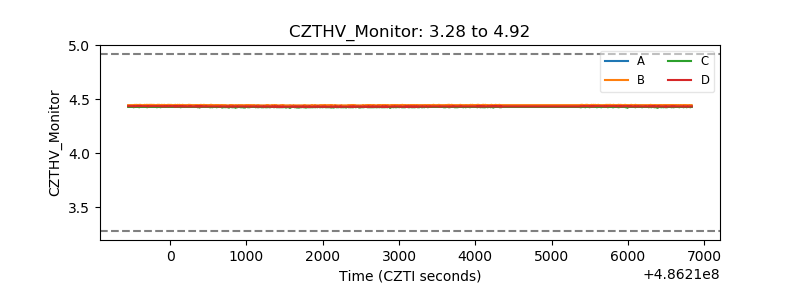 |
| D_VDD | 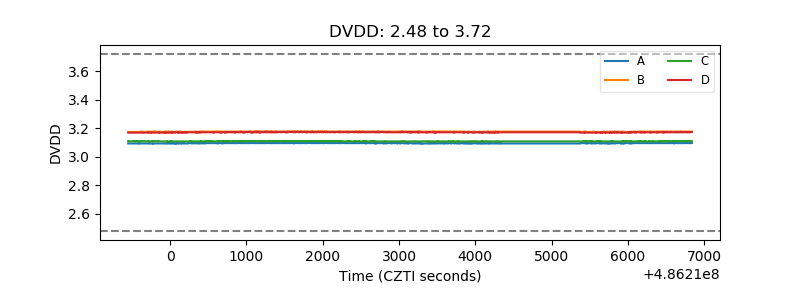 |
| Temperature 1 | 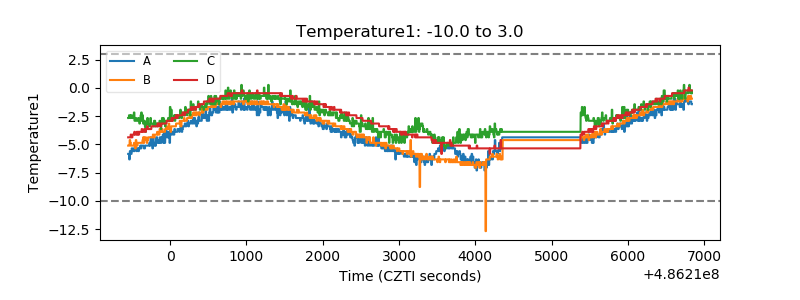 |
| Veto HV Monitor | 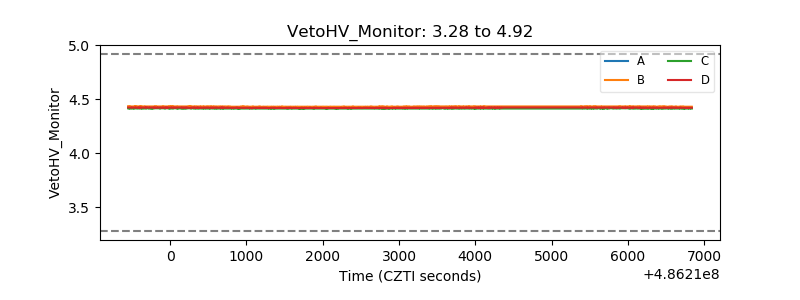 |
| Veto LLD | 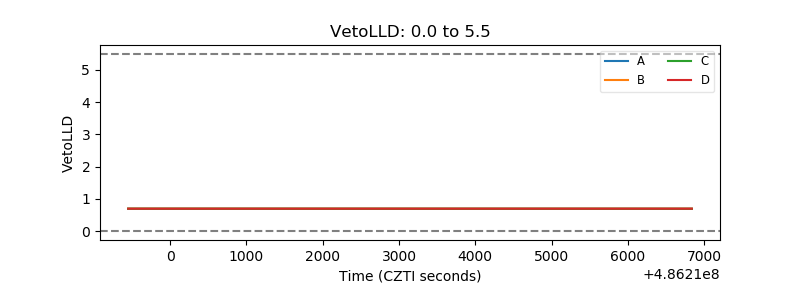 |
| Alpha Counter | 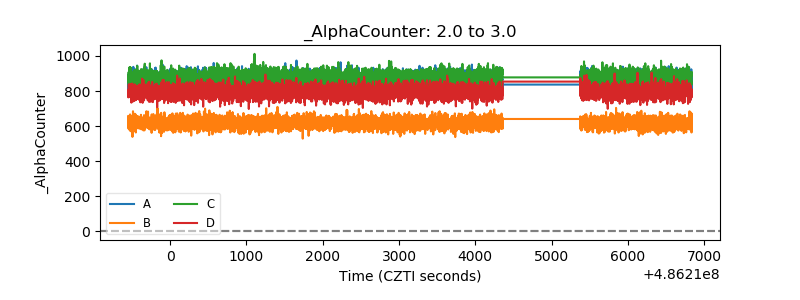 |
| _CPM_Rate | 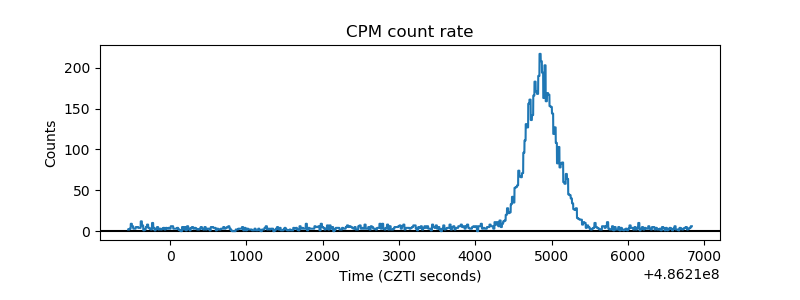 |
| CZT Counter | 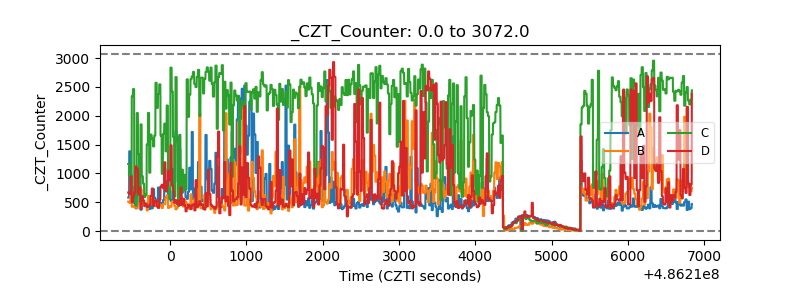 |
| +2.5 Volts monitor | 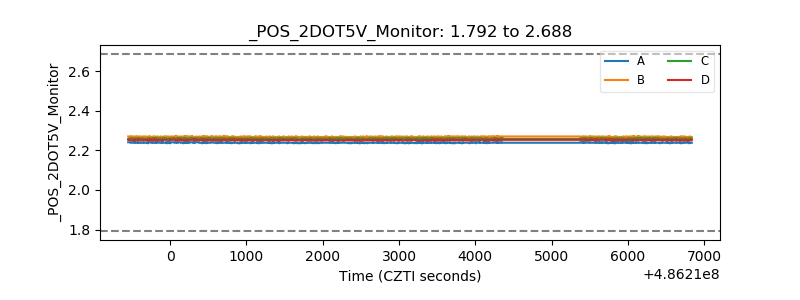 |
| +5 Volts monitor |  |
| _ROLL_ROT | 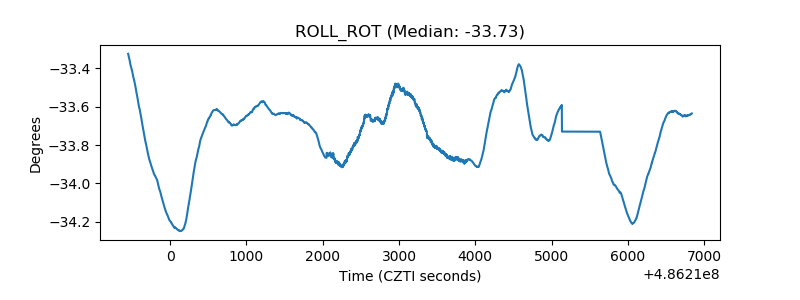 |
| _Roll_DEC | 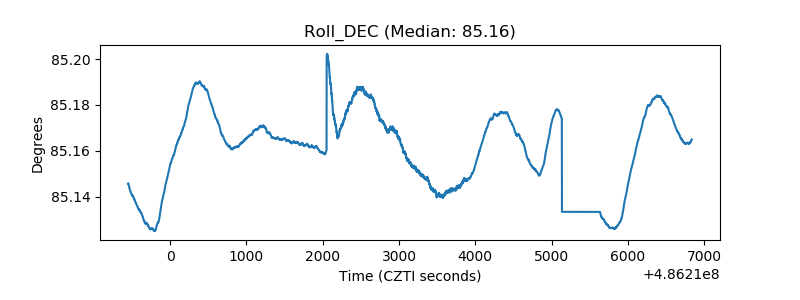 |
| _Roll_RA | 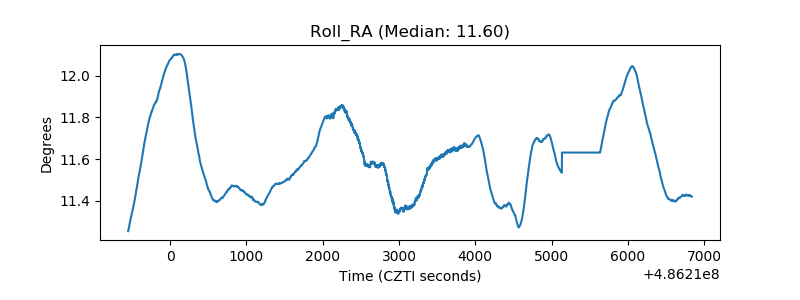 |
| Veto Counter | 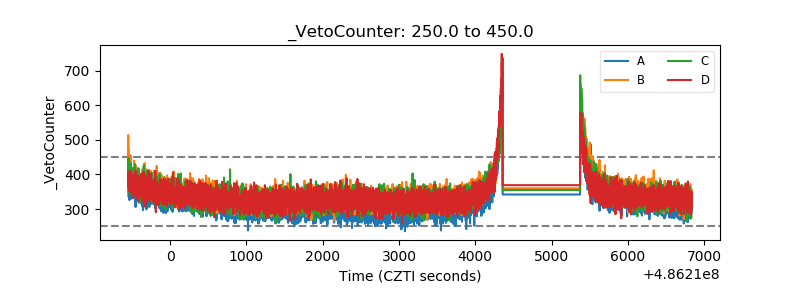 |