| Param | Original file | Final file |
|---|---|---|
| Filename | modeM0/AS1C09_011T05_9000006474_52296cztM0_level2.fits | modeM0/AS1C09_011T05_9000006474_52296cztM0_level2_quad_clean.evt |
| Size (bytes) | 897,563,520 | 86,290,560 |
| Size | 856.0 MB | 82.3 MB |
| Events in quadrant A | 3,985,352 | 690,379 |
| Events in quadrant B | 6,411,340 | 661,854 |
| Events in quadrant C | 13,887,507 | 224,510 |
| Events in quadrant D | 8,405,475 | 553,722 |
| Mode M0 | |||
|---|---|---|---|
| Quadrant | BADHDUFLAG | Total packets | Discarded packets |
| A | 0 | 16713 | 1 |
| B | 0 | 23856 | 1 |
| C | 0 | 46005 | 1 |
| D | 0 | 29776 | 1 |
| Mode SS | |||
|---|---|---|---|
| Quadrant | BADHDUFLAG | Total packets | Discarded packets |
| A | 0 | 142 | 0 |
| B | 0 | 142 | 0 |
| C | 0 | 142 | 0 |
| D | 0 | 142 | 0 |
| Mode M9 | |||
|---|---|---|---|
| Quadrant | BADHDUFLAG | Total packets | Discarded packets |
| A | 0 | 8 | 0 |
| B | 0 | 8 | 0 |
| C | 0 | 8 | 0 |
| D | 0 | 8 | 0 |
| Quadrant | Total seconds | Saturated seconds | Saturation percentage |
|---|---|---|---|
| A | 6918 | 210 | 3.035559% |
| B | 6919 | 900 | 13.007660% |
| C | 6919 | 4734 | 68.420292% |
| D | 6919 | 1200 | 17.343547% |
Noise dominated data is calculated using 1-second bins in cleaned event files. If a bin has >2000 counts, and if more than 50% of those come from <1% of pixels, then it is considered to be noise-dominated and hence unusable.
| Quadrant | # 1 sec bins | Bins with >0 counts | Bins with >2000 counts | High rate bins dominated by noise | Noise dominated (total time) | Noise dominated (detector-on time) | Marked lightcurve |
|---|---|---|---|---|---|---|---|
| A | 7743 | 6919 | 61 | 61 | 0.79% | 0.88% | 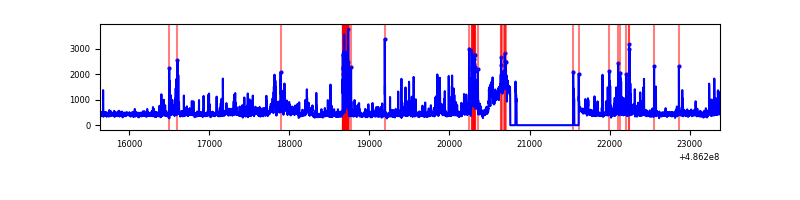 |
| B | 7743 | 6921 | 657 | 657 | 8.49% | 9.49% | 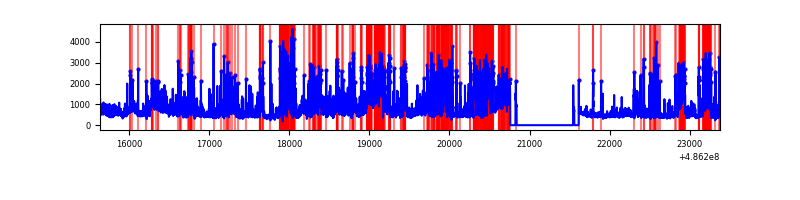 |
| C | 7744 | 6919 | 4253 | 4253 | 54.92% | 61.47% | 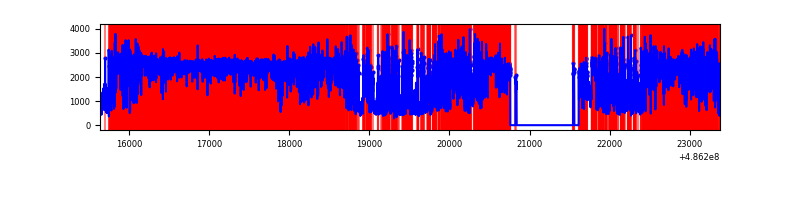 |
| D | 7744 | 6919 | 1019 | 1019 | 13.16% | 14.73% | 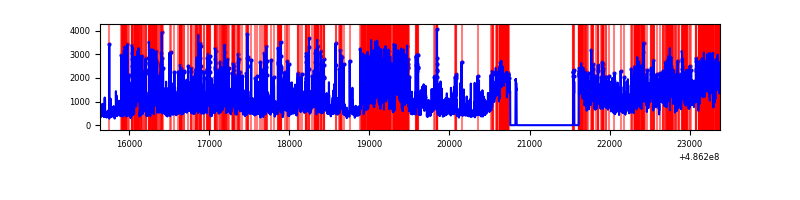 |
Top three noisy pixels from each quadrant. If the there are fewer than three noisy pixels in the level2.evt file, extra rows are filled as -1
| Pixel properties | Quadrant properties | ||||||
|---|---|---|---|---|---|---|---|
| Quadrant | DetID | PixID | Counts | Sigma | Mean | Median | Sigma |
| A | 12 | 3 | 213630 | 1056.19 | 763 | 745 | 201.6 |
| A | 3 | 62 | 125720 | 620.04 | 763 | 745 | 201.6 |
| A | 7 | 206 | 102175 | 503.23 | 763 | 745 | 201.6 |
| B | 12 | 32 | 835490 | 5668.38 | 690 | 670 | 147.3 |
| B | 0 | 216 | 594907 | 4034.83 | 690 | 670 | 147.3 |
| B | 4 | 171 | 533718 | 3619.36 | 690 | 670 | 147.3 |
| C | 15 | 178 | 2354963 | 17695.81 | 459 | 453 | 133.1 |
| C | 15 | 224 | 1996619 | 15002.6 | 459 | 453 | 133.1 |
| C | 5 | 250 | 1821634 | 13687.47 | 459 | 453 | 133.1 |
| D | 15 | 93 | 4014090 | 18912.96 | 705 | 672 | 212.2 |
| D | 8 | 176 | 659179 | 3103.17 | 705 | 672 | 212.2 |
| D | 12 | 17 | 250993 | 1179.62 | 705 | 672 | 212.2 |
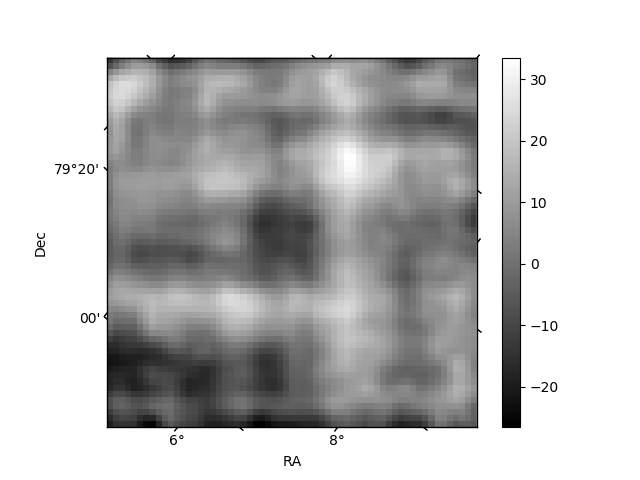
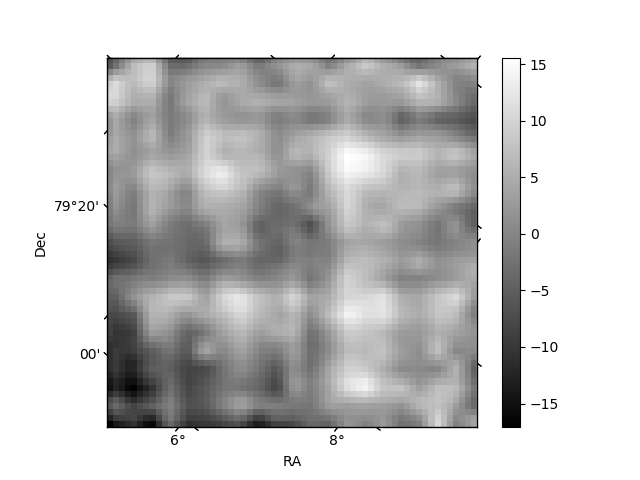
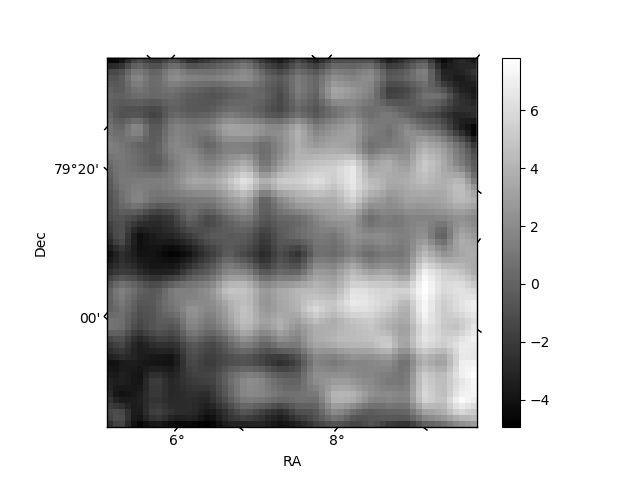
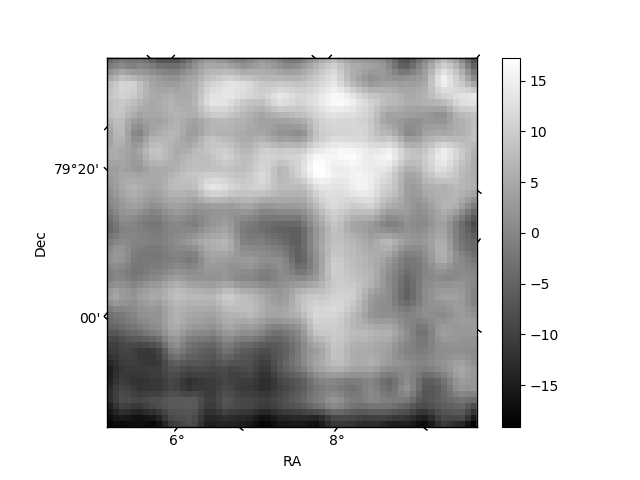
Histogram calculated using DETX and DETY for each event in the final _common_clean file
| Quadrant A | 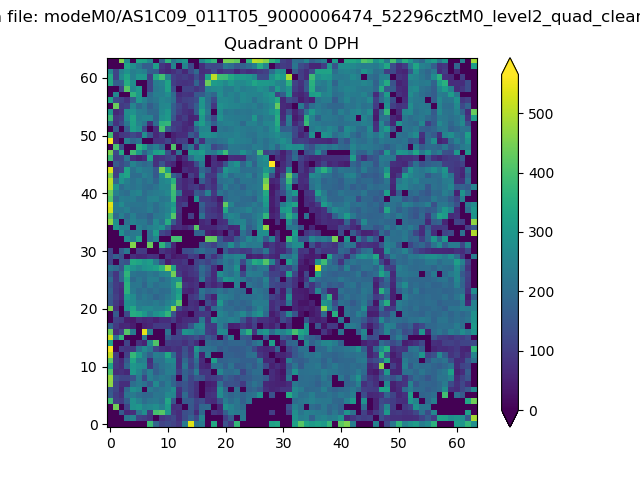 |
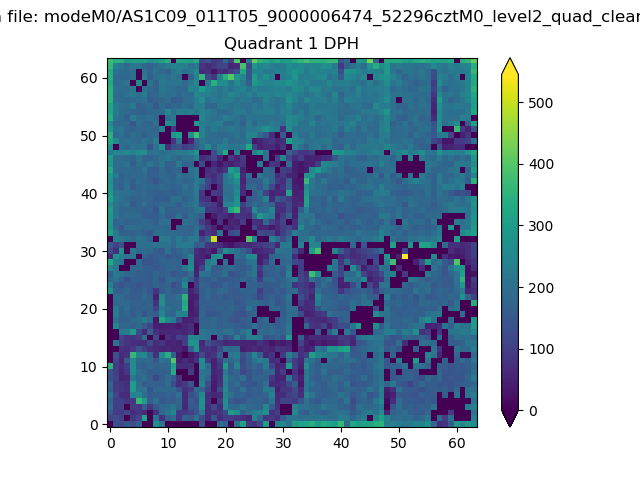 |
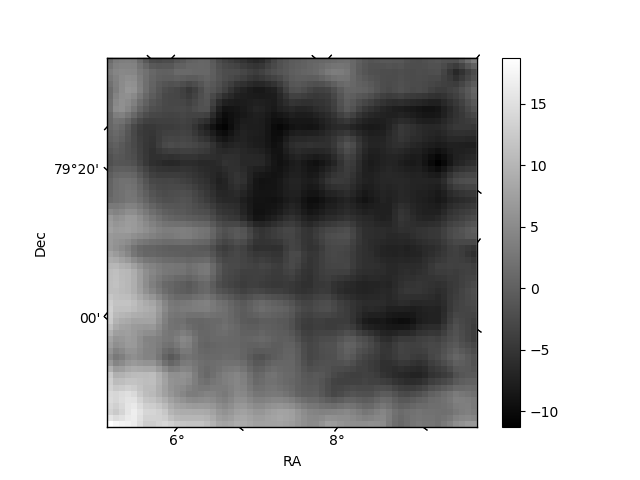
Quadrant B |
|---|---|---|---|
| Quadrant D | 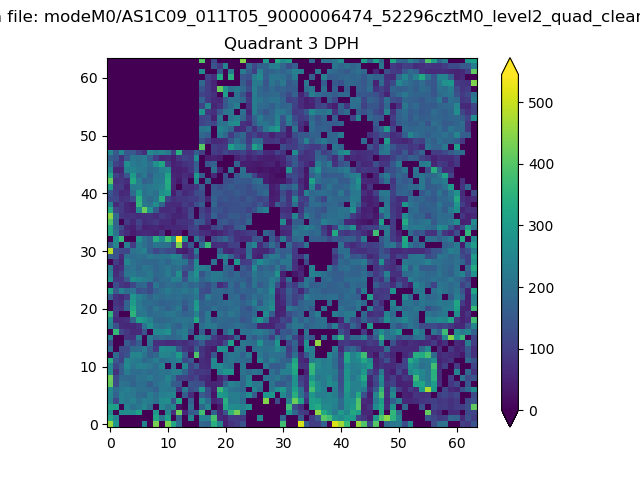 |
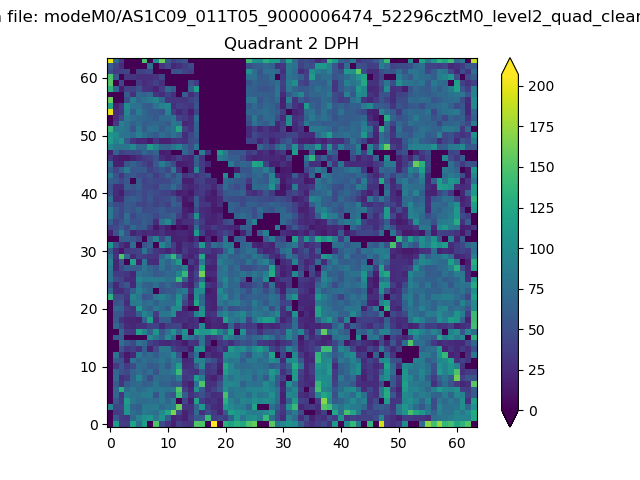 |
Quadrant C |
| Plot type | Count rate plots | Images |
|---|---|---|
| Comparison with Poisson distribution Blue bars denote a histogram of data divided into 1 sec bins. Red curve is a Poisson curve with rate = median count rate of data. |
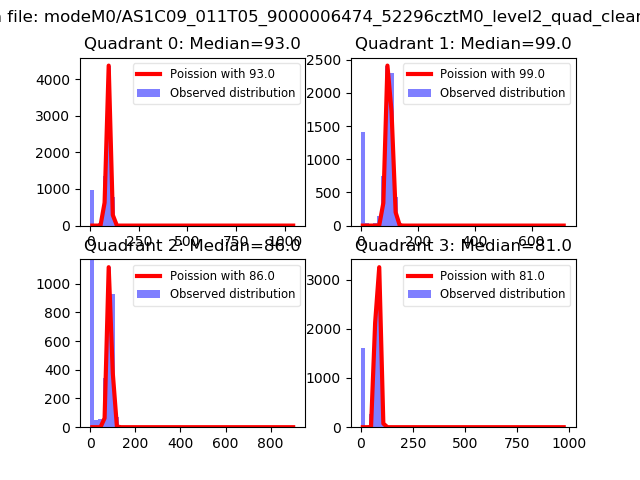 |
 |
| Quadrant-wise count rates Data is divided into 100 sec bins |
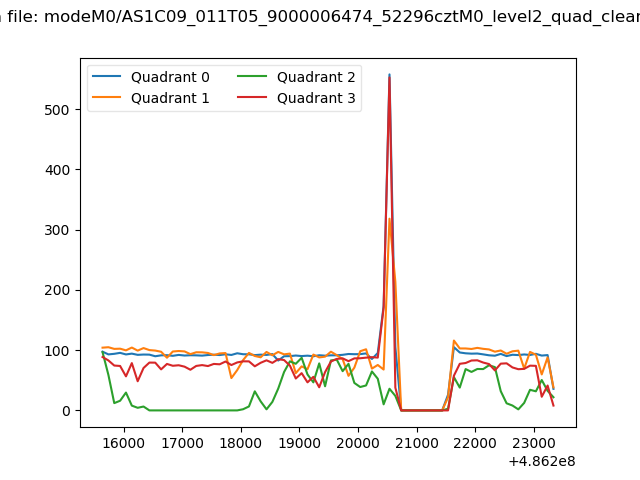 |
|
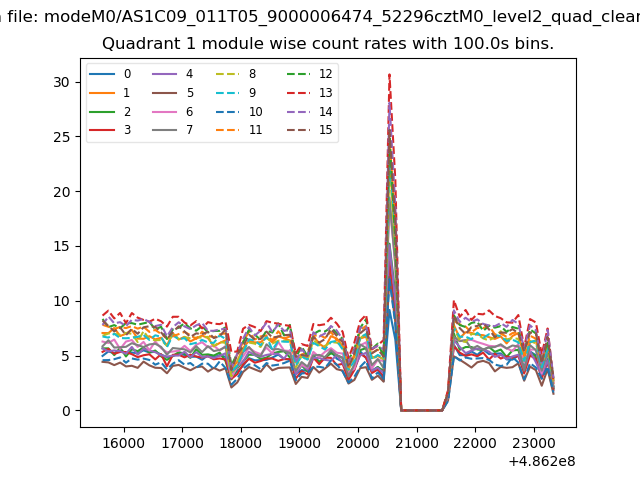
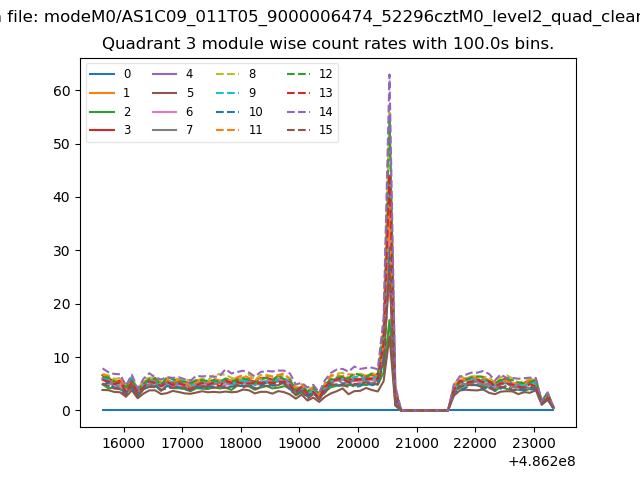
| Module-wise count rates for Quadrant A Data is divided into 100 sec bins |
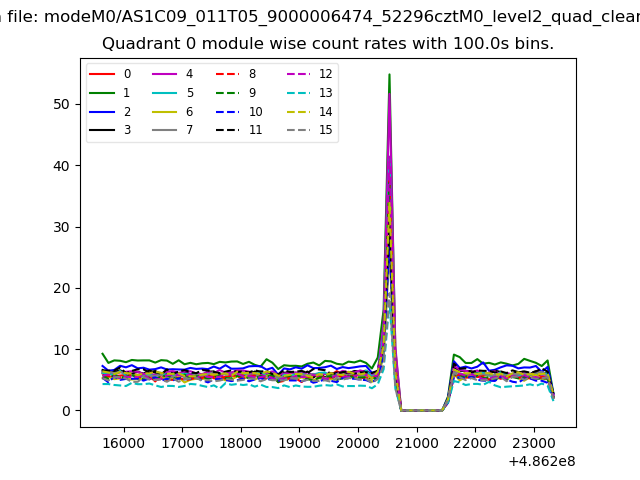 |
 |
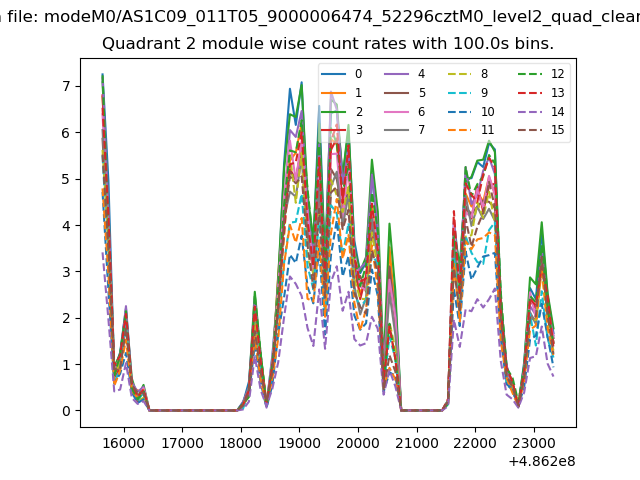
| Module-wise count rates for Quadrant B Data is divided into 100 sec bins |
 |
 |
| Module-wise count rates for Quadrant C Data is divided into 100 sec bins |
 |
 |
| Module-wise count rates for Quadrant D Data is divided into 100 sec bins |
 |
 |
| Parameter | Plot |
|---|---|
| CZT HV Monitor | 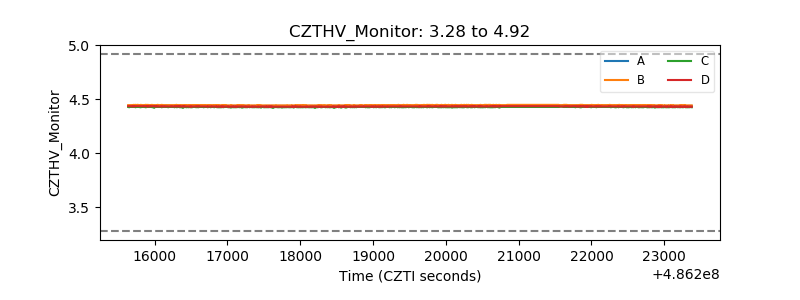 |
| D_VDD | 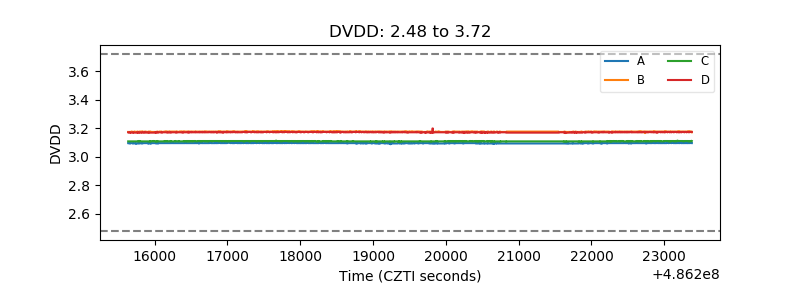 |
| Temperature 1 | 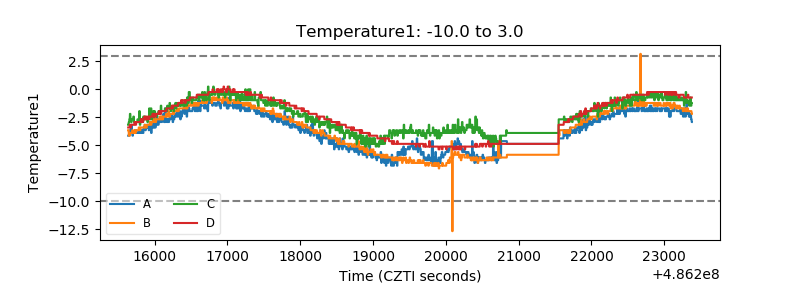 |
| Veto HV Monitor | 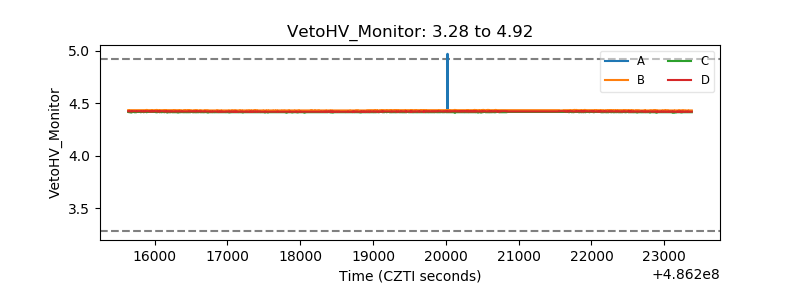 |
| Veto LLD | 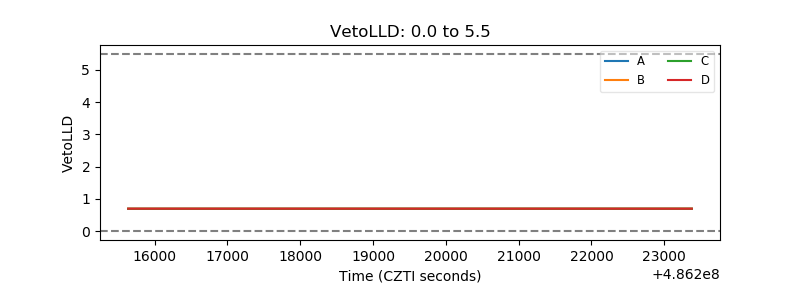 |
| Alpha Counter | 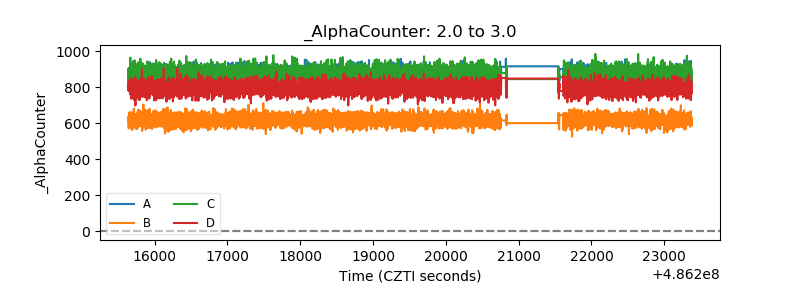 |
| _CPM_Rate | 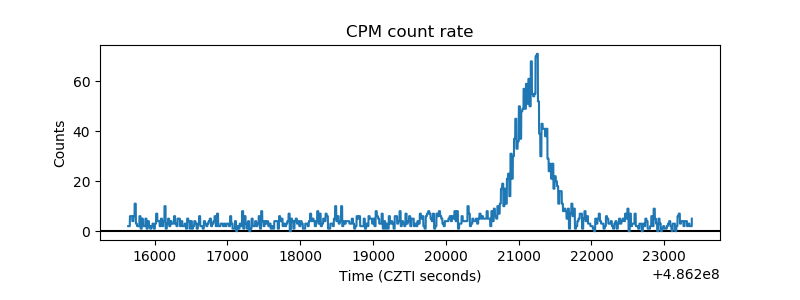 |
| CZT Counter | 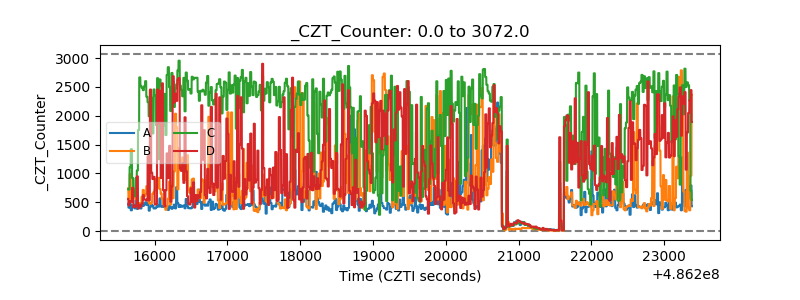 |
| +2.5 Volts monitor |  |
| +5 Volts monitor |  |
| _ROLL_ROT | 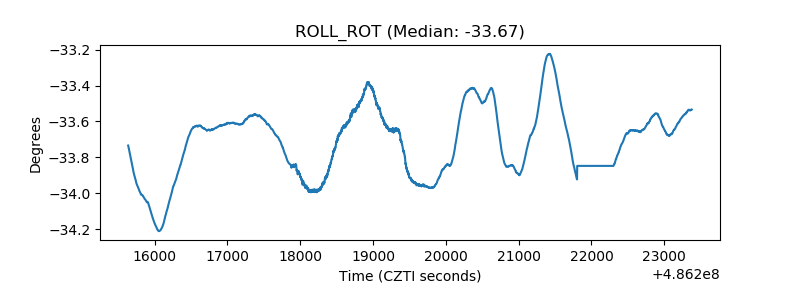 |
| _Roll_DEC | 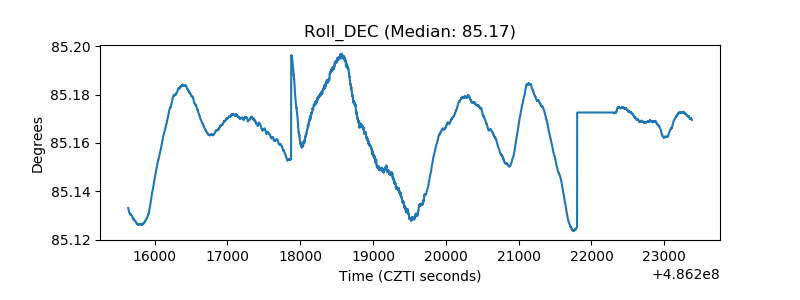 |
| _Roll_RA | 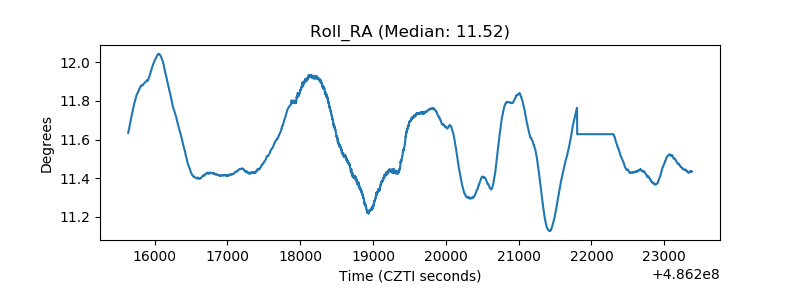 |
| Veto Counter | 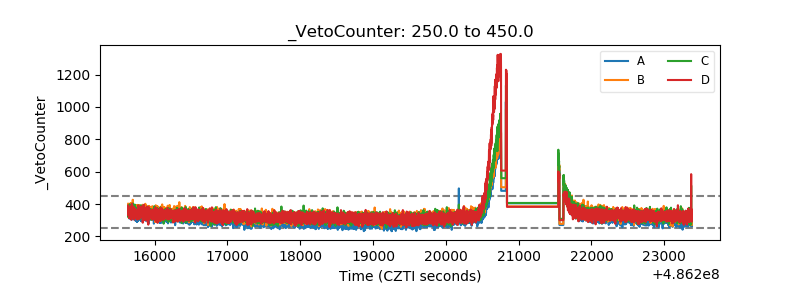 |