| Param | Original file | Final file |
|---|---|---|
| Filename | modeM0/AS1C09_011T05_9000006474_52297cztM0_level2.fits | modeM0/AS1C09_011T05_9000006474_52297cztM0_level2_quad_clean.evt |
| Size (bytes) | 949,898,880 | 79,776,000 |
| Size | 905.9 MB | 76.1 MB |
| Events in quadrant A | 5,774,027 | 586,484 |
| Events in quadrant B | 4,846,844 | 666,049 |
| Events in quadrant C | 12,940,060 | 292,002 |
| Events in quadrant D | 11,070,332 | 391,592 |
| Mode M0 | |||
|---|---|---|---|
| Quadrant | BADHDUFLAG | Total packets | Discarded packets |
| A | 0 | 21955 | 1 |
| B | 0 | 19203 | 1 |
| C | 0 | 43175 | 1 |
| D | 0 | 37608 | 6 |
| Mode SS | |||
|---|---|---|---|
| Quadrant | BADHDUFLAG | Total packets | Discarded packets |
| A | 0 | 140 | 0 |
| B | 0 | 140 | 0 |
| C | 0 | 140 | 0 |
| D | 0 | 140 | 0 |
| Mode M9 | |||
|---|---|---|---|
| Quadrant | BADHDUFLAG | Total packets | Discarded packets |
| A | 0 | 4 | 0 |
| B | 0 | 4 | 0 |
| C | 0 | 4 | 0 |
| D | 0 | 4 | 0 |
| Quadrant | Total seconds | Saturated seconds | Saturation percentage |
|---|---|---|---|
| A | 6870 | 835 | 12.154294% |
| B | 6870 | 406 | 5.909753% |
| C | 6870 | 4067 | 59.199418% |
| D | 6869 | 2766 | 40.267870% |
Noise dominated data is calculated using 1-second bins in cleaned event files. If a bin has >2000 counts, and if more than 50% of those come from <1% of pixels, then it is considered to be noise-dominated and hence unusable.
| Quadrant | # 1 sec bins | Bins with >0 counts | Bins with >2000 counts | High rate bins dominated by noise | Noise dominated (total time) | Noise dominated (detector-on time) | Marked lightcurve |
|---|---|---|---|---|---|---|---|
| A | 7230 | 6871 | 766 | 766 | 10.59% | 11.15% | 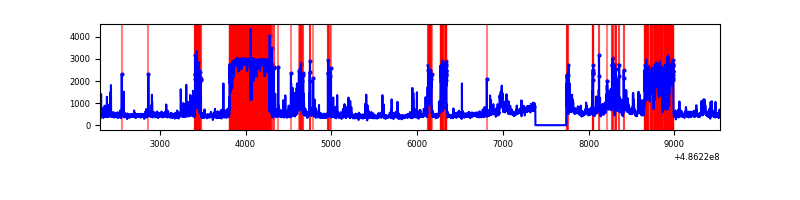 |
| B | 7230 | 6871 | 225 | 225 | 3.11% | 3.27% | 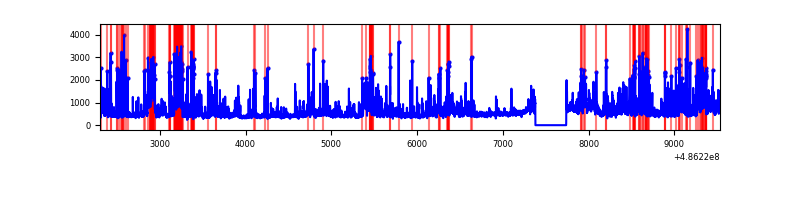 |
| C | 7229 | 6870 | 3575 | 3575 | 49.45% | 52.04% | 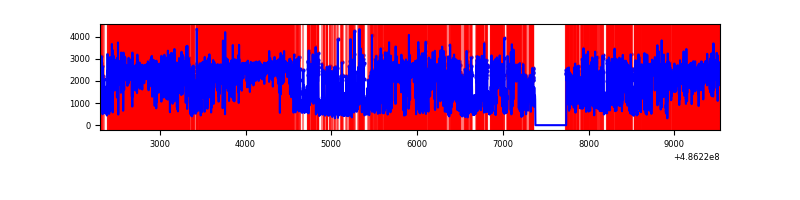 |
| D | 7228 | 6869 | 2292 | 2292 | 31.71% | 33.37% | 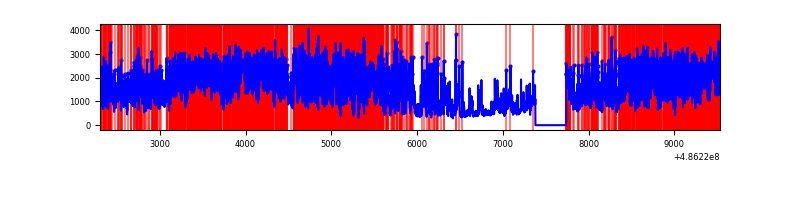 |
Top three noisy pixels from each quadrant. If the there are fewer than three noisy pixels in the level2.evt file, extra rows are filled as -1
| Pixel properties | Quadrant properties | ||||||
|---|---|---|---|---|---|---|---|
| Quadrant | DetID | PixID | Counts | Sigma | Mean | Median | Sigma |
| A | 4 | 249 | 2013994 | 11879.85 | 679 | 662 | 169.5 |
| A | 6 | 162 | 280772 | 1652.81 | 679 | 662 | 169.5 |
| A | 3 | 95 | 200922 | 1181.65 | 679 | 662 | 169.5 |
| B | 4 | 171 | 501215 | 3424.19 | 694 | 671 | 146.2 |
| B | 0 | 216 | 433081 | 2958.09 | 694 | 671 | 146.2 |
| B | 8 | 128 | 271159 | 1850.39 | 694 | 671 | 146.2 |
| C | 15 | 224 | 2661114 | 19728.26 | 490 | 485 | 134.9 |
| C | 0 | 161 | 2567598 | 19034.85 | 490 | 485 | 134.9 |
| C | 15 | 178 | 2511217 | 18616.79 | 490 | 485 | 134.9 |
| D | 15 | 93 | 7400812 | 43602.74 | 592 | 564 | 169.7 |
| D | 7 | 96 | 320883 | 1887.34 | 592 | 564 | 169.7 |
| D | 8 | 176 | 232954 | 1369.26 | 592 | 564 | 169.7 |
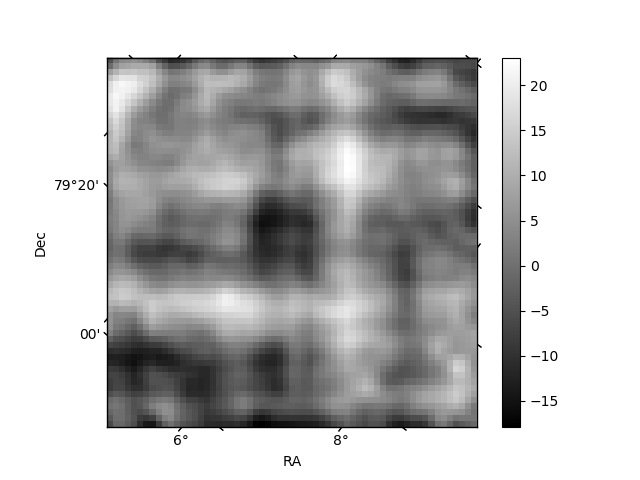
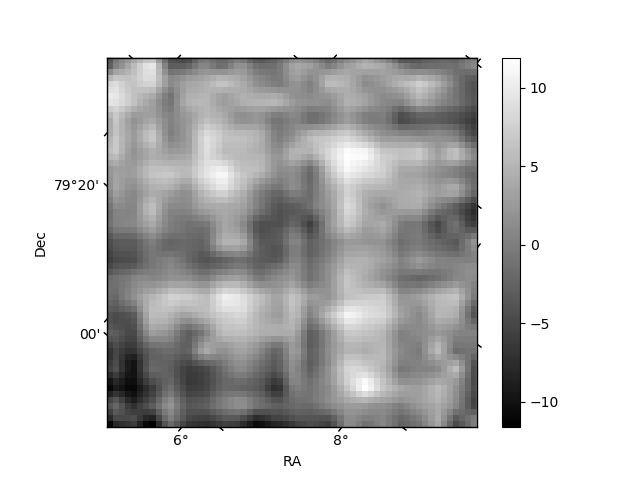
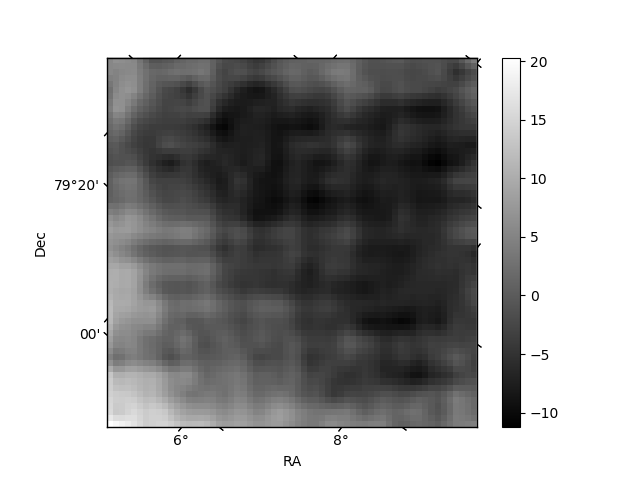
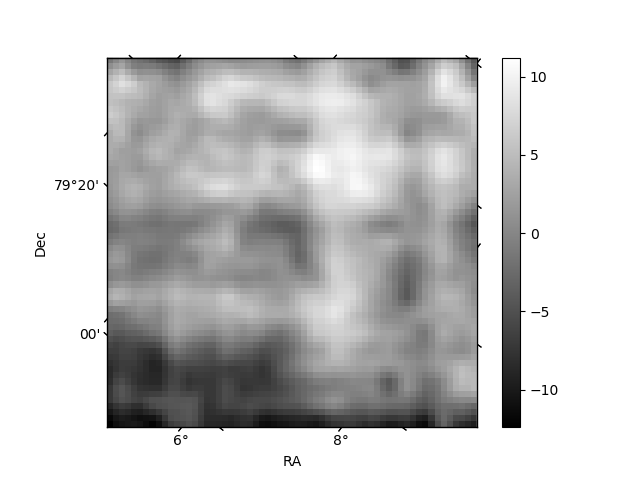
Histogram calculated using DETX and DETY for each event in the final _common_clean file
| Quadrant A | 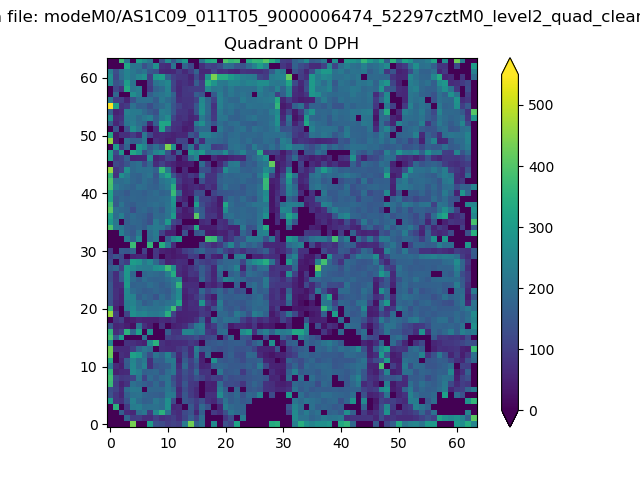 |
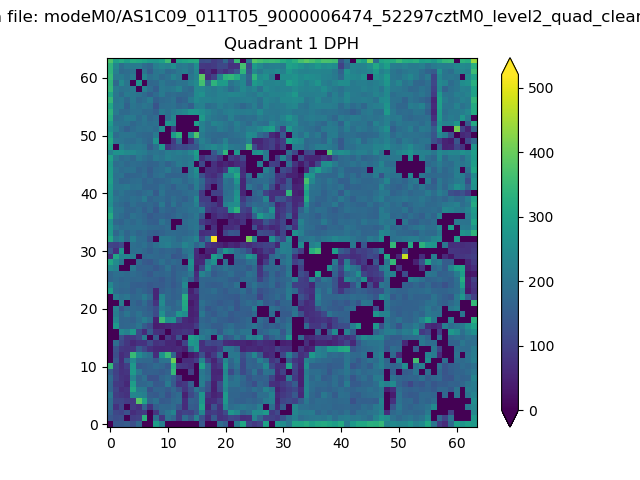 |
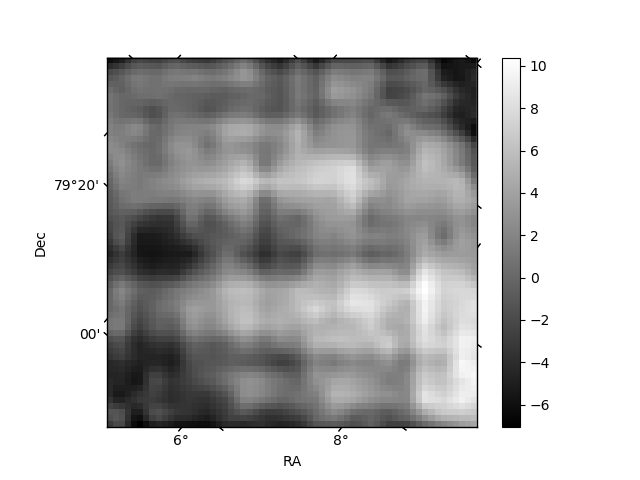
Quadrant B |
|---|---|---|---|
| Quadrant D |  |
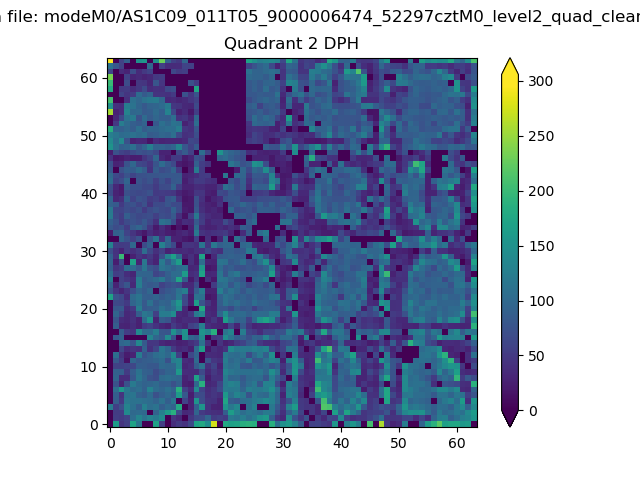 |
Quadrant C |
| Plot type | Count rate plots | Images |
|---|---|---|
| Comparison with Poisson distribution Blue bars denote a histogram of data divided into 1 sec bins. Red curve is a Poisson curve with rate = median count rate of data. |
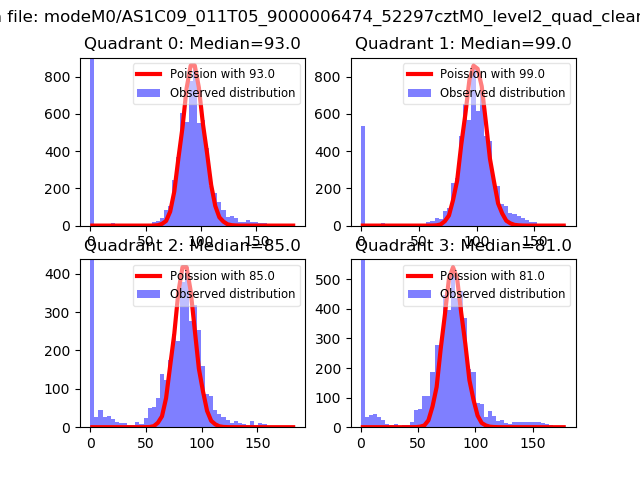 |
 |
| Quadrant-wise count rates Data is divided into 100 sec bins |
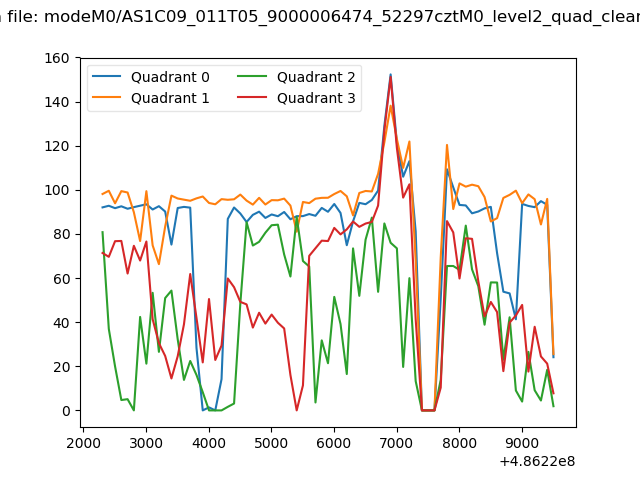 |
|
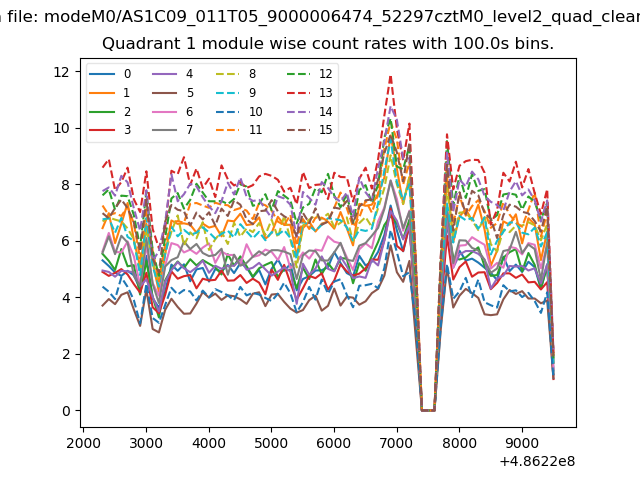
| Module-wise count rates for Quadrant A Data is divided into 100 sec bins |
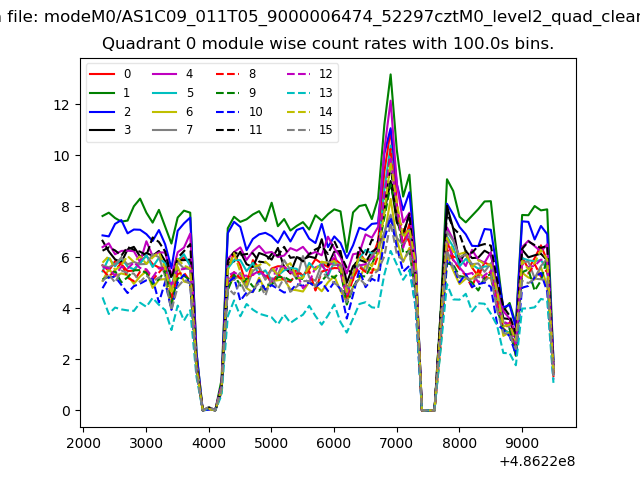 |
 |
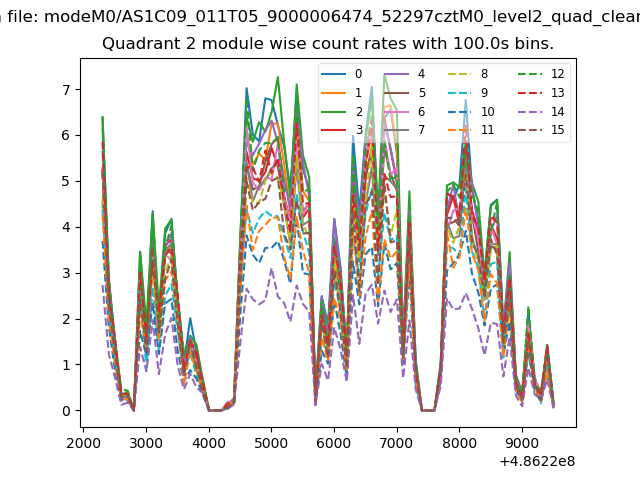
| Module-wise count rates for Quadrant B Data is divided into 100 sec bins |
 |
 |
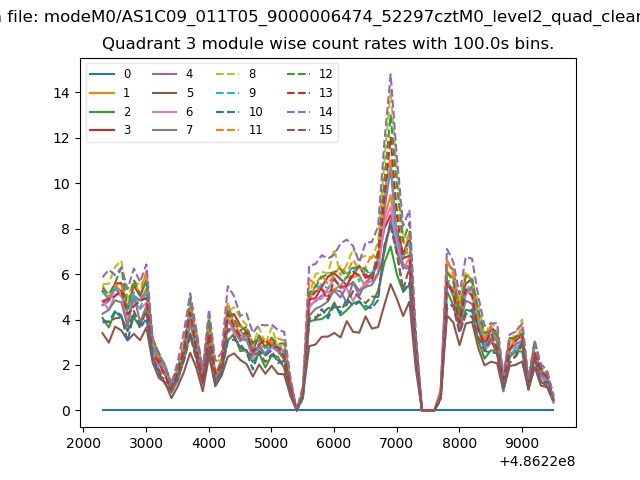
| Module-wise count rates for Quadrant C Data is divided into 100 sec bins |
 |
 |
| Module-wise count rates for Quadrant D Data is divided into 100 sec bins |
 |
 |
| Parameter | Plot |
|---|---|
| CZT HV Monitor | 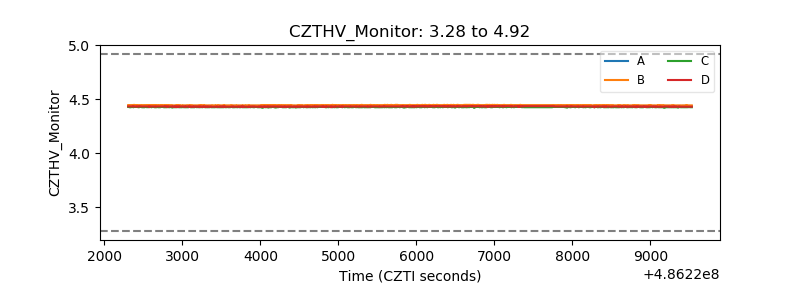 |
| D_VDD | 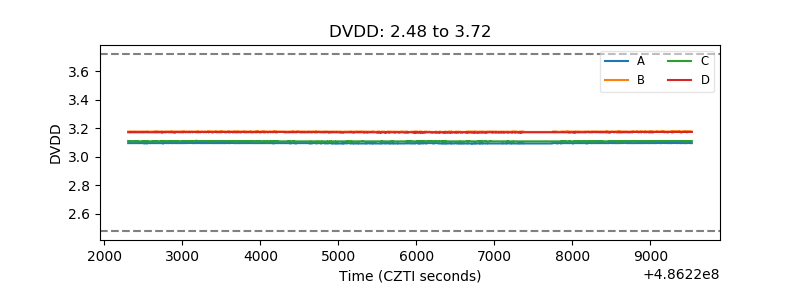 |
| Temperature 1 | 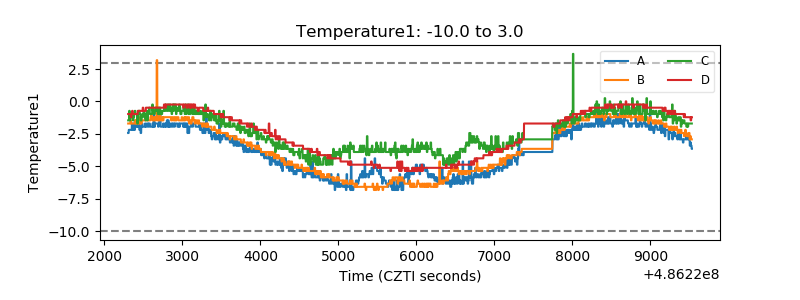 |
| Veto HV Monitor | 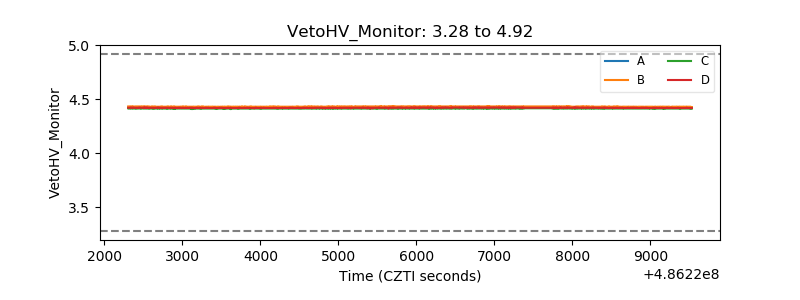 |
| Veto LLD | 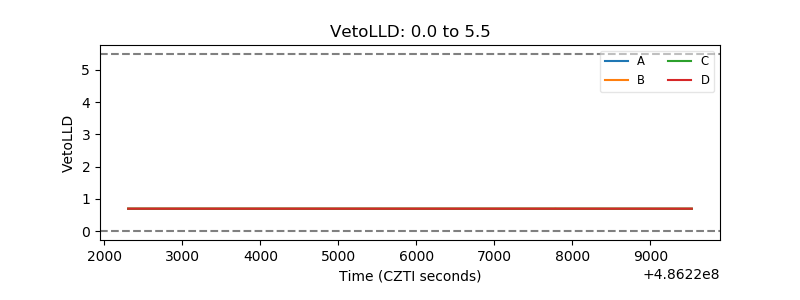 |
| Alpha Counter | 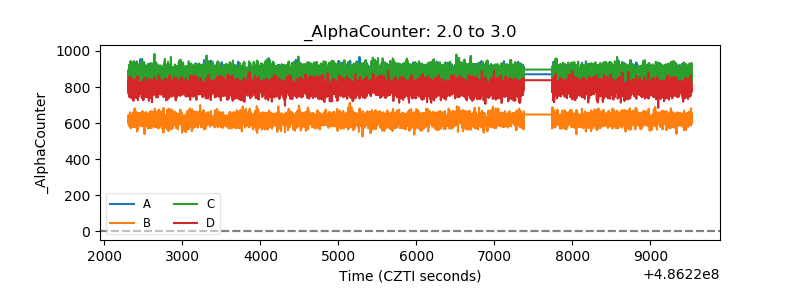 |
| _CPM_Rate | 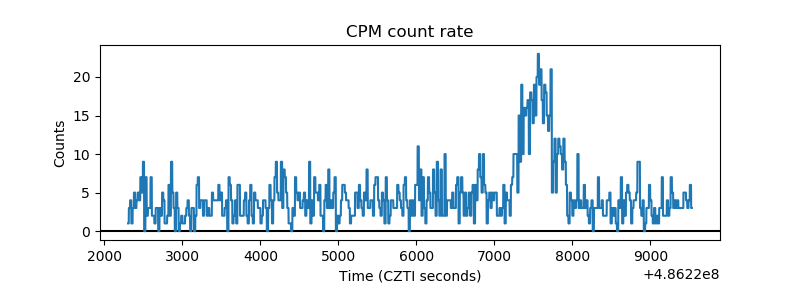 |
| CZT Counter | 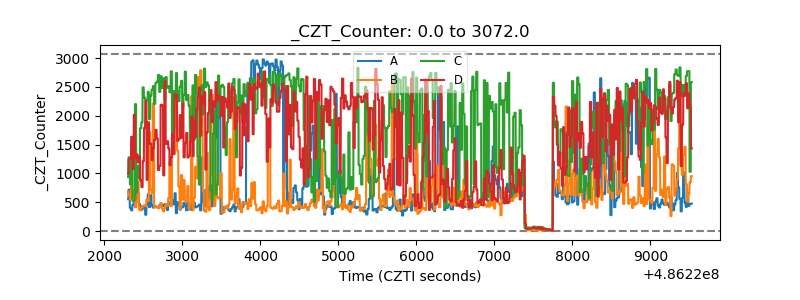 |
| +2.5 Volts monitor |  |
| +5 Volts monitor |  |
| _ROLL_ROT | 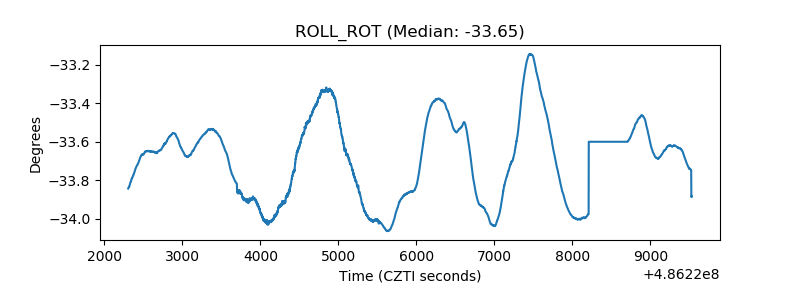 |
| _Roll_DEC | 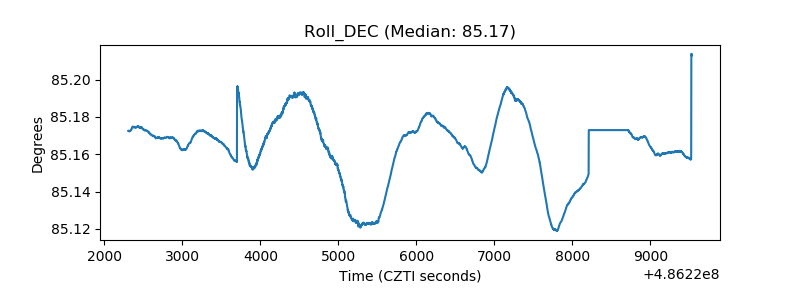 |
| _Roll_RA | 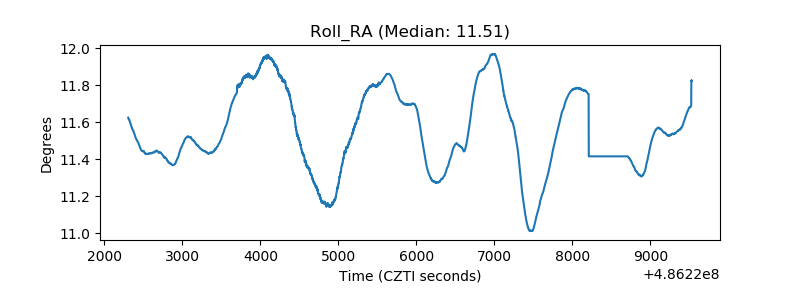 |
| Veto Counter | 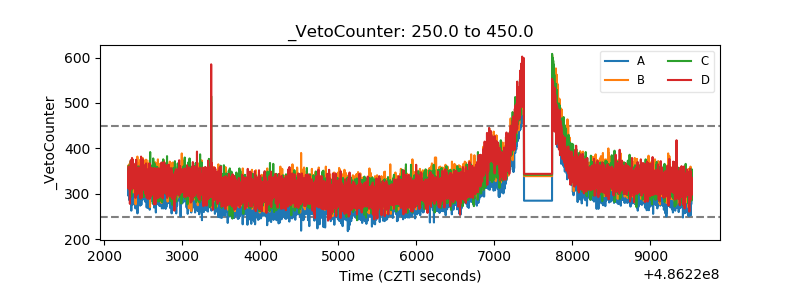 |