| Param | Original file | Final file |
|---|---|---|
| Filename | modeM0/AS1C09_011T05_9000006474_52298cztM0_level2.fits | modeM0/AS1C09_011T05_9000006474_52298cztM0_level2_quad_clean.evt |
| Size (bytes) | 936,745,920 | 81,668,160 |
| Size | 893.4 MB | 77.9 MB |
| Events in quadrant A | 4,501,331 | 659,671 |
| Events in quadrant B | 6,549,191 | 639,139 |
| Events in quadrant C | 12,925,459 | 289,026 |
| Events in quadrant D | 10,161,613 | 400,054 |
| Mode M0 | |||
|---|---|---|---|
| Quadrant | BADHDUFLAG | Total packets | Discarded packets |
| A | 0 | 18263 | 0 |
| B | 0 | 24320 | 0 |
| C | 0 | 43166 | 0 |
| D | 0 | 35022 | 0 |
| Mode SS | |||
|---|---|---|---|
| Quadrant | BADHDUFLAG | Total packets | Discarded packets |
| A | 0 | 140 | 0 |
| B | 0 | 140 | 0 |
| C | 0 | 140 | 0 |
| D | 0 | 140 | 0 |
| Quadrant | Total seconds | Saturated seconds | Saturation percentage |
|---|---|---|---|
| A | 6948 | 329 | 4.735176% |
| B | 6949 | 936 | 13.469564% |
| C | 6949 | 4342 | 62.483811% |
| D | 6949 | 2834 | 40.782846% |
Noise dominated data is calculated using 1-second bins in cleaned event files. If a bin has >2000 counts, and if more than 50% of those come from <1% of pixels, then it is considered to be noise-dominated and hence unusable.
| Quadrant | # 1 sec bins | Bins with >0 counts | Bins with >2000 counts | High rate bins dominated by noise | Noise dominated (total time) | Noise dominated (detector-on time) | Marked lightcurve |
|---|---|---|---|---|---|---|---|
| A | 6948 | 6948 | 261 | 261 | 3.76% | 3.76% | 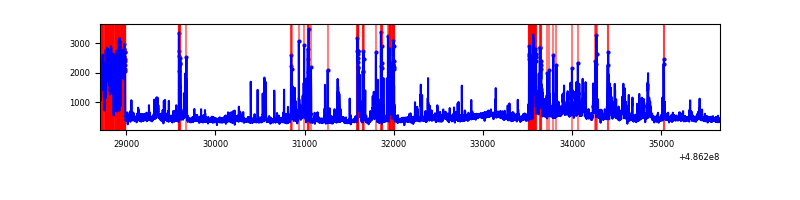 |
| B | 6949 | 6949 | 613 | 613 | 8.82% | 8.82% | 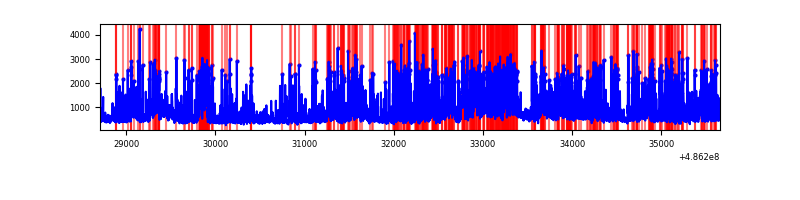 |
| C | 6948 | 6948 | 3661 | 3661 | 52.69% | 52.69% | 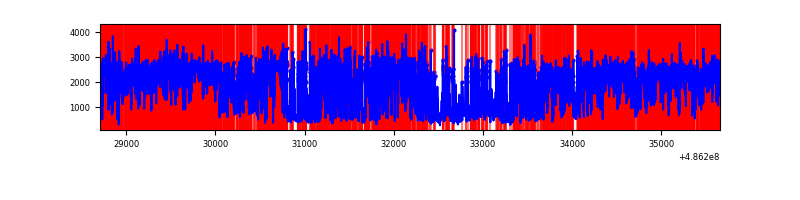 |
| D | 6949 | 6949 | 2461 | 2461 | 35.42% | 35.42% | 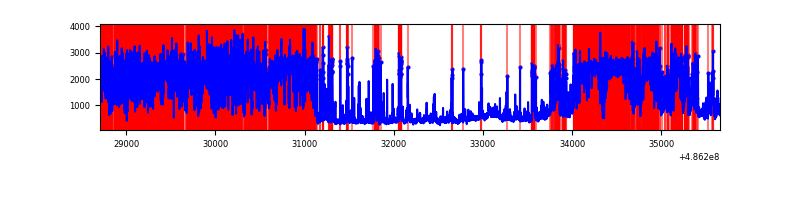 |
Top three noisy pixels from each quadrant. If the there are fewer than three noisy pixels in the level2.evt file, extra rows are filled as -1
| Pixel properties | Quadrant properties | ||||||
|---|---|---|---|---|---|---|---|
| Quadrant | DetID | PixID | Counts | Sigma | Mean | Median | Sigma |
| A | 4 | 249 | 585704 | 3189.64 | 724 | 707 | 183.4 |
| A | 7 | 206 | 518960 | 2825.73 | 724 | 707 | 183.4 |
| A | 5 | 240 | 96145 | 520.37 | 724 | 707 | 183.4 |
| B | 12 | 32 | 1884869 | 13051.26 | 685 | 663 | 144.4 |
| B | 4 | 171 | 577926 | 3998.5 | 685 | 663 | 144.4 |
| B | 10 | 254 | 457272 | 3162.77 | 685 | 663 | 144.4 |
| C | 0 | 161 | 3853641 | 30940.67 | 444 | 441 | 124.5 |
| C | 15 | 178 | 2952725 | 23706.44 | 444 | 441 | 124.5 |
| C | 15 | 224 | 2098128 | 16844.14 | 444 | 441 | 124.5 |
| D | 15 | 93 | 5081627 | 31196.53 | 560 | 533 | 162.9 |
| D | 6 | 42 | 1738443 | 10670.29 | 560 | 533 | 162.9 |
| D | 8 | 176 | 346586 | 2124.67 | 560 | 533 | 162.9 |
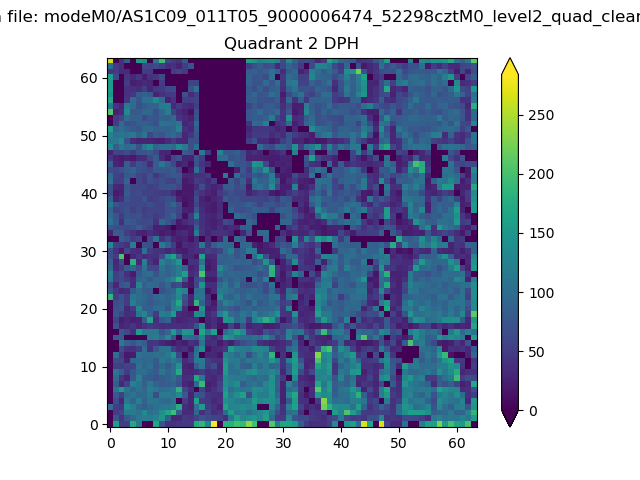
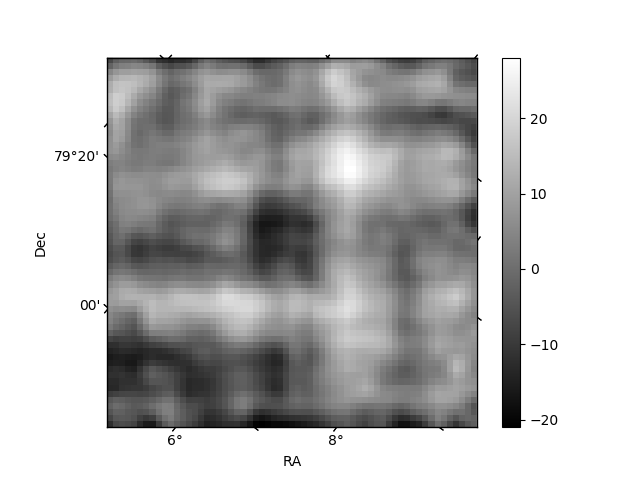
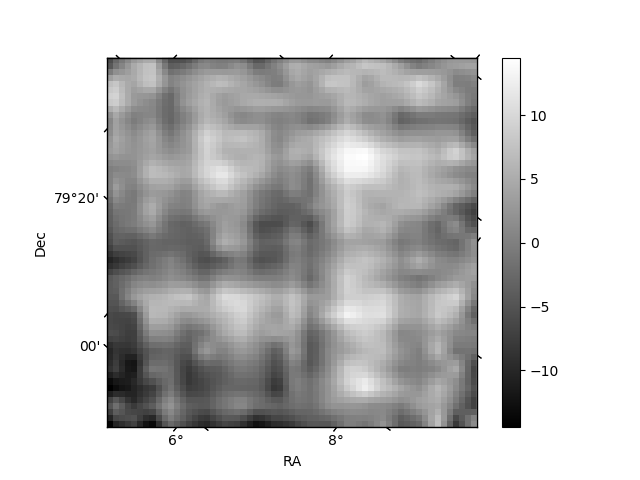
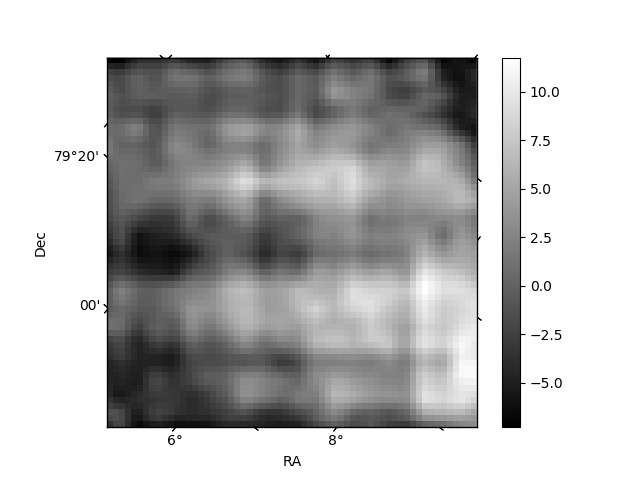
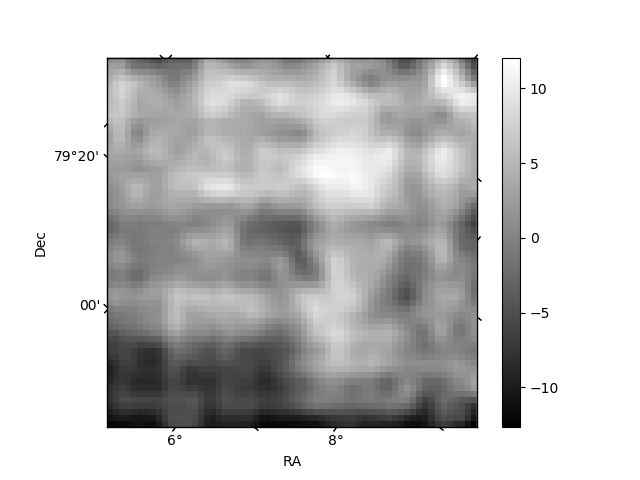
Histogram calculated using DETX and DETY for each event in the final _common_clean file
| Quadrant A | 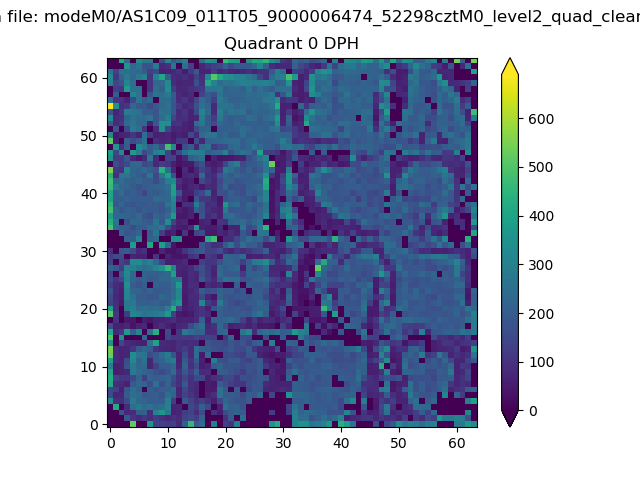 |
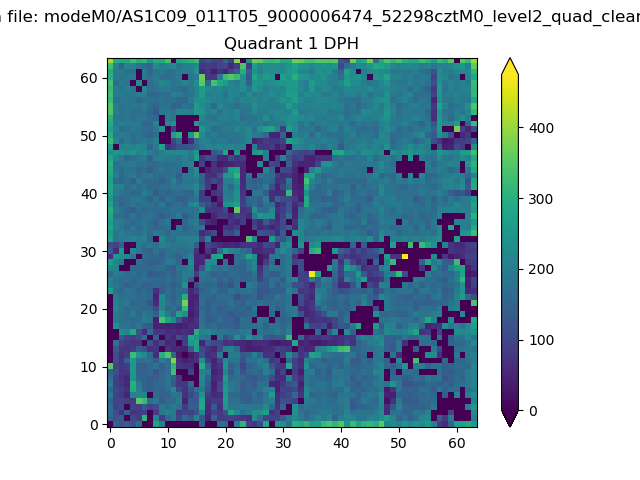 |
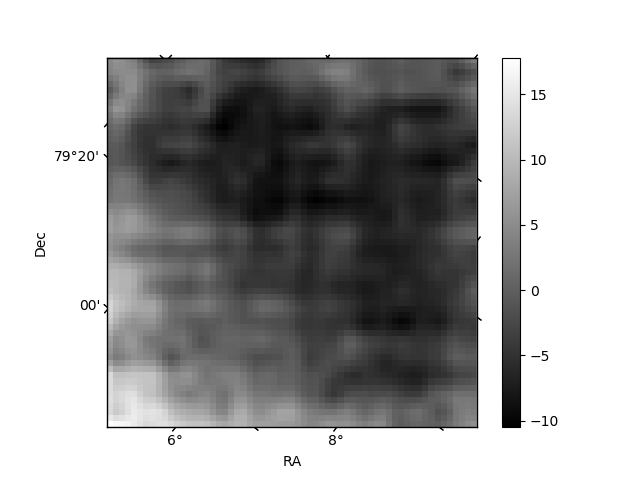
Quadrant B |
|---|---|---|---|
| Quadrant D | 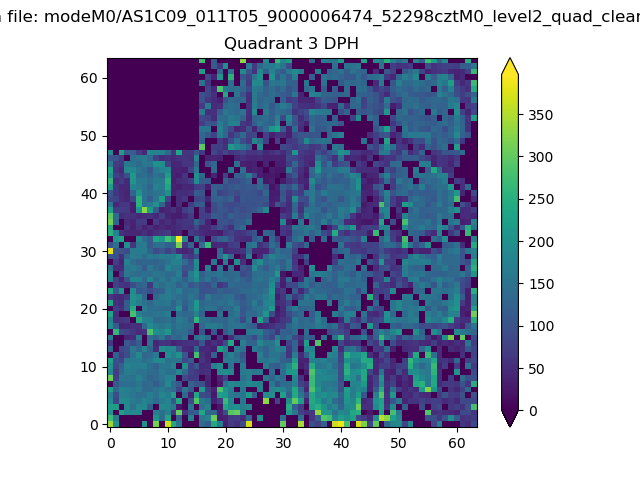 |
 |
Quadrant C |
| Plot type | Count rate plots | Images |
|---|---|---|
| Comparison with Poisson distribution Blue bars denote a histogram of data divided into 1 sec bins. Red curve is a Poisson curve with rate = median count rate of data. |
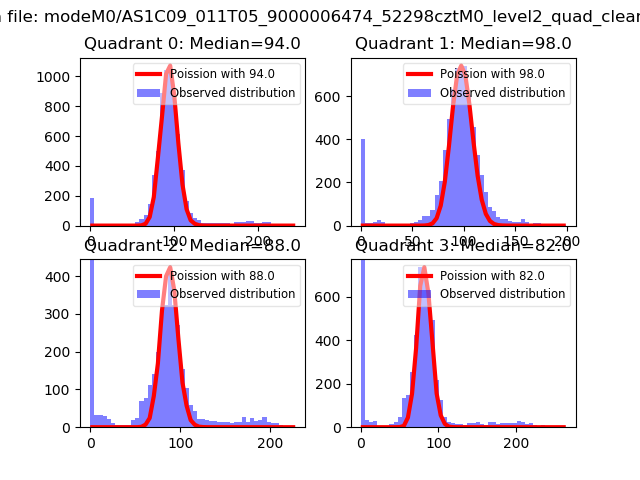 |
 |
| Quadrant-wise count rates Data is divided into 100 sec bins |
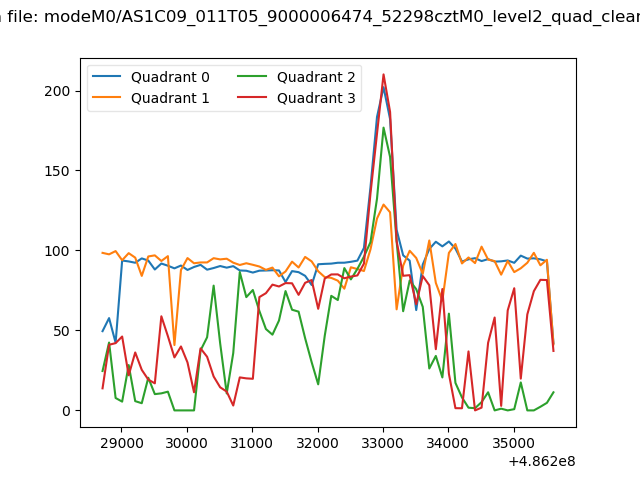 |
|
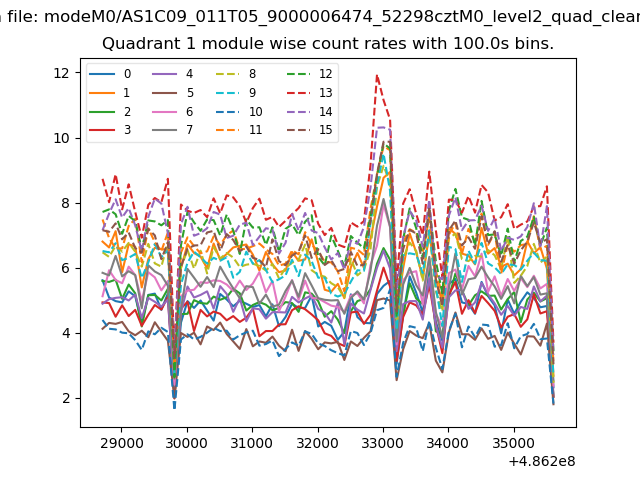
| Module-wise count rates for Quadrant A Data is divided into 100 sec bins |
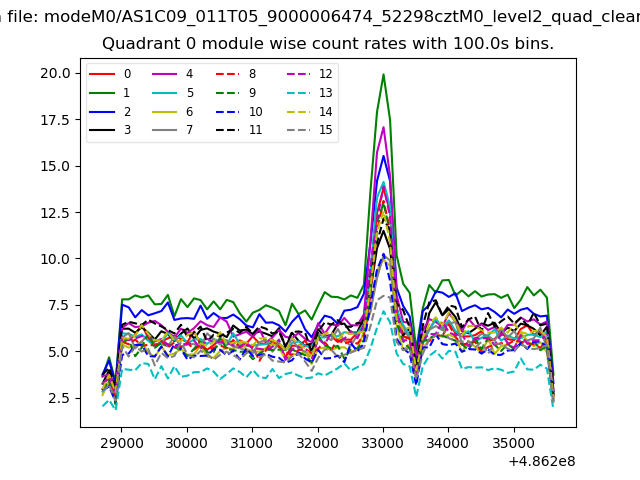 |
 |
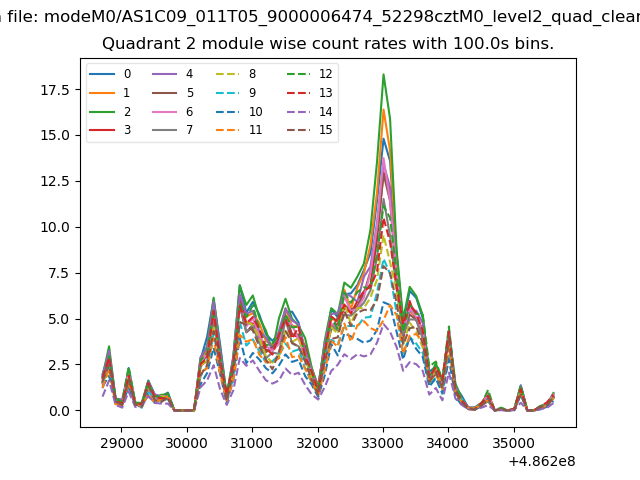
| Module-wise count rates for Quadrant B Data is divided into 100 sec bins |
 |
 |
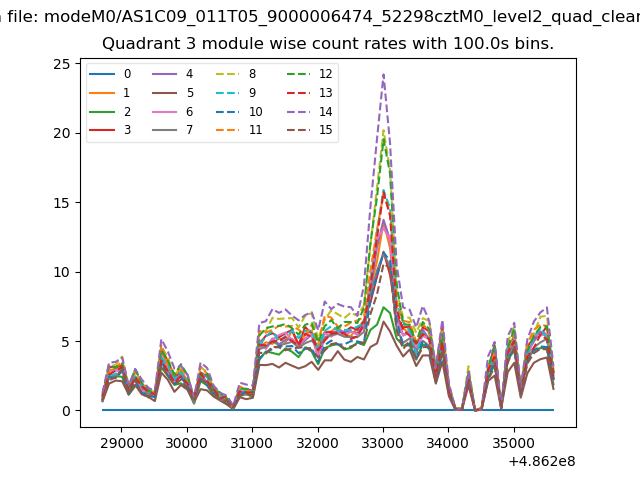
| Module-wise count rates for Quadrant C Data is divided into 100 sec bins |
 |
 |
| Module-wise count rates for Quadrant D Data is divided into 100 sec bins |
 |
 |
| Parameter | Plot |
|---|---|
| CZT HV Monitor | 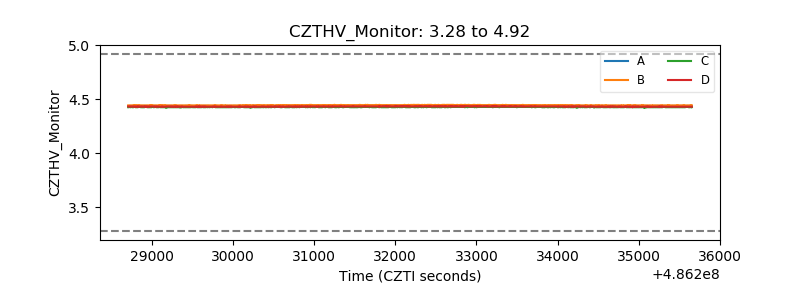 |
| D_VDD | 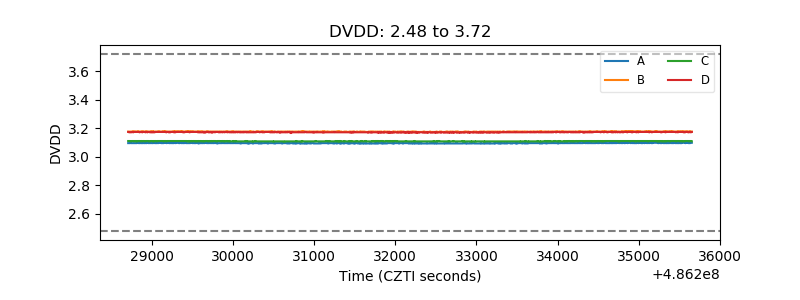 |
| Temperature 1 | 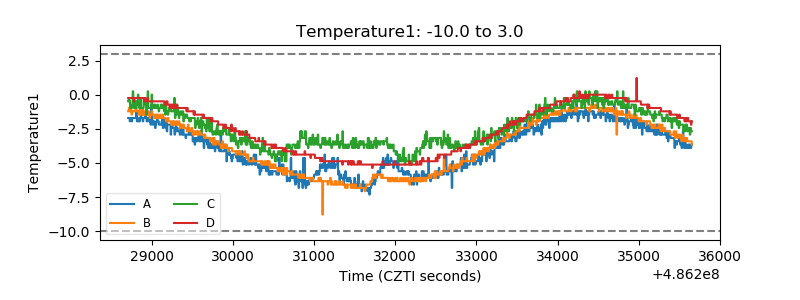 |
| Veto HV Monitor | 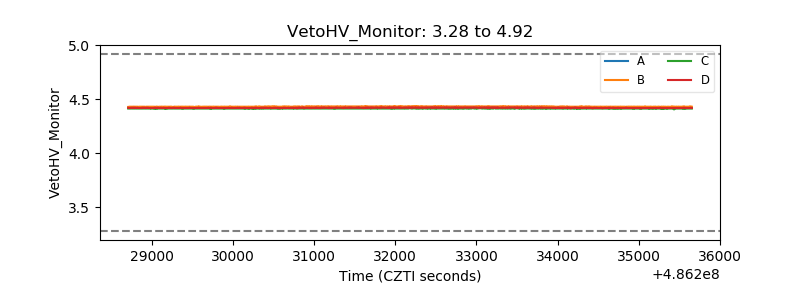 |
| Veto LLD | 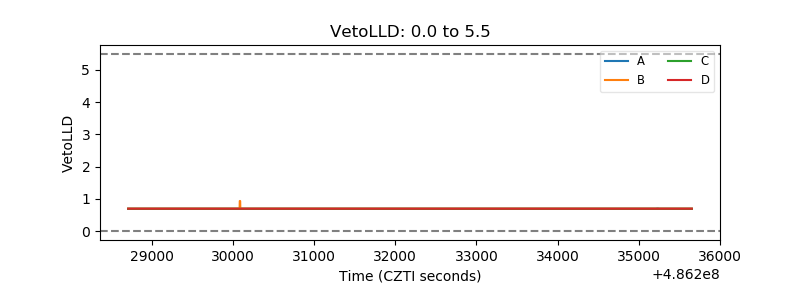 |
| Alpha Counter | 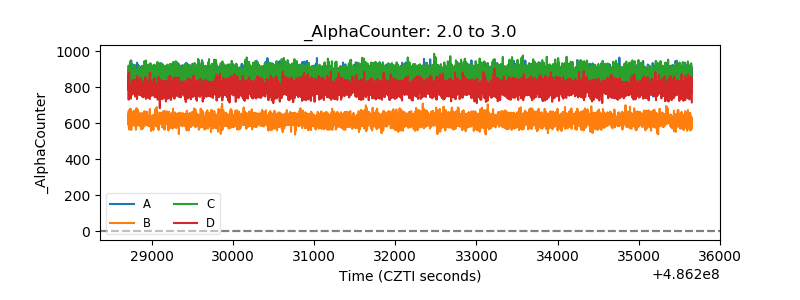 |
| _CPM_Rate | 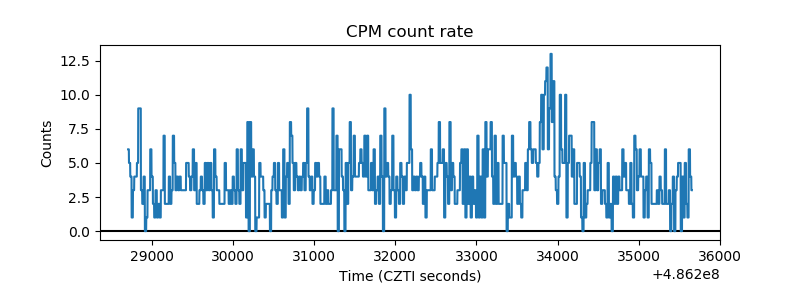 |
| CZT Counter | 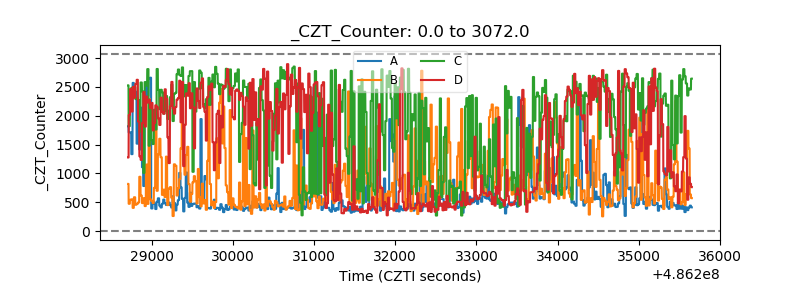 |
| +2.5 Volts monitor | 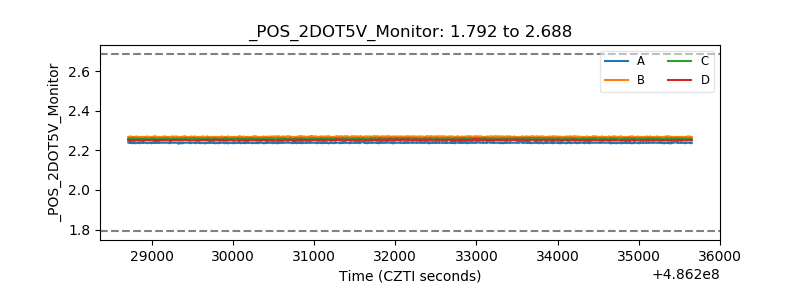 |
| +5 Volts monitor |  |
| _ROLL_ROT | 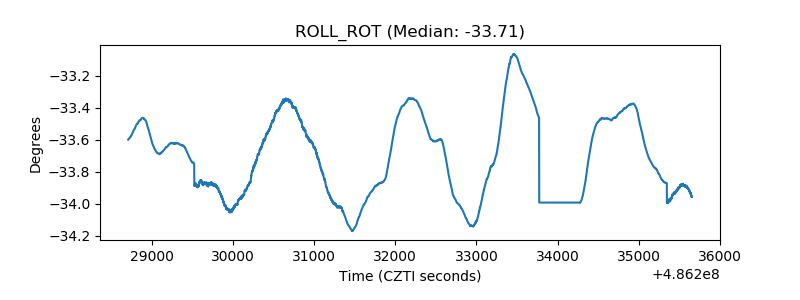 |
| _Roll_DEC | 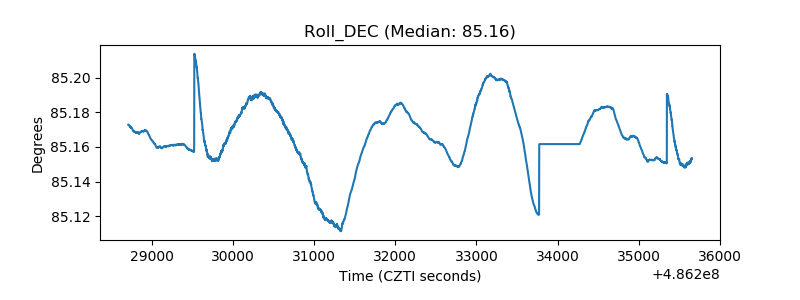 |
| _Roll_RA | 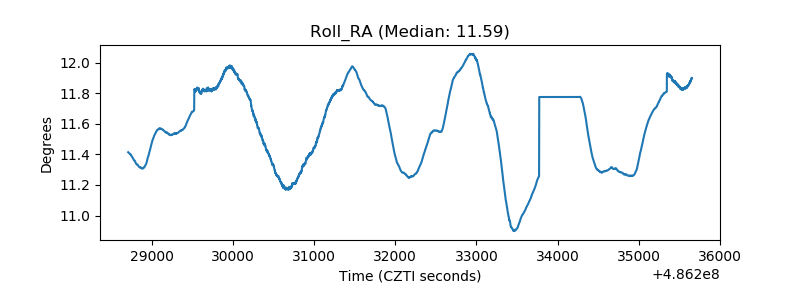 |
| Veto Counter | 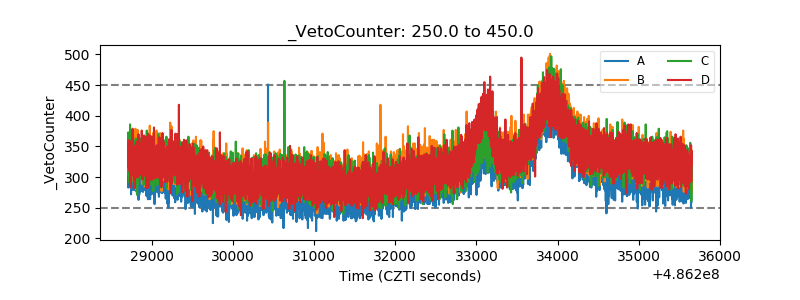 |