| Param | Original file | Final file |
|---|---|---|
| Filename | modeM0/AS1C09_011T05_9000006474_52299cztM0_level2.fits | modeM0/AS1C09_011T05_9000006474_52299cztM0_level2_quad_clean.evt |
| Size (bytes) | 1,074,087,360 | 87,264,000 |
| Size | 1.0 GB | 83.2 MB |
| Events in quadrant A | 4,679,317 | 723,136 |
| Events in quadrant B | 8,958,778 | 636,877 |
| Events in quadrant C | 16,184,205 | 176,357 |
| Events in quadrant D | 9,343,223 | 570,998 |
| Mode M0 | |||
|---|---|---|---|
| Quadrant | BADHDUFLAG | Total packets | Discarded packets |
| A | 0 | 19449 | 0 |
| B | 0 | 31948 | 0 |
| C | 0 | 53353 | 2 |
| D | 0 | 33130 | 0 |
| Mode SS | |||
|---|---|---|---|
| Quadrant | BADHDUFLAG | Total packets | Discarded packets |
| A | 0 | 154 | 0 |
| B | 0 | 154 | 0 |
| C | 0 | 154 | 0 |
| D | 0 | 154 | 0 |
| Quadrant | Total seconds | Saturated seconds | Saturation percentage |
|---|---|---|---|
| A | 7681 | 310 | 4.035933% |
| B | 7681 | 1831 | 23.838042% |
| C | 7680 | 6103 | 79.466146% |
| D | 7681 | 1535 | 19.984377% |
Noise dominated data is calculated using 1-second bins in cleaned event files. If a bin has >2000 counts, and if more than 50% of those come from <1% of pixels, then it is considered to be noise-dominated and hence unusable.
| Quadrant | # 1 sec bins | Bins with >0 counts | Bins with >2000 counts | High rate bins dominated by noise | Noise dominated (total time) | Noise dominated (detector-on time) | Marked lightcurve |
|---|---|---|---|---|---|---|---|
| A | 7681 | 7681 | 190 | 190 | 2.47% | 2.47% | 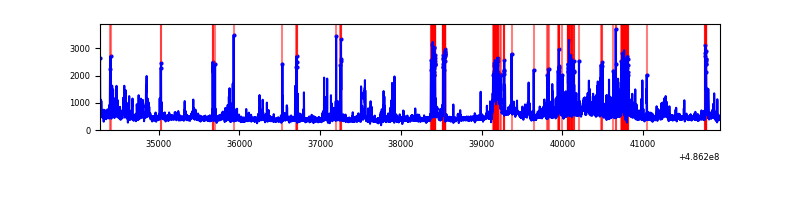 |
| B | 7681 | 7681 | 1344 | 1344 | 17.50% | 17.50% | 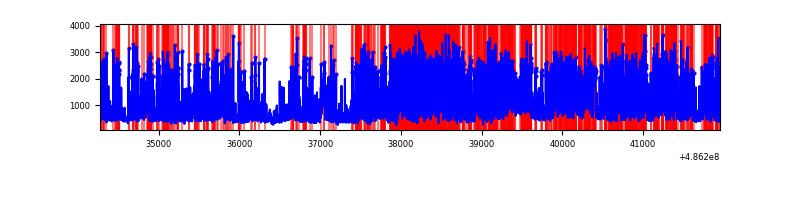 |
| C | 7679 | 7679 | 5075 | 5075 | 66.09% | 66.09% | 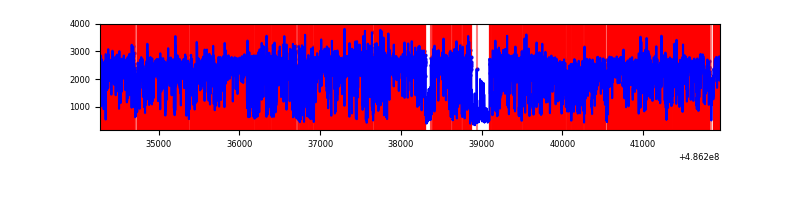 |
| D | 7680 | 7680 | 1516 | 1516 | 19.74% | 19.74% | 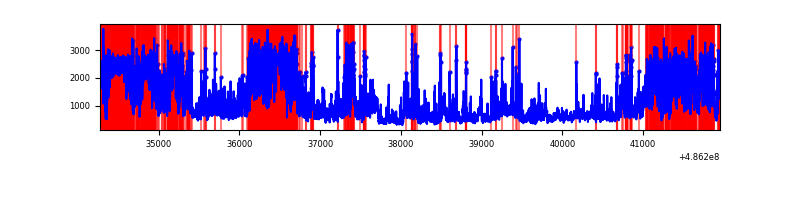 |
Top three noisy pixels from each quadrant. If the there are fewer than three noisy pixels in the level2.evt file, extra rows are filled as -1
| Pixel properties | Quadrant properties | ||||||
|---|---|---|---|---|---|---|---|
| Quadrant | DetID | PixID | Counts | Sigma | Mean | Median | Sigma |
| A | 7 | 206 | 428702 | 2115.06 | 800 | 781 | 202.3 |
| A | 4 | 249 | 248295 | 1223.37 | 800 | 781 | 202.3 |
| A | 11 | 3 | 166853 | 820.84 | 800 | 781 | 202.3 |
| B | 12 | 32 | 4138108 | 26665.45 | 725 | 703 | 155.2 |
| B | 4 | 171 | 829187 | 5339.55 | 725 | 703 | 155.2 |
| B | 0 | 216 | 280426 | 1802.81 | 725 | 703 | 155.2 |
| C | 15 | 178 | 7834066 | 76401.03 | 360 | 357 | 102.5 |
| C | 0 | 161 | 4425833 | 43161.03 | 360 | 357 | 102.5 |
| C | 15 | 224 | 1328874 | 12956.83 | 360 | 357 | 102.5 |
| D | 6 | 42 | 3637049 | 17406.4 | 732 | 703 | 208.9 |
| D | 15 | 93 | 848748 | 4059.4 | 732 | 703 | 208.9 |
| D | 12 | 17 | 581681 | 2781.01 | 732 | 703 | 208.9 |
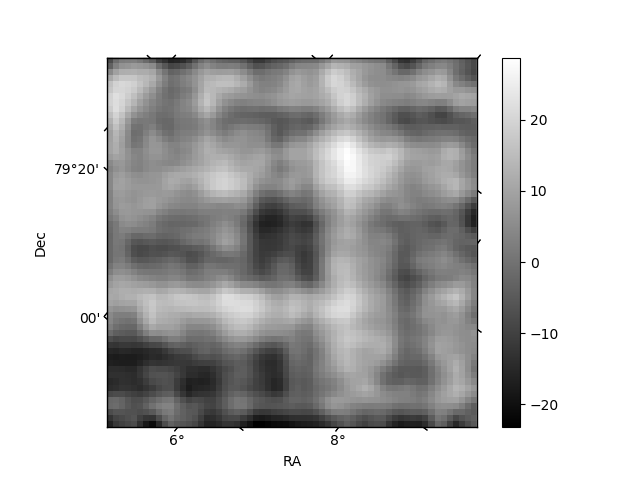
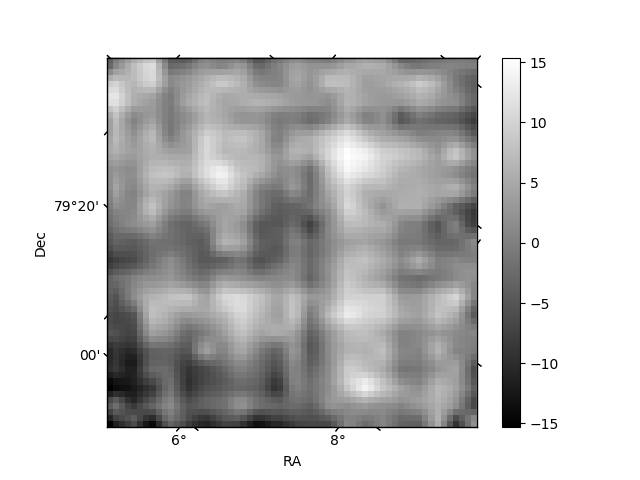
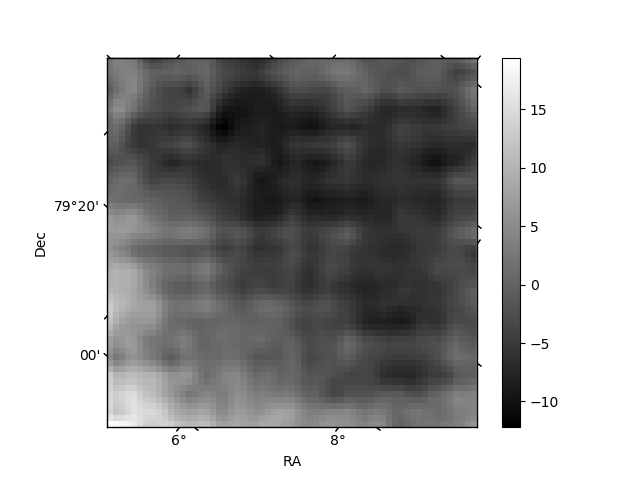
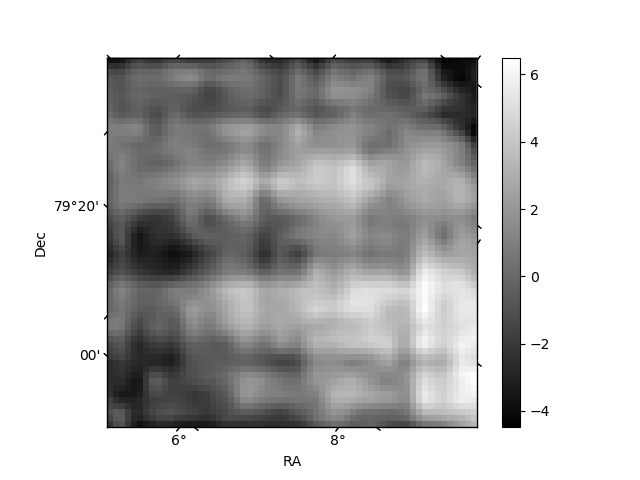
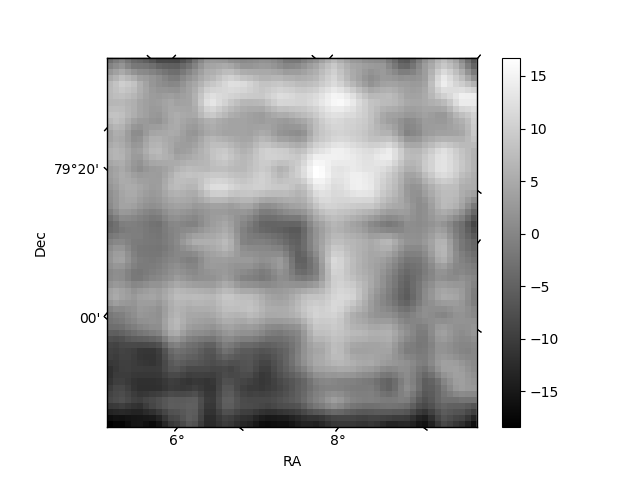
Histogram calculated using DETX and DETY for each event in the final _common_clean file
| Quadrant A | 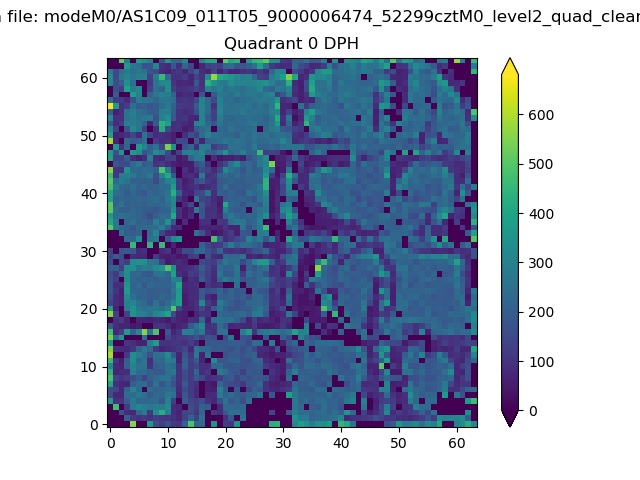 |
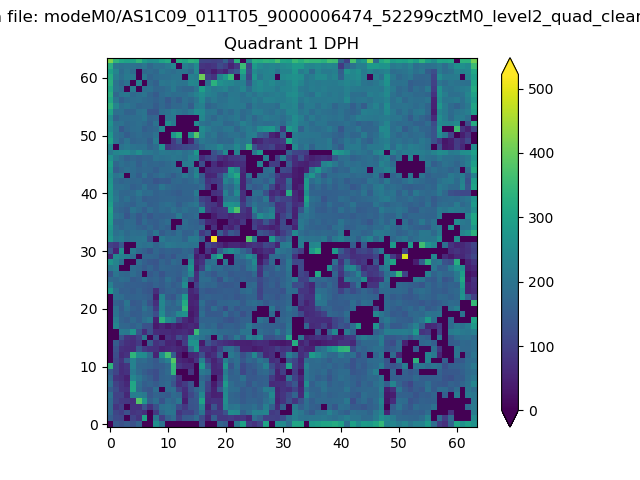 |
Quadrant B |
|---|---|---|---|
| Quadrant D | 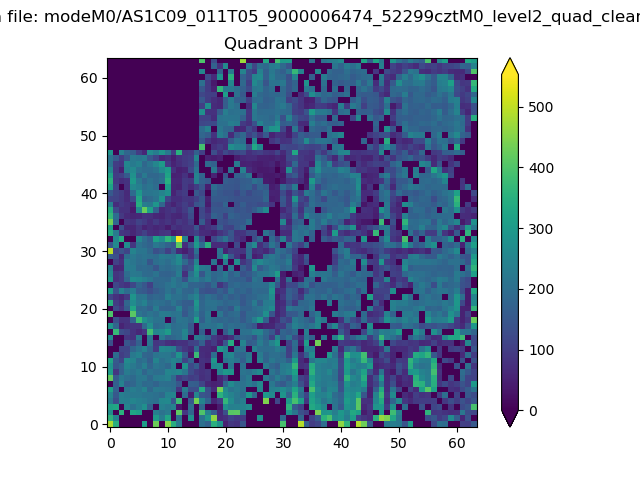 |
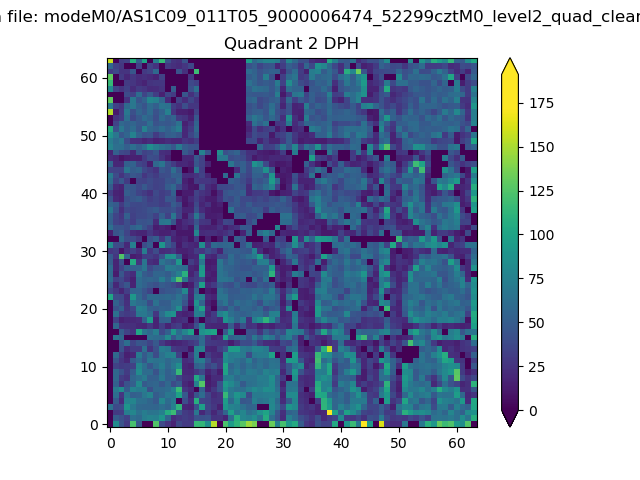 |
Quadrant C |
| Plot type | Count rate plots | Images |
|---|---|---|
| Comparison with Poisson distribution Blue bars denote a histogram of data divided into 1 sec bins. Red curve is a Poisson curve with rate = median count rate of data. |
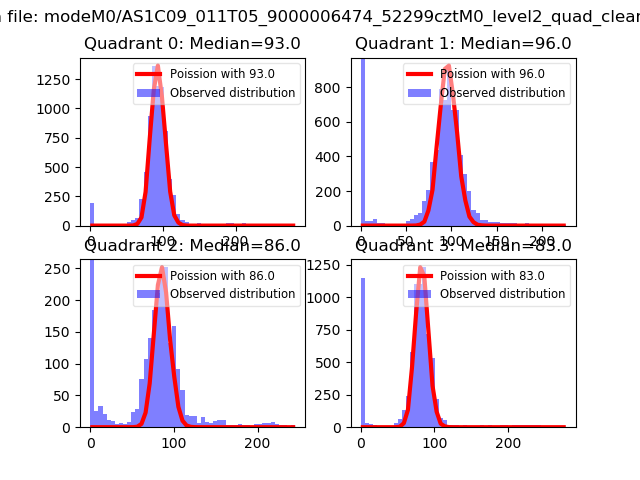 |
 |
| Quadrant-wise count rates Data is divided into 100 sec bins |
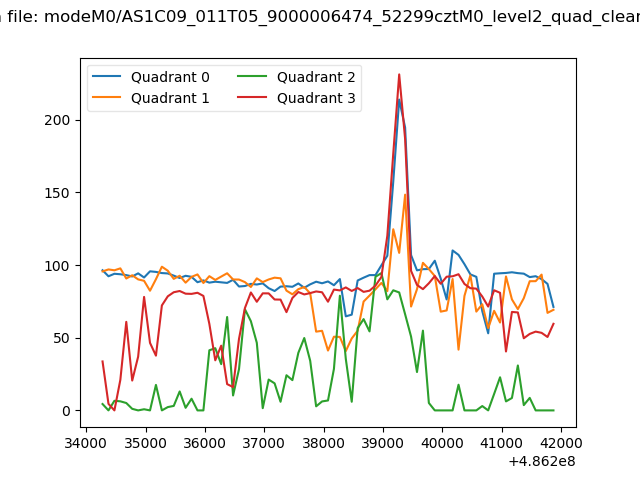 |
|
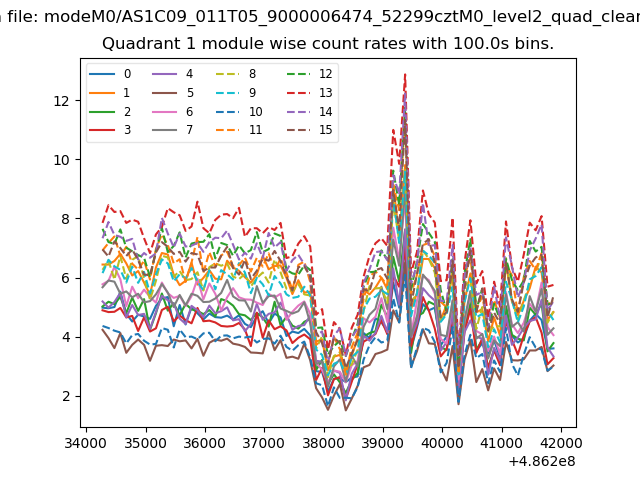
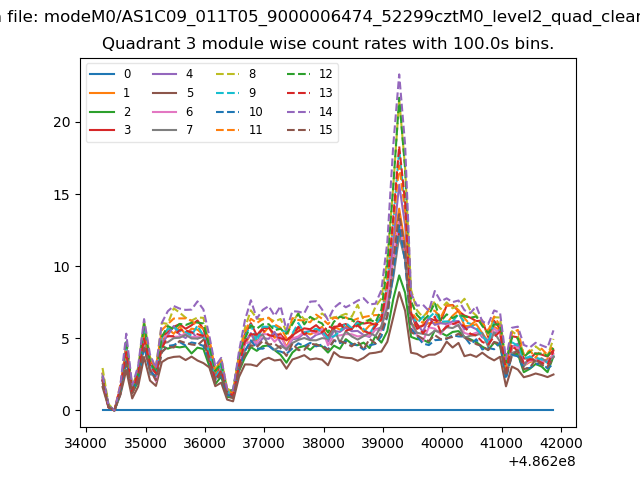
| Module-wise count rates for Quadrant A Data is divided into 100 sec bins |
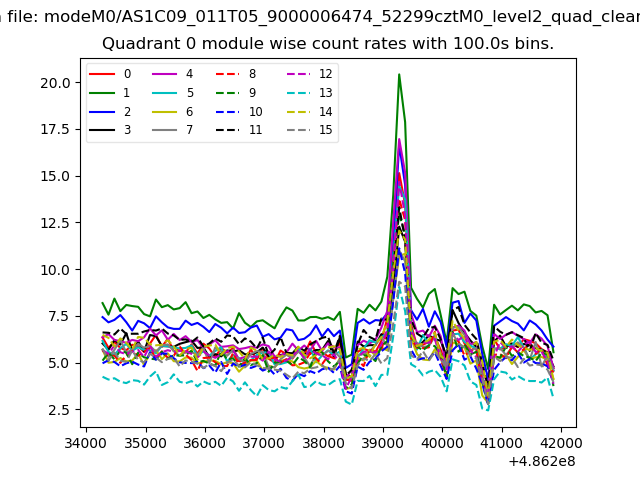 |
 |
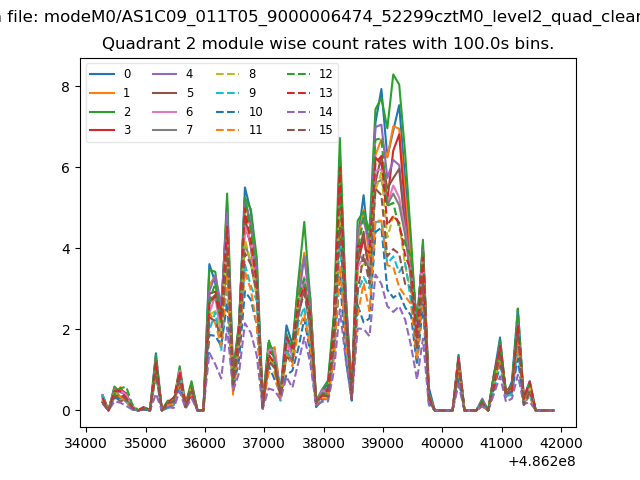
| Module-wise count rates for Quadrant B Data is divided into 100 sec bins |
 |
 |
| Module-wise count rates for Quadrant C Data is divided into 100 sec bins |
 |
 |
| Module-wise count rates for Quadrant D Data is divided into 100 sec bins |
 |
 |
| Parameter | Plot |
|---|---|
| CZT HV Monitor | 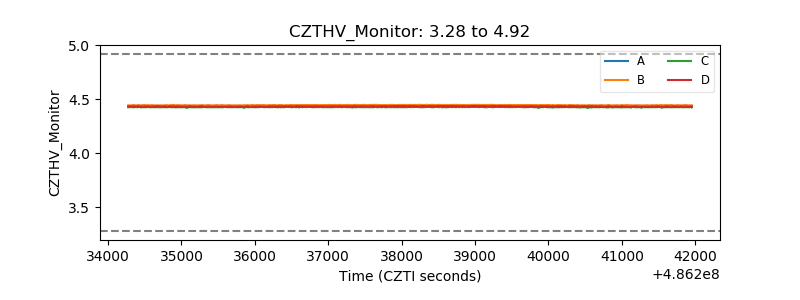 |
| D_VDD | 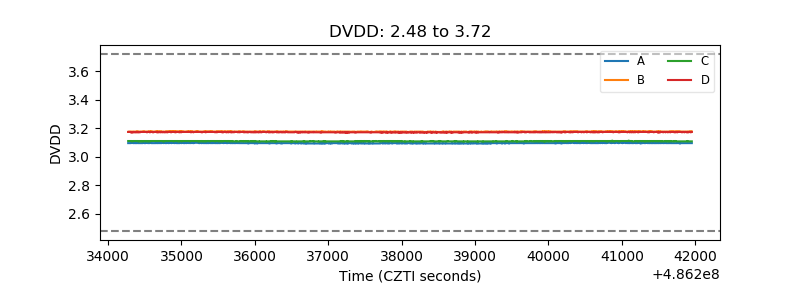 |
| Temperature 1 | 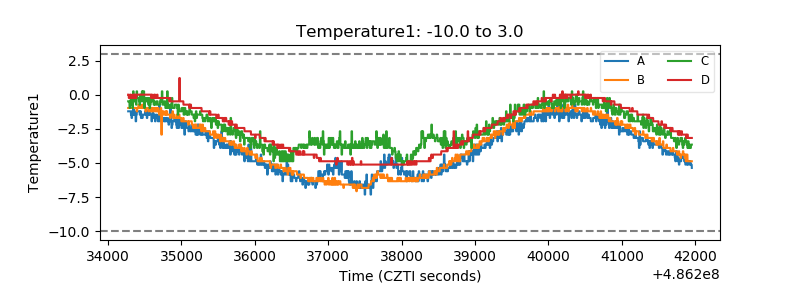 |
| Veto HV Monitor | 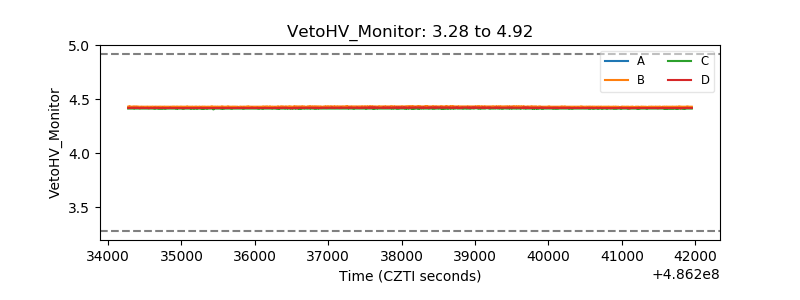 |
| Veto LLD | 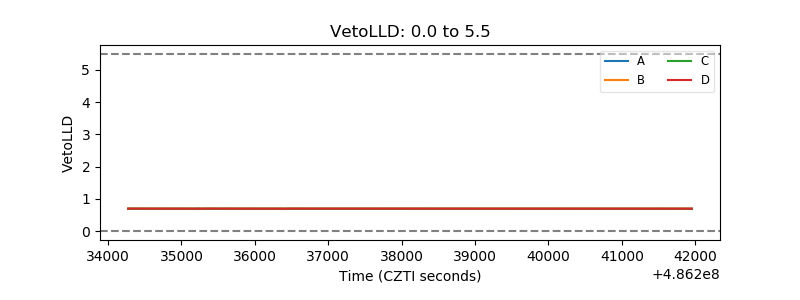 |
| Alpha Counter | 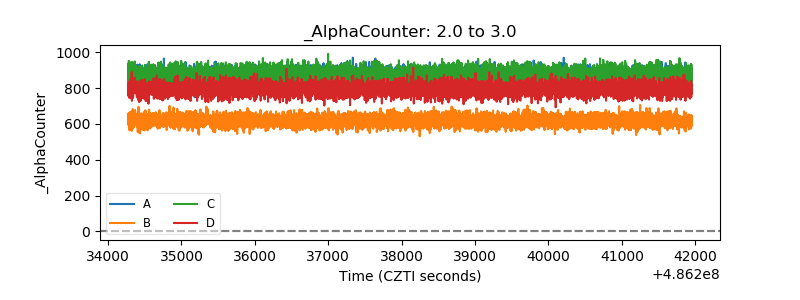 |
| _CPM_Rate | 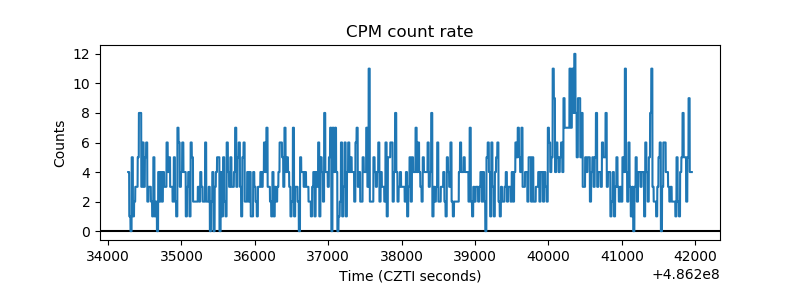 |
| CZT Counter | 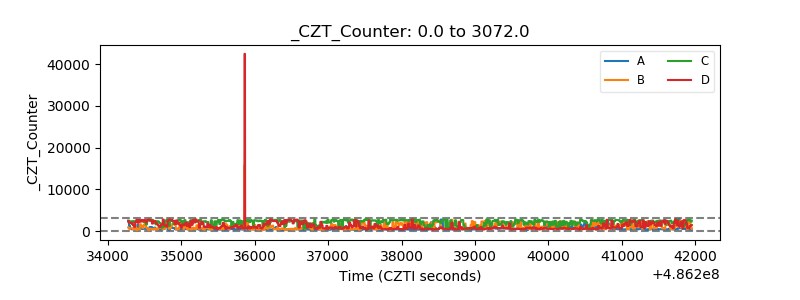 |
| +2.5 Volts monitor |  |
| +5 Volts monitor | 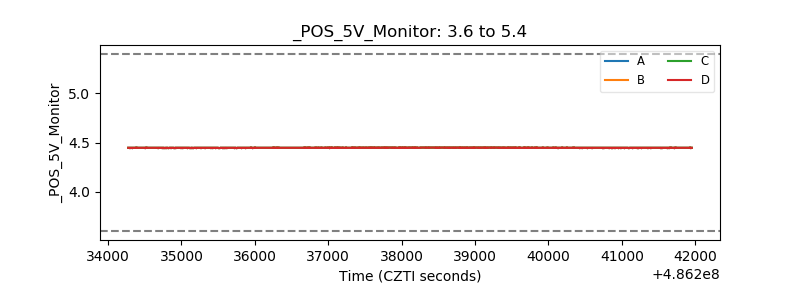 |
| _ROLL_ROT | 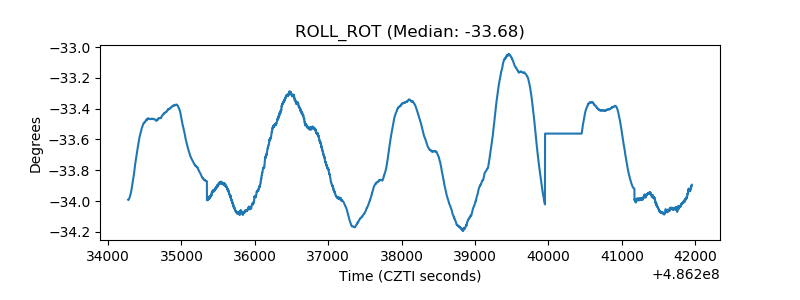 |
| _Roll_DEC | 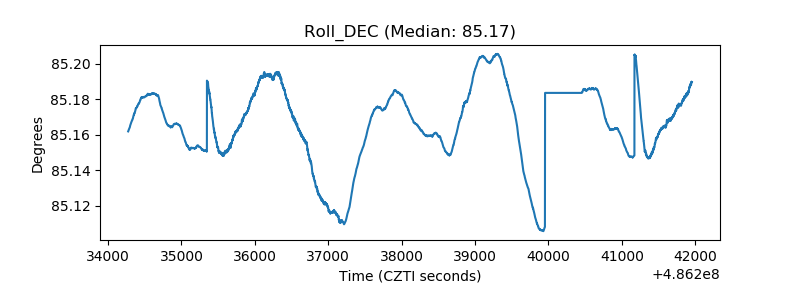 |
| _Roll_RA | 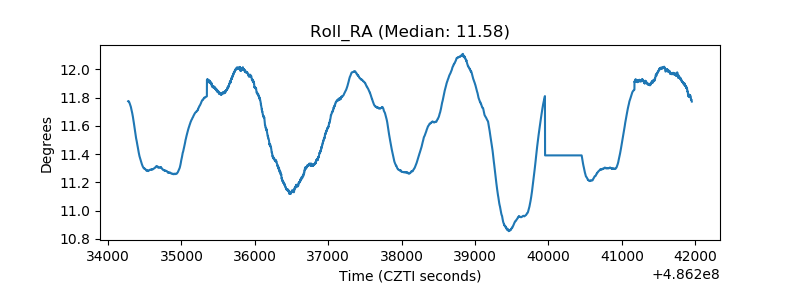 |
| Veto Counter | 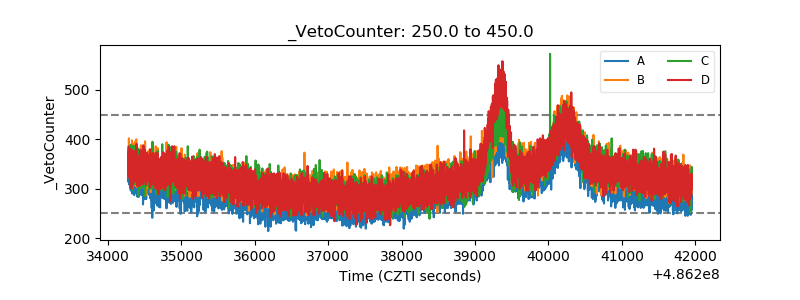 |