| Param | Original file | Final file |
|---|---|---|
| Filename | modeM0/AS1C09_011T05_9000006474_52302cztM0_level2.fits | modeM0/AS1C09_011T05_9000006474_52302cztM0_level2_quad_clean.evt |
| Size (bytes) | 1,320,171,840 | 107,242,560 |
| Size | 1.2 GB | 102.3 MB |
| Events in quadrant A | 5,679,738 | 875,829 |
| Events in quadrant B | 12,507,606 | 701,643 |
| Events in quadrant C | 18,874,250 | 284,937 |
| Events in quadrant D | 11,051,761 | 705,793 |
| Mode M0 | |||
|---|---|---|---|
| Quadrant | BADHDUFLAG | Total packets | Discarded packets |
| A | 0 | 24253 | 2 |
| B | 0 | 44073 | 2 |
| C | 0 | 62806 | 2 |
| D | 0 | 39683 | 2 |
| Mode SS | |||
|---|---|---|---|
| Quadrant | BADHDUFLAG | Total packets | Discarded packets |
| A | 0 | 198 | 0 |
| B | 0 | 198 | 0 |
| C | 0 | 198 | 0 |
| D | 0 | 198 | 0 |
| Mode M9 | |||
|---|---|---|---|
| Quadrant | BADHDUFLAG | Total packets | Discarded packets |
| A | 0 | 1 | 0 |
| B | 0 | 1 | 0 |
| C | 0 | 1 | 0 |
| D | 0 | 1 | 0 |
| Quadrant | Total seconds | Saturated seconds | Saturation percentage |
|---|---|---|---|
| A | 9778 | 392 | 4.009000% |
| B | 9778 | 3067 | 31.366333% |
| C | 9778 | 6747 | 69.001841% |
| D | 9778 | 1664 | 17.017795% |
Noise dominated data is calculated using 1-second bins in cleaned event files. If a bin has >2000 counts, and if more than 50% of those come from <1% of pixels, then it is considered to be noise-dominated and hence unusable.
| Quadrant | # 1 sec bins | Bins with >0 counts | Bins with >2000 counts | High rate bins dominated by noise | Noise dominated (total time) | Noise dominated (detector-on time) | Marked lightcurve |
|---|---|---|---|---|---|---|---|
| A | 9873 | 9780 | 248 | 248 | 2.51% | 2.54% | 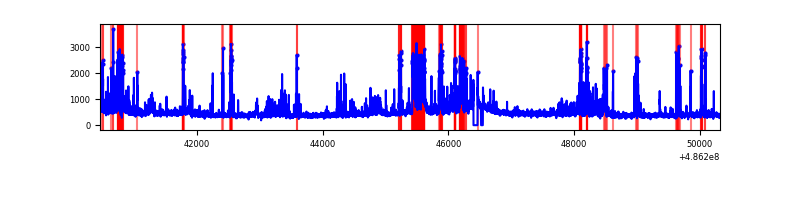 |
| B | 9873 | 9780 | 2208 | 2208 | 22.36% | 22.58% | 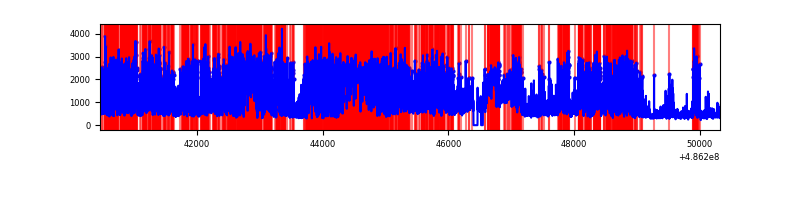 |
| C | 9872 | 9777 | 5572 | 5572 | 56.44% | 56.99% | 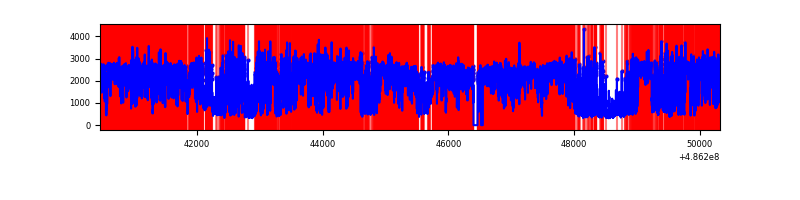 |
| D | 9872 | 9778 | 1480 | 1480 | 14.99% | 15.14% | 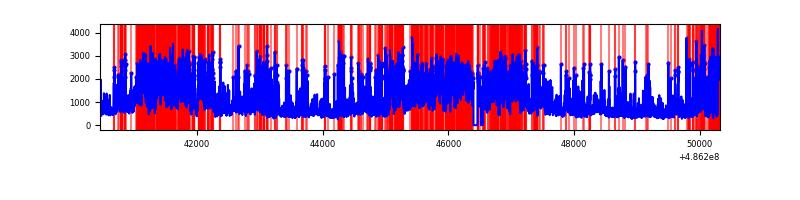 |
Top three noisy pixels from each quadrant. If the there are fewer than three noisy pixels in the level2.evt file, extra rows are filled as -1
| Pixel properties | Quadrant properties | ||||||
|---|---|---|---|---|---|---|---|
| Quadrant | DetID | PixID | Counts | Sigma | Mean | Median | Sigma |
| A | 12 | 3 | 441212 | 1768.16 | 983 | 959 | 249.0 |
| A | 4 | 249 | 413222 | 1655.75 | 983 | 959 | 249.0 |
| A | 5 | 240 | 144763 | 577.55 | 983 | 959 | 249.0 |
| B | 12 | 32 | 6442366 | 35059.83 | 867 | 839 | 183.7 |
| B | 4 | 171 | 1057685 | 5752.18 | 867 | 839 | 183.7 |
| B | 0 | 216 | 798952 | 4343.96 | 867 | 839 | 183.7 |
| C | 15 | 178 | 9450619 | 70493.14 | 478 | 473 | 134.1 |
| C | 0 | 161 | 5045551 | 37633.64 | 478 | 473 | 134.1 |
| C | 15 | 224 | 982325 | 7324.1 | 478 | 473 | 134.1 |
| D | 6 | 42 | 4192822 | 15982.29 | 915 | 876 | 262.3 |
| D | 8 | 176 | 542461 | 2064.86 | 915 | 876 | 262.3 |
| D | 7 | 60 | 395472 | 1504.44 | 915 | 876 | 262.3 |
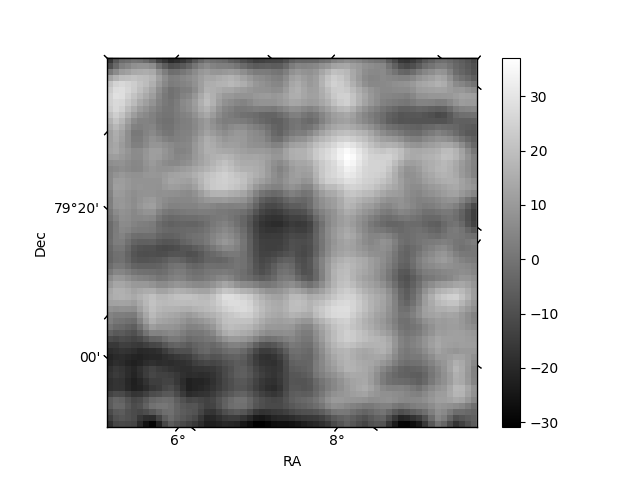
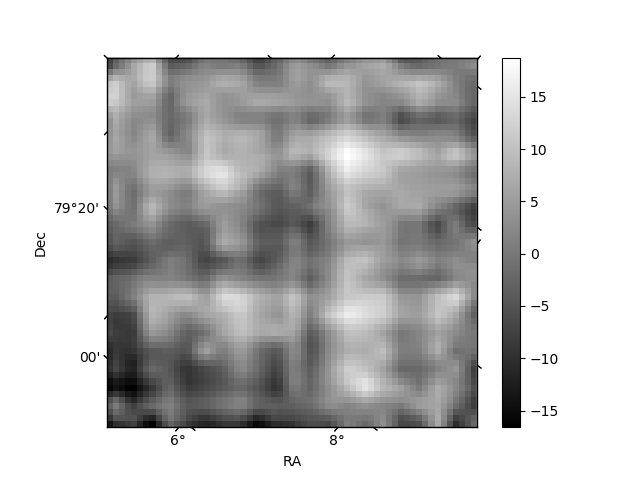
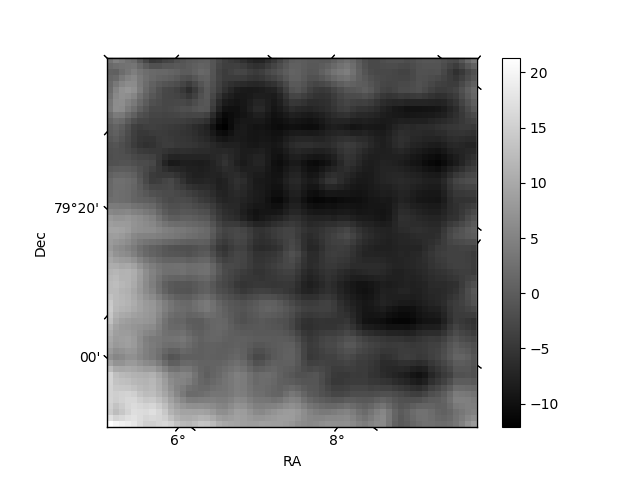
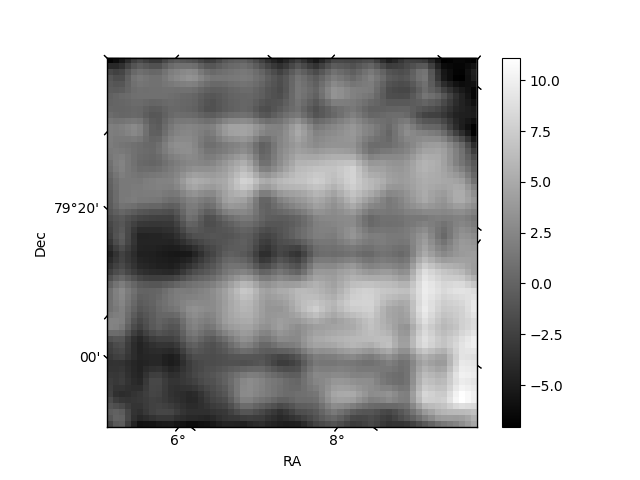
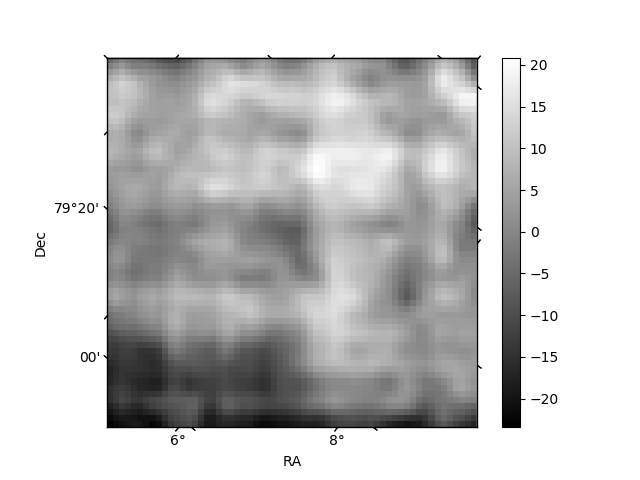
Histogram calculated using DETX and DETY for each event in the final _common_clean file
| Quadrant A | 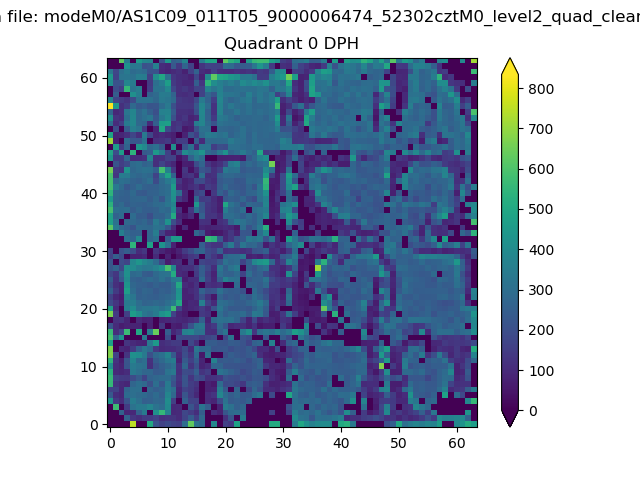 |
 |
Quadrant B |
|---|---|---|---|
| Quadrant D | 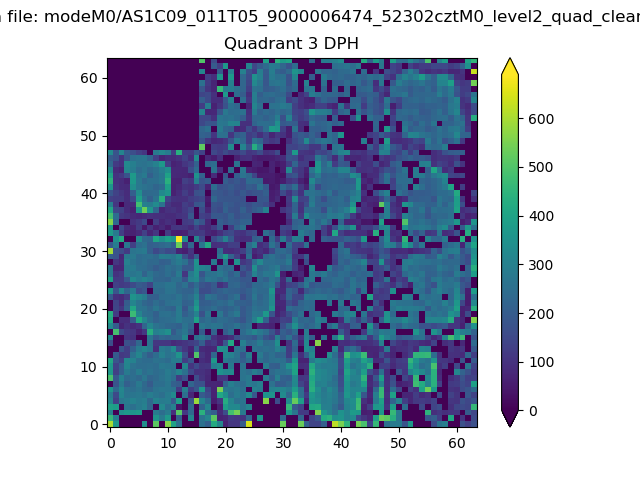 |
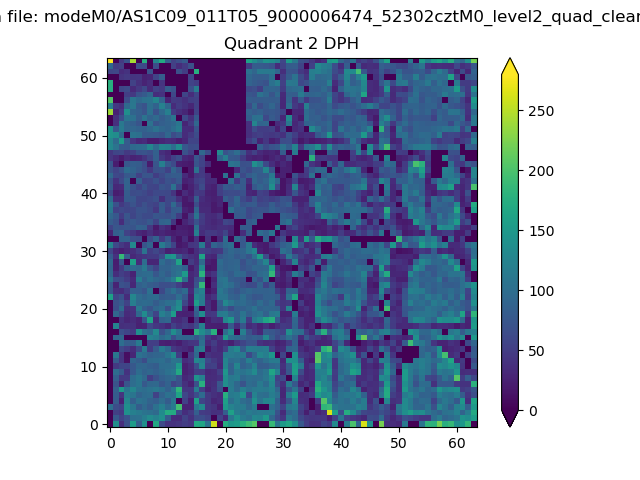 |
Quadrant C |
| Plot type | Count rate plots | Images |
|---|---|---|
| Comparison with Poisson distribution Blue bars denote a histogram of data divided into 1 sec bins. Red curve is a Poisson curve with rate = median count rate of data. |
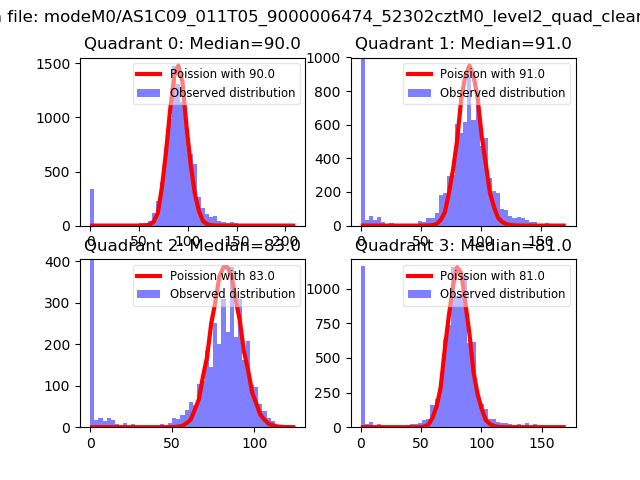 |
 |
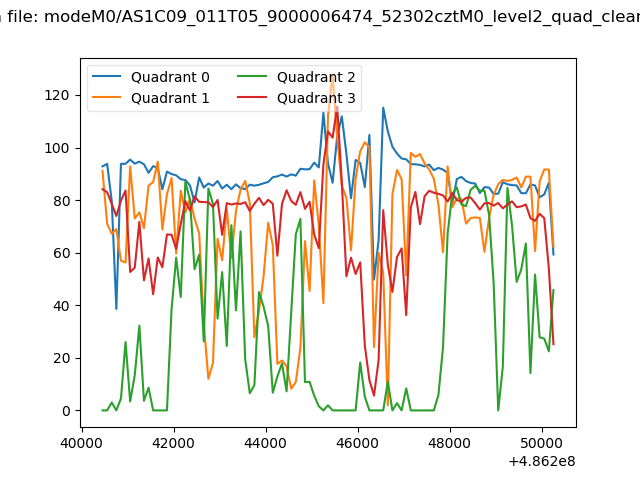
| Quadrant-wise count rates Data is divided into 100 sec bins |
 |
|
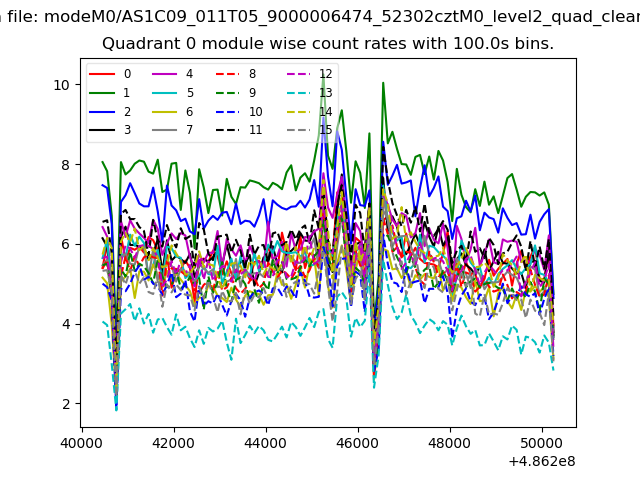
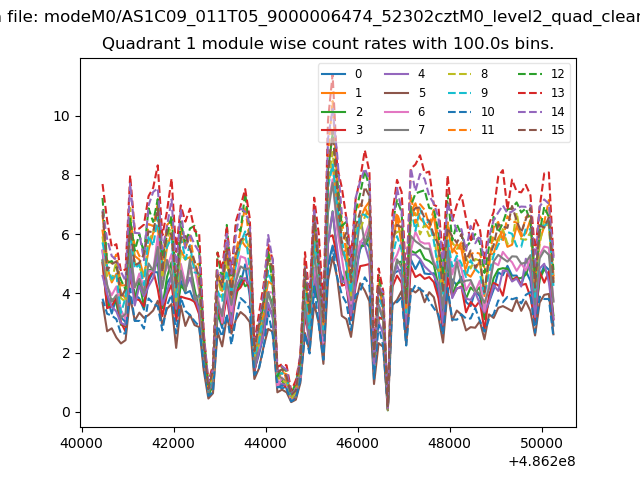
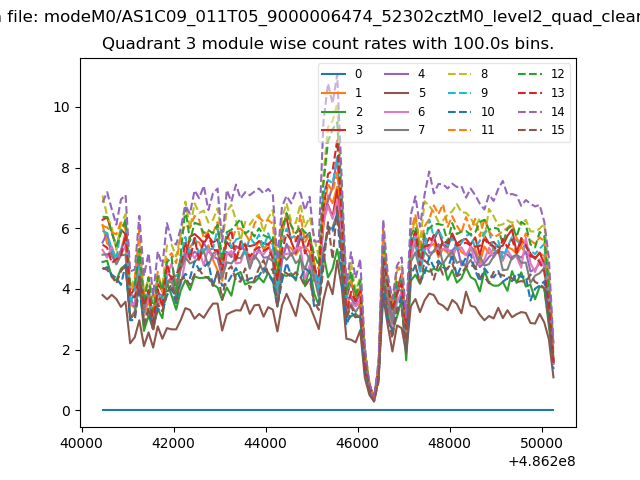
| Module-wise count rates for Quadrant A Data is divided into 100 sec bins |
 |
 |
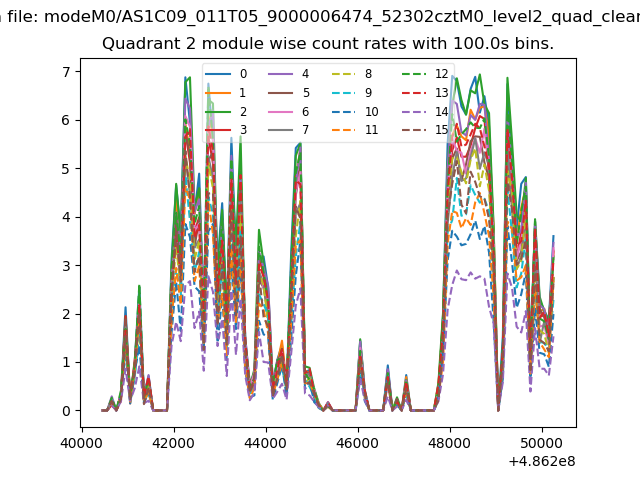
| Module-wise count rates for Quadrant B Data is divided into 100 sec bins |
 |
 |
| Module-wise count rates for Quadrant C Data is divided into 100 sec bins |
 |
 |
| Module-wise count rates for Quadrant D Data is divided into 100 sec bins |
 |
 |
| Parameter | Plot |
|---|---|
| CZT HV Monitor | 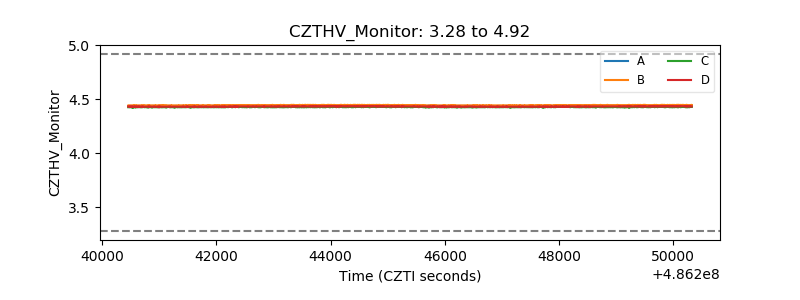 |
| D_VDD | 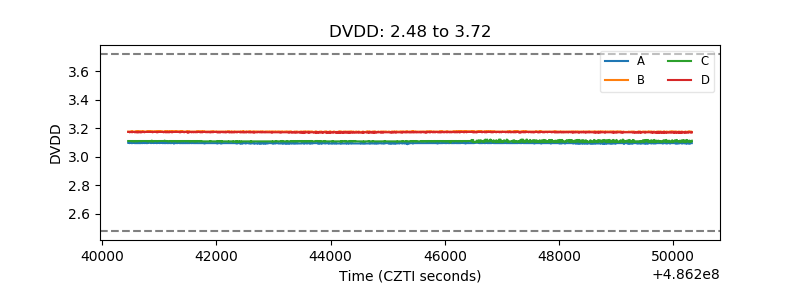 |
| Temperature 1 | 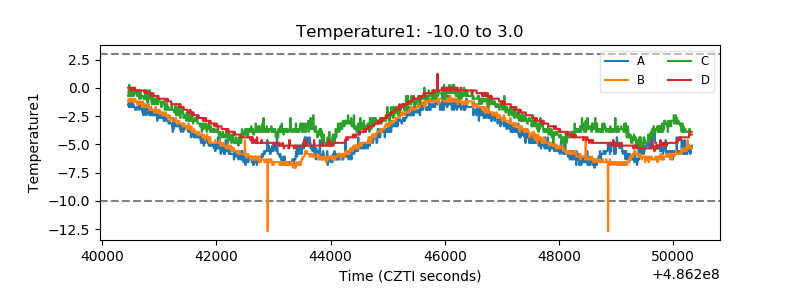 |
| Veto HV Monitor | 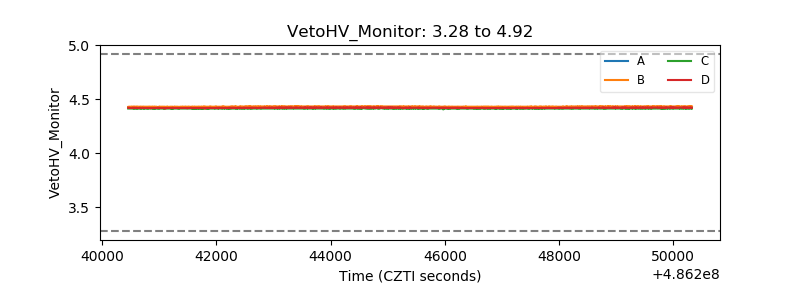 |
| Veto LLD | 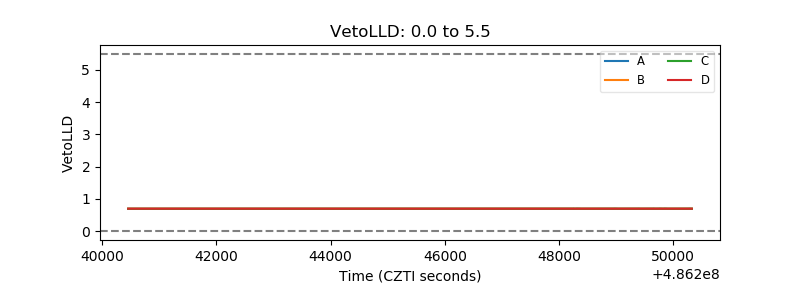 |
| Alpha Counter |  |
| _CPM_Rate | 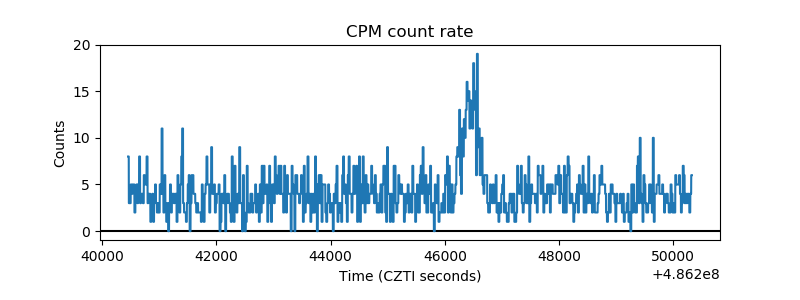 |
| CZT Counter | 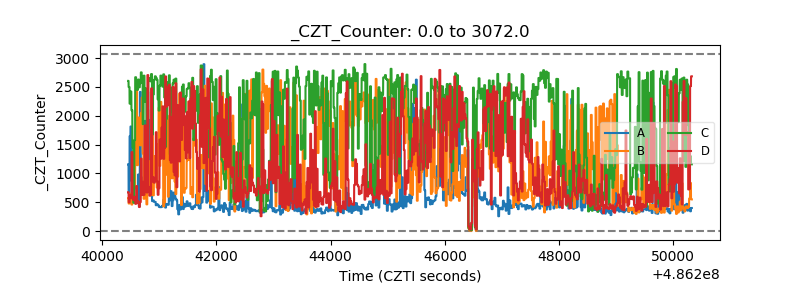 |
| +2.5 Volts monitor |  |
| +5 Volts monitor |  |
| _ROLL_ROT | 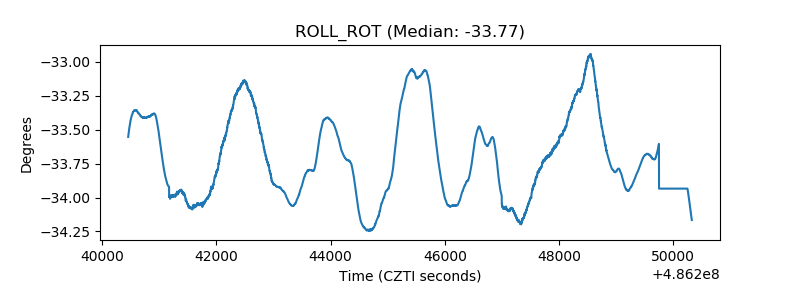 |
| _Roll_DEC | 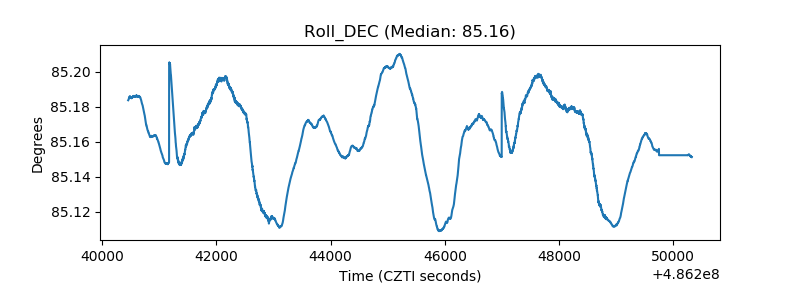 |
| _Roll_RA | 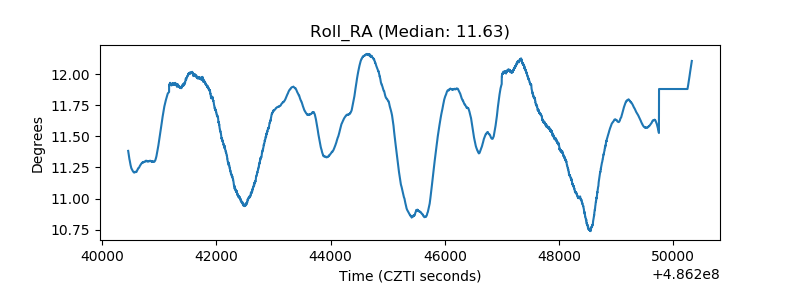 |
| Veto Counter | 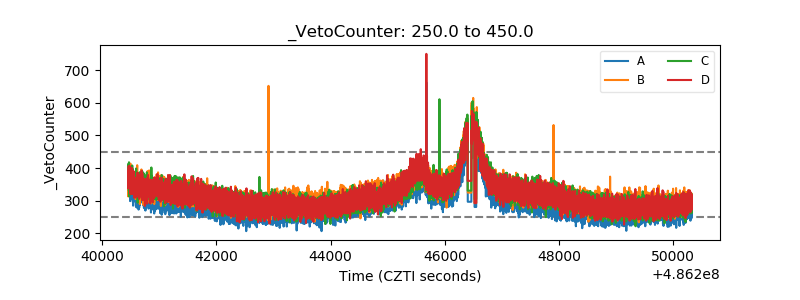 |