| Param | Original file | Final file |
|---|---|---|
| Filename | modeM0/AS1C09_011T05_9000006474_52303cztM0_level2.fits | modeM0/AS1C09_011T05_9000006474_52303cztM0_level2_quad_clean.evt |
| Size (bytes) | 2,037,067,200 | 172,598,400 |
| Size | 1.9 GB | 164.6 MB |
| Events in quadrant A | 12,087,459 | 1,270,377 |
| Events in quadrant B | 14,085,421 | 1,336,109 |
| Events in quadrant C | 27,237,011 | 621,311 |
| Events in quadrant D | 20,833,838 | 955,276 |
| Mode M0 | |||
|---|---|---|---|
| Quadrant | BADHDUFLAG | Total packets | Discarded packets |
| A | 0 | 46605 | 3 |
| B | 0 | 52405 | 3 |
| C | 0 | 91313 | 3 |
| D | 0 | 72467 | 3 |
| Mode SS | |||
|---|---|---|---|
| Quadrant | BADHDUFLAG | Total packets | Discarded packets |
| A | 0 | 306 | 0 |
| B | 0 | 306 | 0 |
| C | 0 | 306 | 0 |
| D | 0 | 306 | 0 |
| Mode M9 | |||
|---|---|---|---|
| Quadrant | BADHDUFLAG | Total packets | Discarded packets |
| A | 0 | 18 | 0 |
| B | 0 | 18 | 0 |
| C | 0 | 18 | 0 |
| D | 0 | 18 | 0 |
| Quadrant | Total seconds | Saturated seconds | Saturation percentage |
|---|---|---|---|
| A | 15094 | 1618 | 10.719491% |
| B | 15093 | 2031 | 13.456569% |
| C | 15094 | 8564 | 56.737777% |
| D | 15094 | 4149 | 27.487743% |
Noise dominated data is calculated using 1-second bins in cleaned event files. If a bin has >2000 counts, and if more than 50% of those come from <1% of pixels, then it is considered to be noise-dominated and hence unusable.
| Quadrant | # 1 sec bins | Bins with >0 counts | Bins with >2000 counts | High rate bins dominated by noise | Noise dominated (total time) | Noise dominated (detector-on time) | Marked lightcurve |
|---|---|---|---|---|---|---|---|
| A | 16859 | 15096 | 1411 | 1411 | 8.37% | 9.35% | 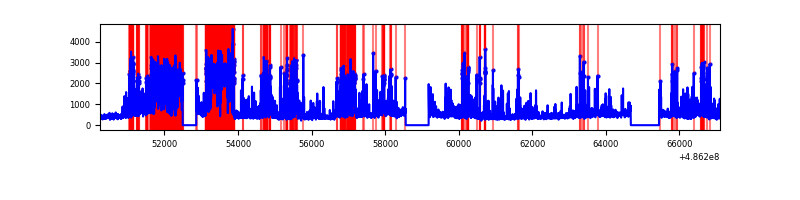 |
| B | 16858 | 15095 | 1344 | 1344 | 7.97% | 8.90% | 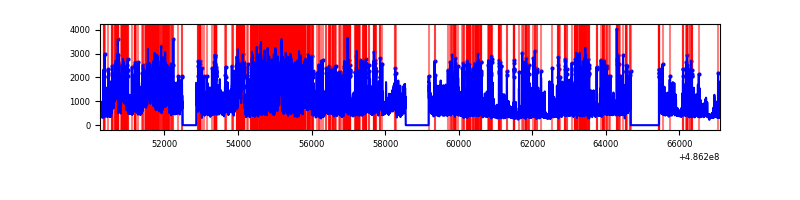 |
| C | 16858 | 15093 | 7614 | 7614 | 45.17% | 50.45% | 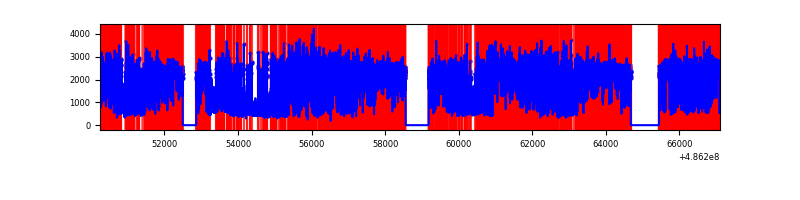 |
| D | 16859 | 15097 | 4034 | 4034 | 23.93% | 26.72% | 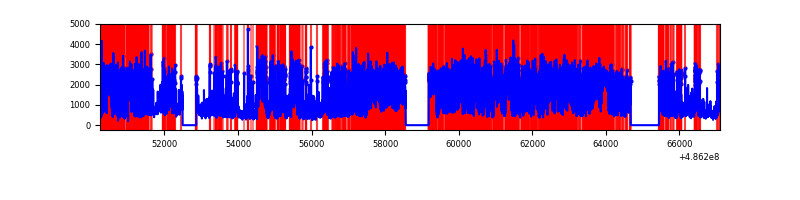 |
Top three noisy pixels from each quadrant. If the there are fewer than three noisy pixels in the level2.evt file, extra rows are filled as -1
| Pixel properties | Quadrant properties | ||||||
|---|---|---|---|---|---|---|---|
| Quadrant | DetID | PixID | Counts | Sigma | Mean | Median | Sigma |
| A | 4 | 249 | 3233945 | 8657.17 | 1497 | 1460 | 373.4 |
| A | 12 | 3 | 970000 | 2593.92 | 1497 | 1460 | 373.4 |
| A | 15 | 174 | 568068 | 1517.48 | 1497 | 1460 | 373.4 |
| B | 12 | 32 | 2919622 | 9154.5 | 1504 | 1451 | 318.8 |
| B | 10 | 254 | 1671228 | 5238.2 | 1504 | 1451 | 318.8 |
| B | 4 | 171 | 1194556 | 3742.85 | 1504 | 1451 | 318.8 |
| C | 15 | 224 | 7635037 | 27857.82 | 991 | 981 | 274.0 |
| C | 0 | 161 | 5578714 | 20353.99 | 991 | 981 | 274.0 |
| C | 15 | 178 | 4528935 | 16523.18 | 991 | 981 | 274.0 |
| D | 6 | 42 | 6138483 | 15596.28 | 1363 | 1298 | 393.5 |
| D | 15 | 78 | 3268139 | 8301.94 | 1363 | 1298 | 393.5 |
| D | 8 | 176 | 2526493 | 6417.22 | 1363 | 1298 | 393.5 |
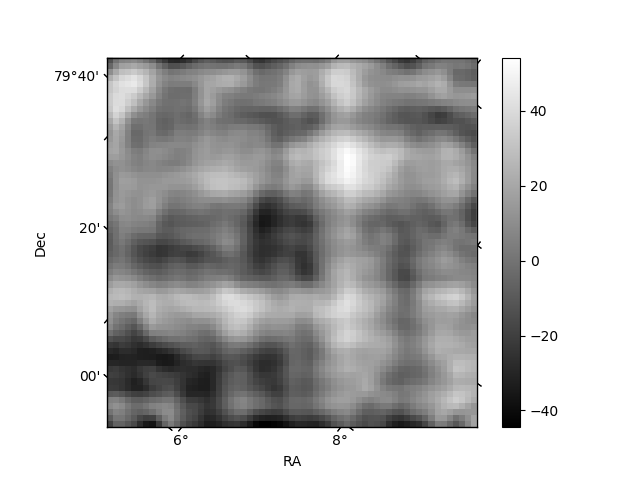
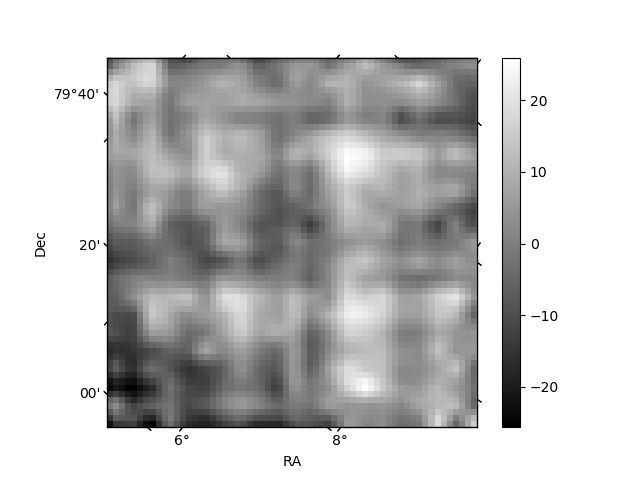
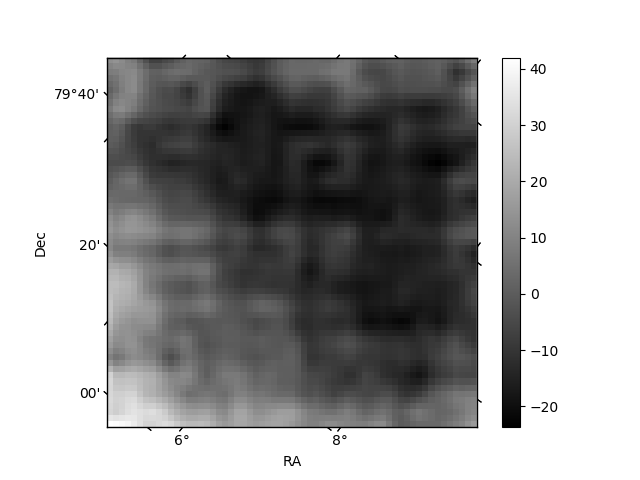
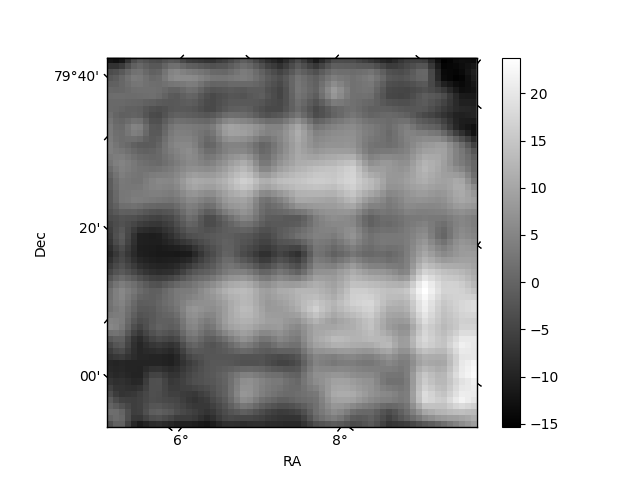
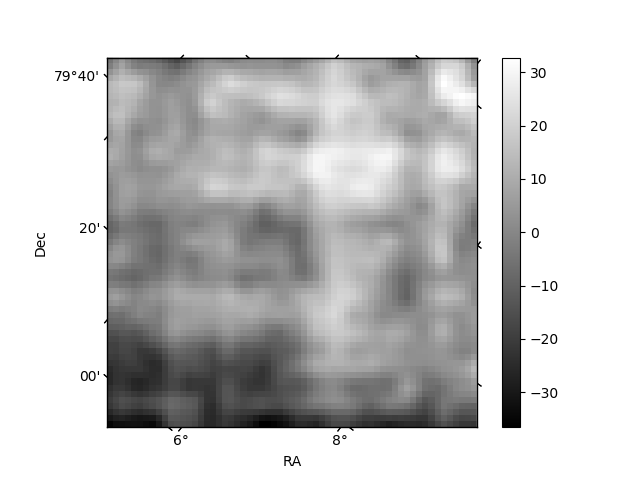
Histogram calculated using DETX and DETY for each event in the final _common_clean file
| Quadrant A | 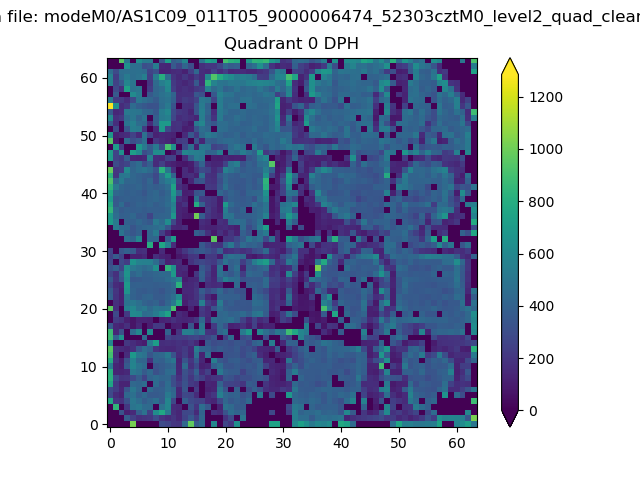 |
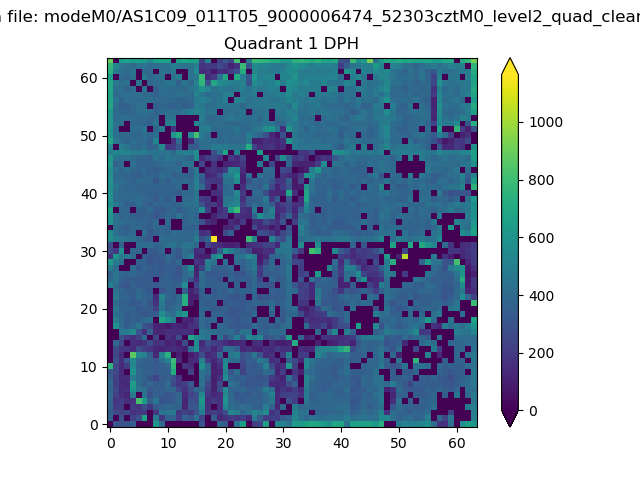 |
Quadrant B |
|---|---|---|---|
| Quadrant D | 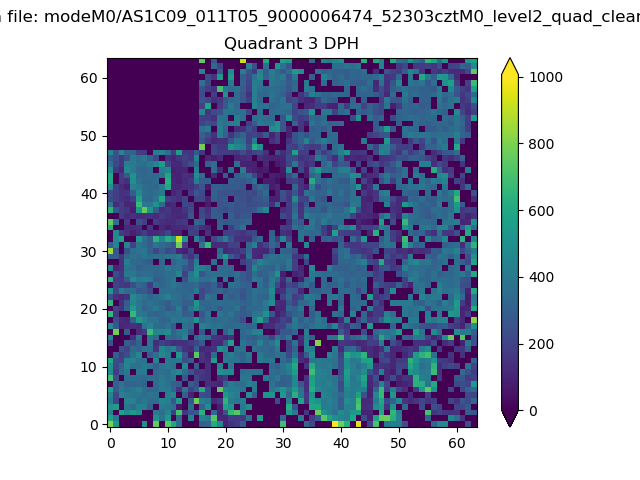 |
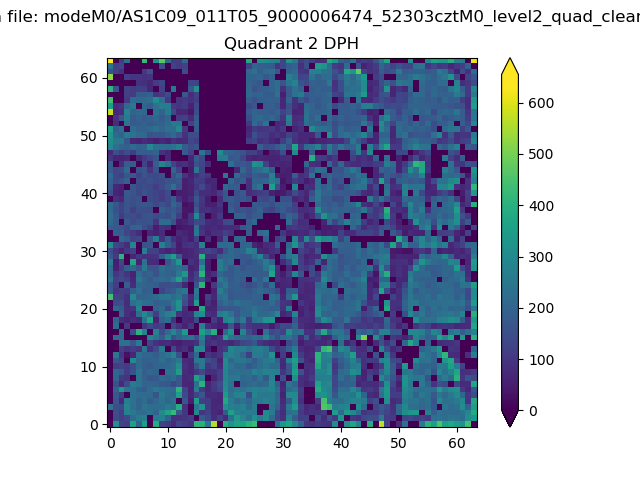 |
Quadrant C |
| Plot type | Count rate plots | Images |
|---|---|---|
| Comparison with Poisson distribution Blue bars denote a histogram of data divided into 1 sec bins. Red curve is a Poisson curve with rate = median count rate of data. |
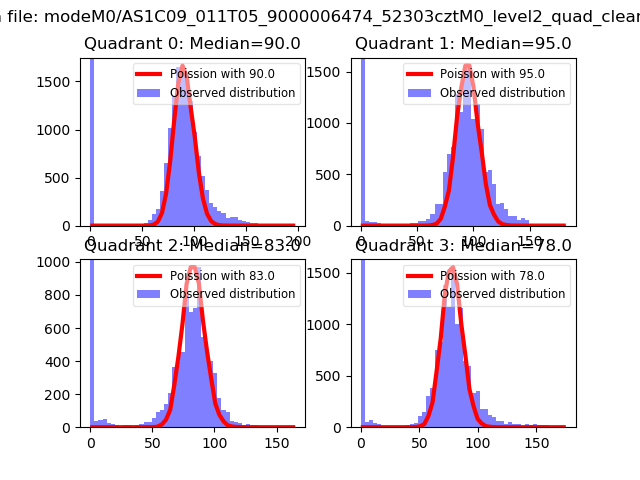 |
 |
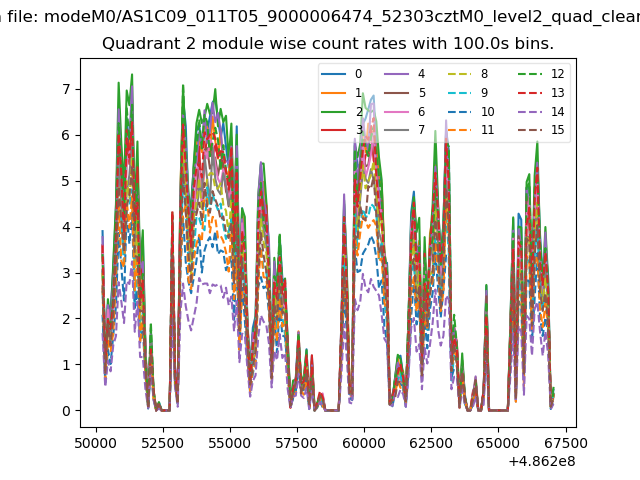
| Quadrant-wise count rates Data is divided into 100 sec bins |
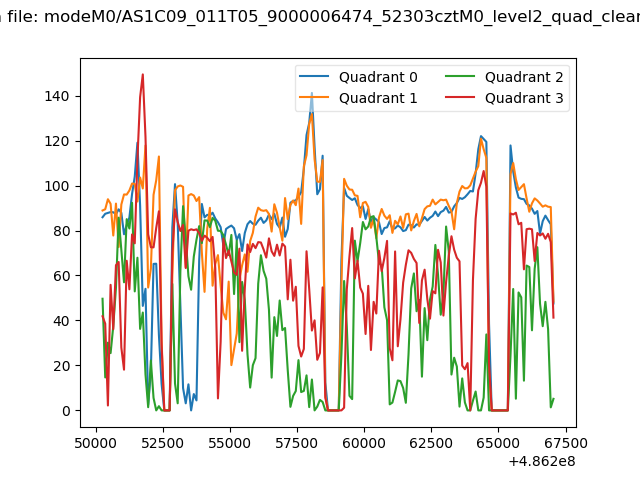 |
|
| Module-wise count rates for Quadrant A Data is divided into 100 sec bins |
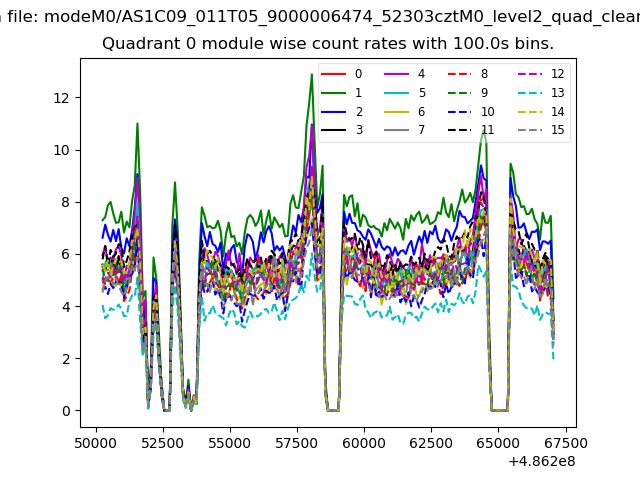 |
 |
| Module-wise count rates for Quadrant B Data is divided into 100 sec bins |
 |
 |
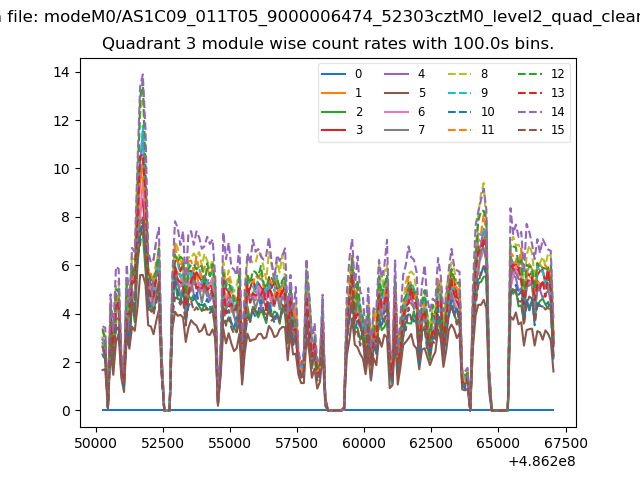
| Module-wise count rates for Quadrant C Data is divided into 100 sec bins |
 |
 |
| Module-wise count rates for Quadrant D Data is divided into 100 sec bins |
 |
 |
| Parameter | Plot |
|---|---|
| CZT HV Monitor | 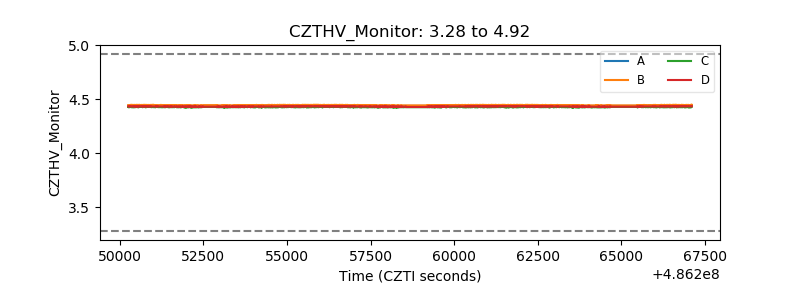 |
| D_VDD | 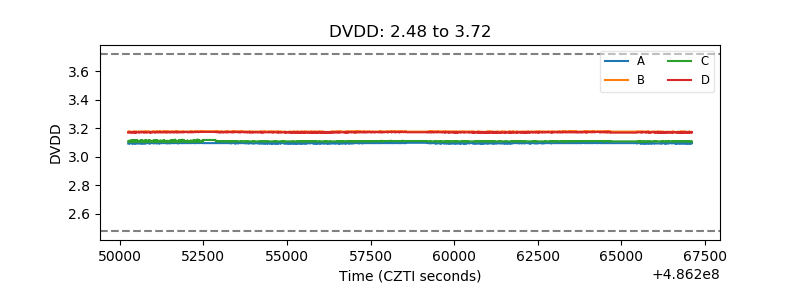 |
| Temperature 1 | 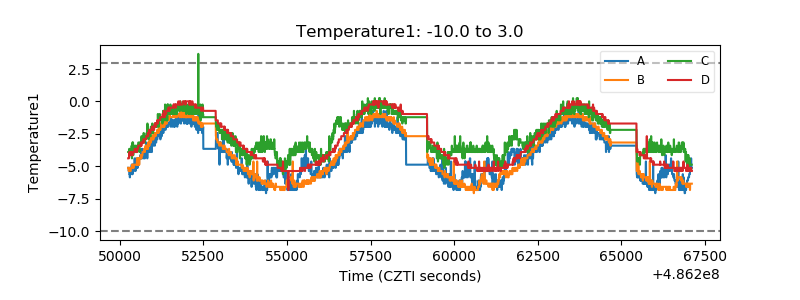 |
| Veto HV Monitor |  |
| Veto LLD | 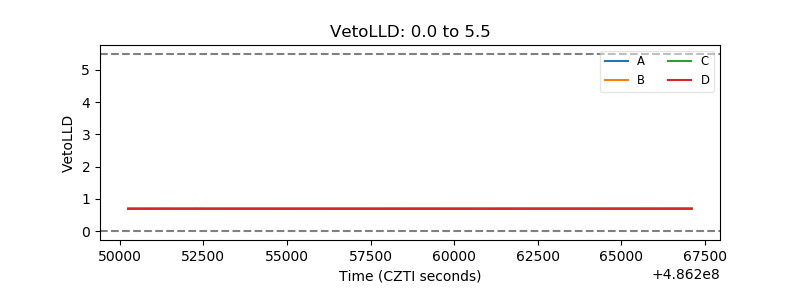 |
| Alpha Counter | 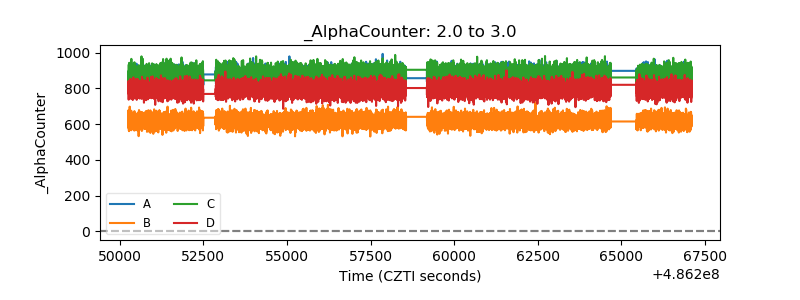 |
| _CPM_Rate | 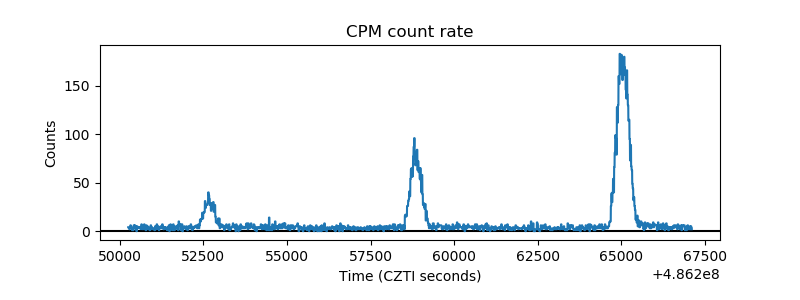 |
| CZT Counter | 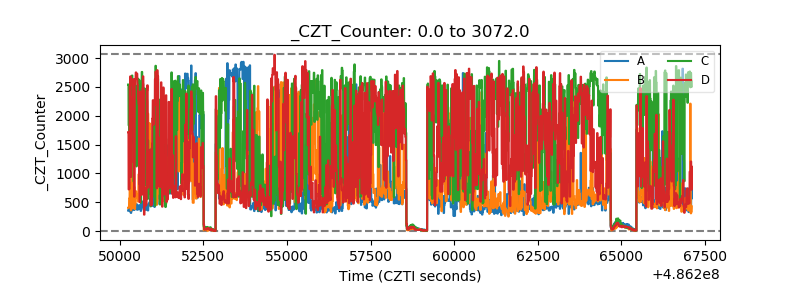 |
| +2.5 Volts monitor |  |
| +5 Volts monitor | 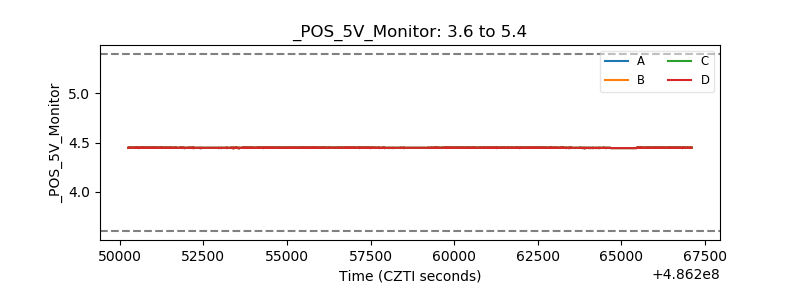 |
| _ROLL_ROT | 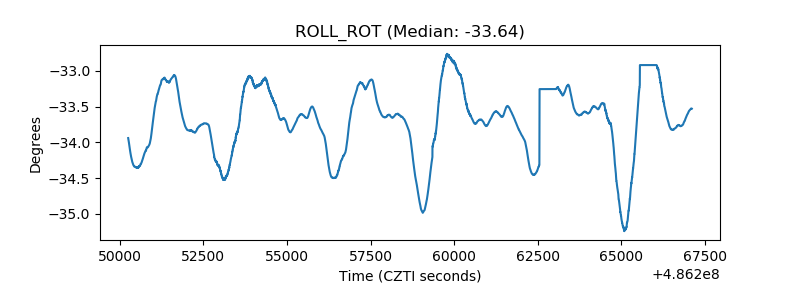 |
| _Roll_DEC | 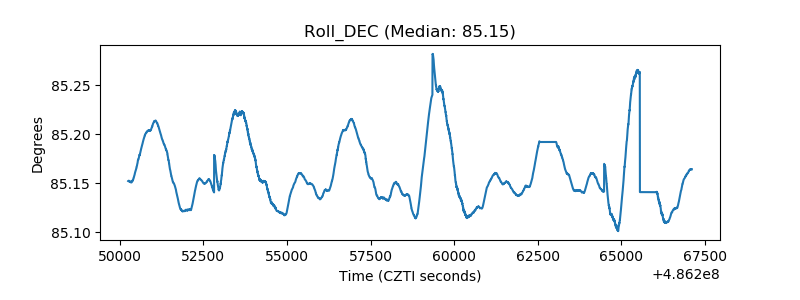 |
| _Roll_RA | 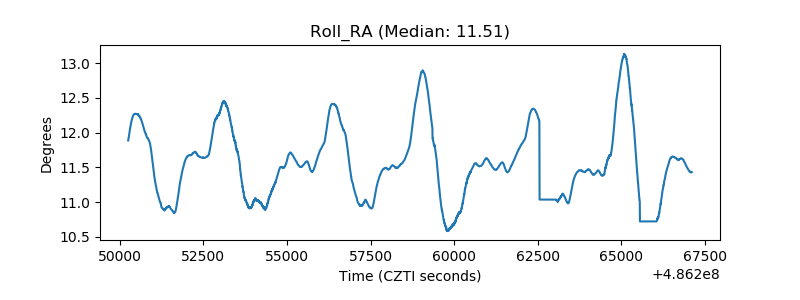 |
| Veto Counter | 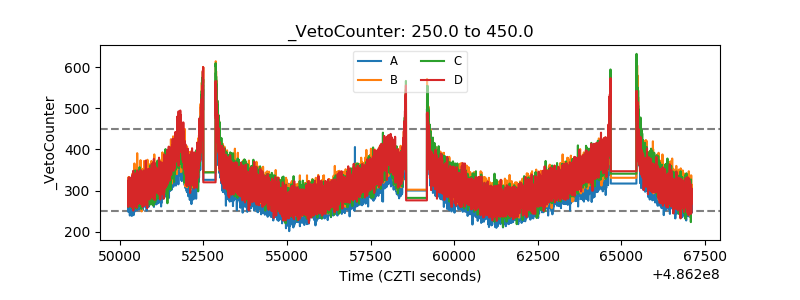 |