| Param | Original file | Final file |
|---|---|---|
| Filename | modeM0/AS1C09_011T05_9000006474_52304cztM0_level2.fits | modeM0/AS1C09_011T05_9000006474_52304cztM0_level2_quad_clean.evt |
| Size (bytes) | 738,388,800 | 76,766,400 |
| Size | 704.2 MB | 73.2 MB |
| Events in quadrant A | 3,247,488 | 592,772 |
| Events in quadrant B | 4,585,338 | 594,659 |
| Events in quadrant C | 11,717,538 | 258,823 |
| Events in quadrant D | 7,300,970 | 444,612 |
| Mode M0 | |||
|---|---|---|---|
| Quadrant | BADHDUFLAG | Total packets | Discarded packets |
| A | 0 | 14178 | 1 |
| B | 0 | 18099 | 1 |
| C | 0 | 39094 | 1 |
| D | 0 | 26050 | 1 |
| Mode SS | |||
|---|---|---|---|
| Quadrant | BADHDUFLAG | Total packets | Discarded packets |
| A | 0 | 124 | 0 |
| B | 0 | 124 | 0 |
| C | 0 | 124 | 0 |
| D | 0 | 124 | 0 |
| Mode M9 | |||
|---|---|---|---|
| Quadrant | BADHDUFLAG | Total packets | Discarded packets |
| A | 0 | 10 | 0 |
| B | 0 | 10 | 0 |
| C | 0 | 10 | 0 |
| D | 0 | 10 | 0 |
| Quadrant | Total seconds | Saturated seconds | Saturation percentage |
|---|---|---|---|
| A | 6214 | 81 | 1.303508% |
| B | 6214 | 426 | 6.855488% |
| C | 6214 | 3562 | 57.322176% |
| D | 6214 | 1264 | 20.341165% |
Noise dominated data is calculated using 1-second bins in cleaned event files. If a bin has >2000 counts, and if more than 50% of those come from <1% of pixels, then it is considered to be noise-dominated and hence unusable.
| Quadrant | # 1 sec bins | Bins with >0 counts | Bins with >2000 counts | High rate bins dominated by noise | Noise dominated (total time) | Noise dominated (detector-on time) | Marked lightcurve |
|---|---|---|---|---|---|---|---|
| A | 7164 | 6215 | 59 | 59 | 0.82% | 0.95% | 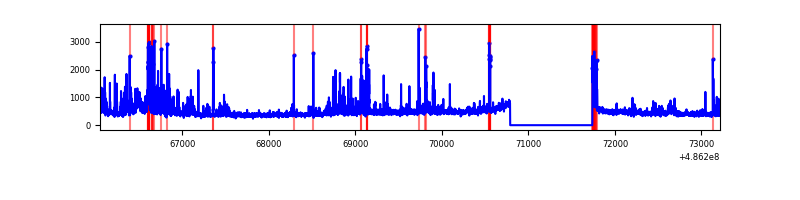 |
| B | 7164 | 6214 | 288 | 288 | 4.02% | 4.63% | 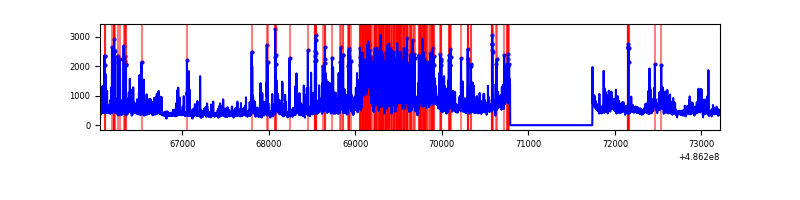 |
| C | 7163 | 6213 | 3282 | 3282 | 45.82% | 52.82% | 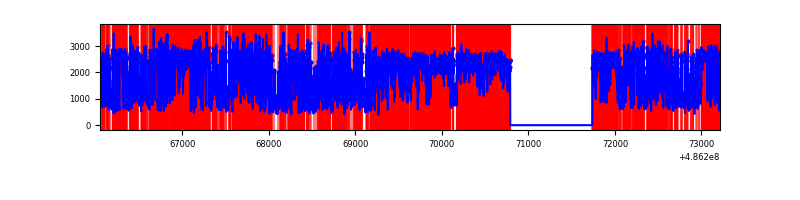 |
| D | 7164 | 6215 | 1294 | 1294 | 18.06% | 20.82% | 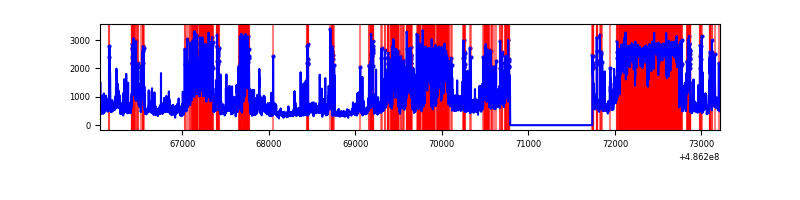 |
Top three noisy pixels from each quadrant. If the there are fewer than three noisy pixels in the level2.evt file, extra rows are filled as -1
| Pixel properties | Quadrant properties | ||||||
|---|---|---|---|---|---|---|---|
| Quadrant | DetID | PixID | Counts | Sigma | Mean | Median | Sigma |
| A | 4 | 249 | 271396 | 1666.43 | 637 | 620 | 162.5 |
| A | 5 | 240 | 139537 | 854.93 | 637 | 620 | 162.5 |
| A | 11 | 3 | 68185 | 415.81 | 637 | 620 | 162.5 |
| B | 4 | 171 | 963951 | 7344.47 | 616 | 595 | 131.2 |
| B | 0 | 216 | 502107 | 3823.45 | 616 | 595 | 131.2 |
| B | 12 | 32 | 190543 | 1448.13 | 616 | 595 | 131.2 |
| C | 15 | 224 | 3566856 | 32033.08 | 398 | 394 | 111.3 |
| C | 15 | 178 | 2353664 | 21136.49 | 398 | 394 | 111.3 |
| C | 0 | 161 | 1735220 | 15581.78 | 398 | 394 | 111.3 |
| D | 6 | 42 | 3673916 | 22794.13 | 555 | 530 | 161.2 |
| D | 7 | 96 | 385278 | 2387.44 | 555 | 530 | 161.2 |
| D | 8 | 176 | 303441 | 1879.63 | 555 | 530 | 161.2 |
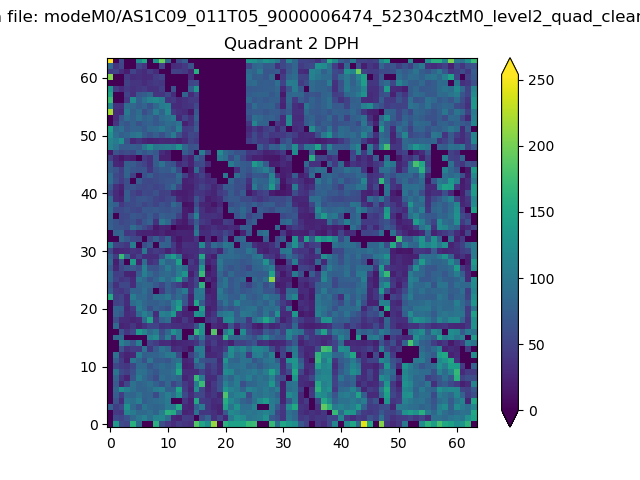
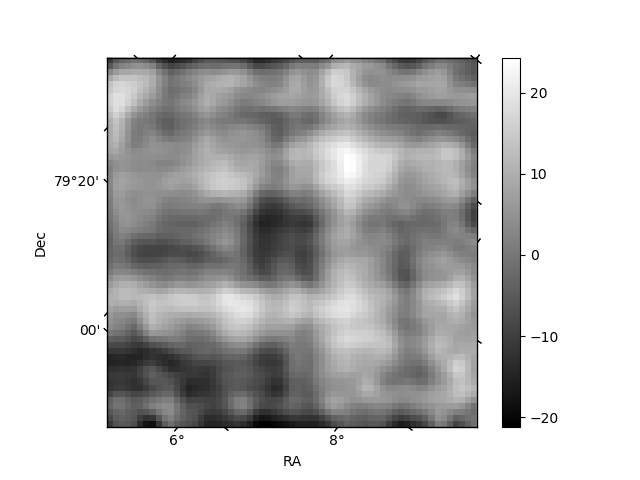
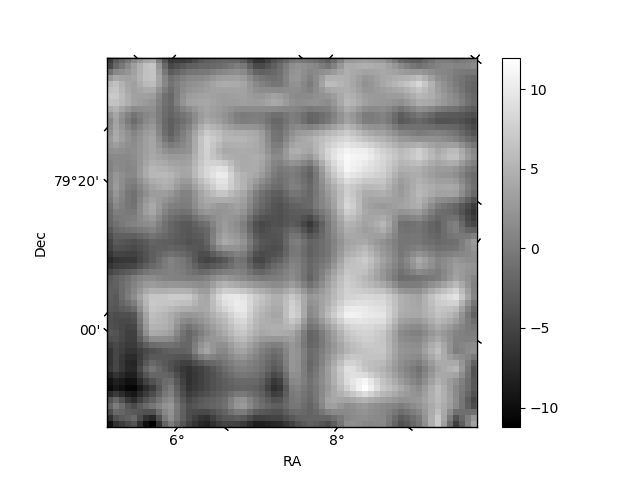
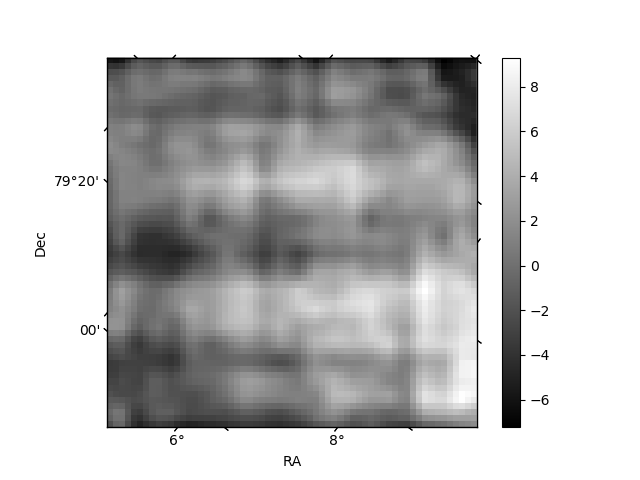
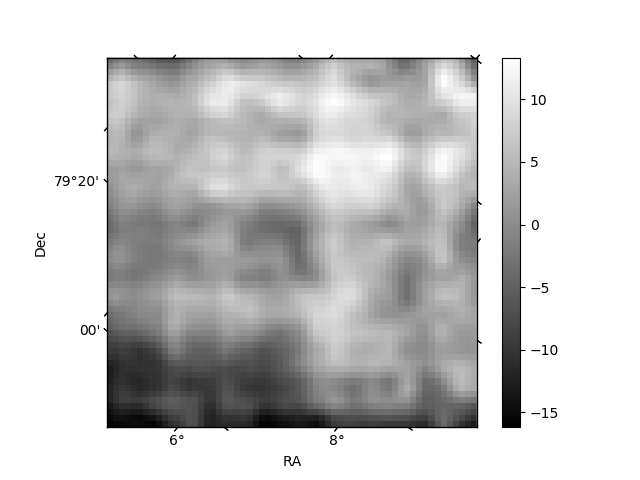
Histogram calculated using DETX and DETY for each event in the final _common_clean file
| Quadrant A | 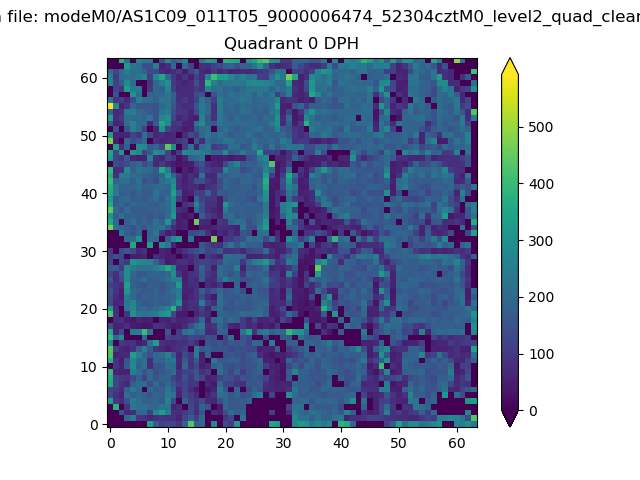 |
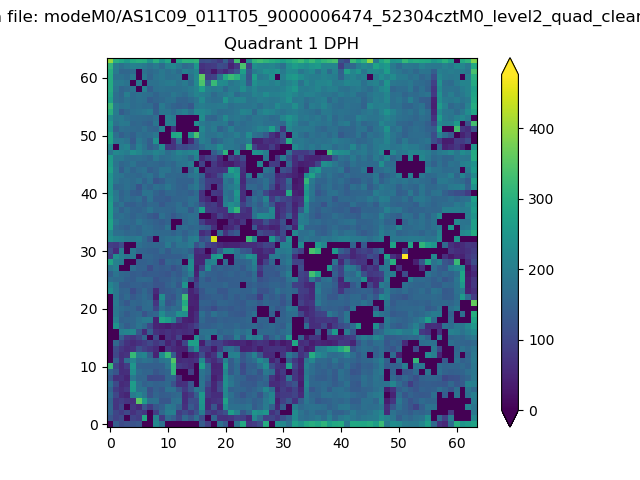 |
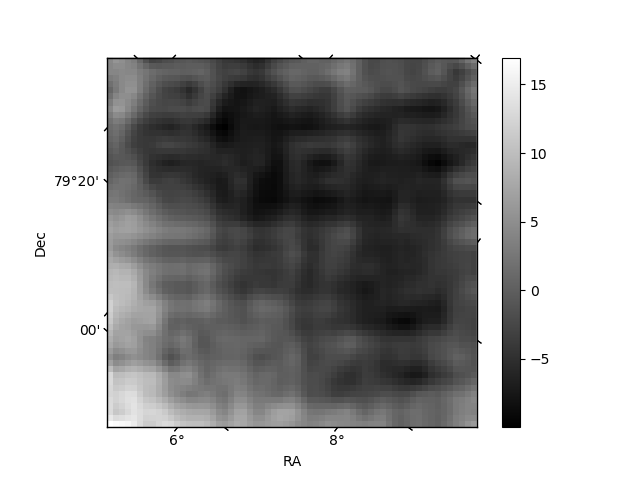
Quadrant B |
|---|---|---|---|
| Quadrant D | 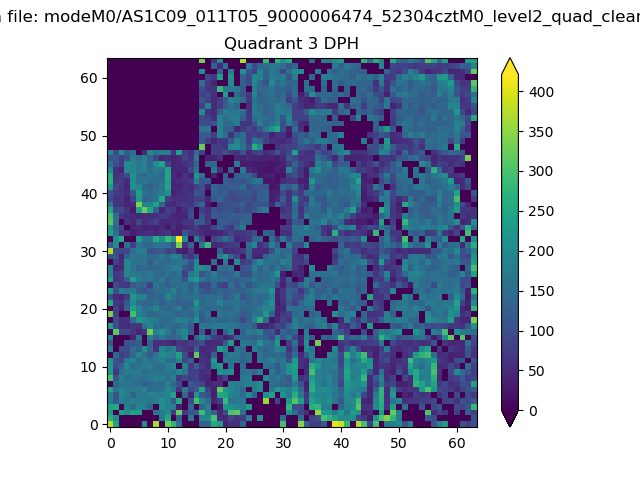 |
 |
Quadrant C |
| Plot type | Count rate plots | Images |
|---|---|---|
| Comparison with Poisson distribution Blue bars denote a histogram of data divided into 1 sec bins. Red curve is a Poisson curve with rate = median count rate of data. |
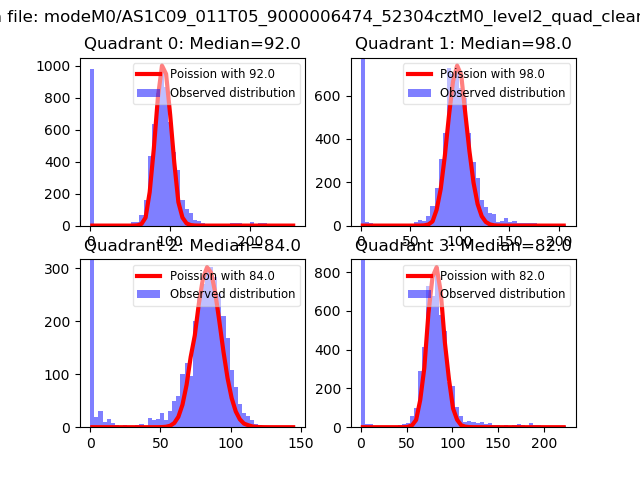 |
 |
| Quadrant-wise count rates Data is divided into 100 sec bins |
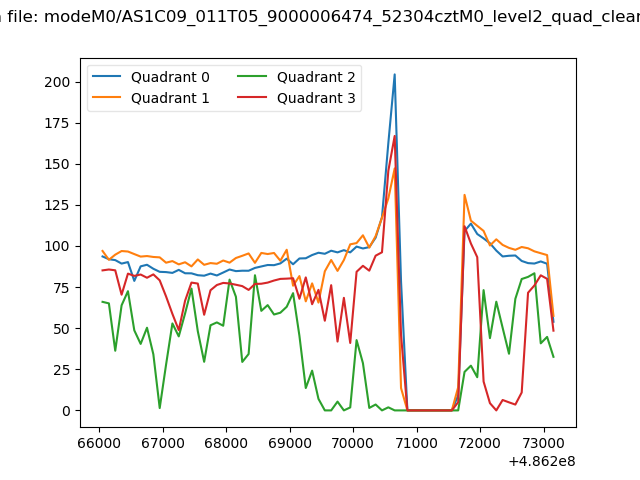 |
|
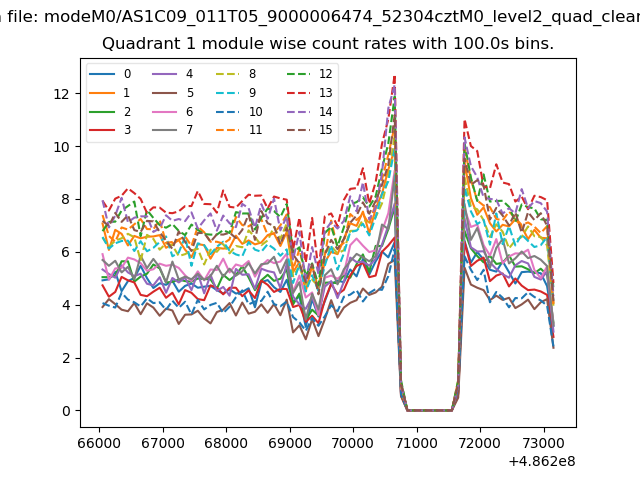
| Module-wise count rates for Quadrant A Data is divided into 100 sec bins |
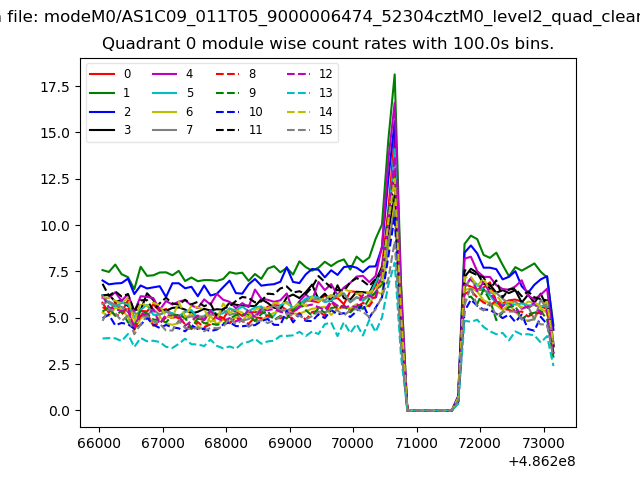 |
 |
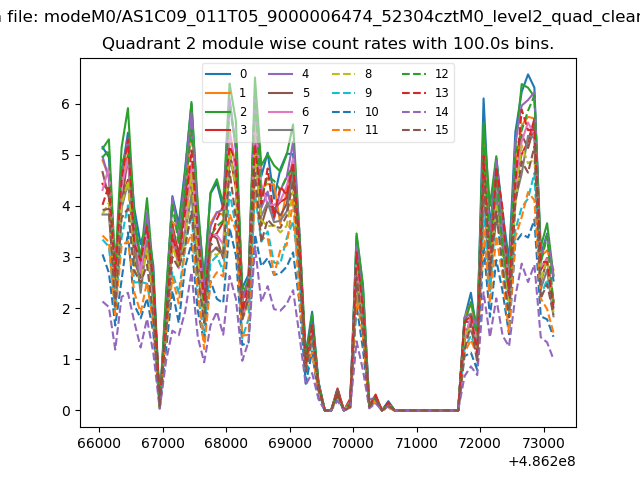
| Module-wise count rates for Quadrant B Data is divided into 100 sec bins |
 |
 |
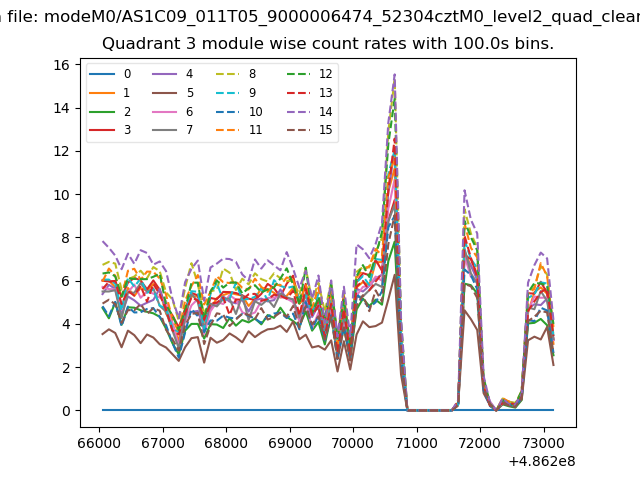
| Module-wise count rates for Quadrant C Data is divided into 100 sec bins |
 |
 |
| Module-wise count rates for Quadrant D Data is divided into 100 sec bins |
 |
 |
| Parameter | Plot |
|---|---|
| CZT HV Monitor | 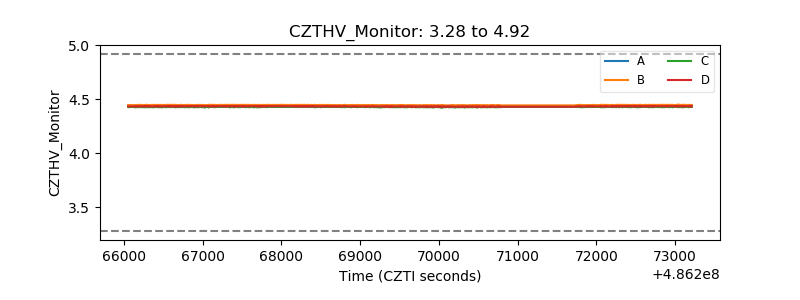 |
| D_VDD | 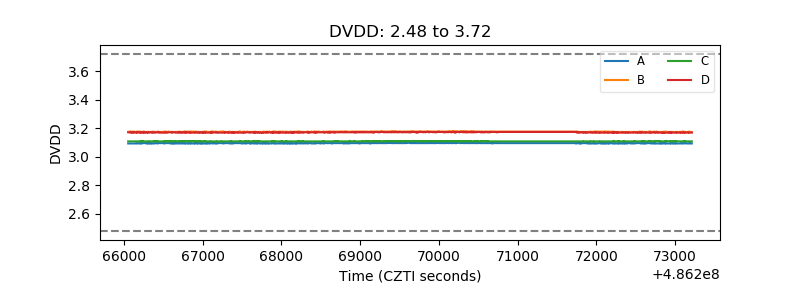 |
| Temperature 1 | 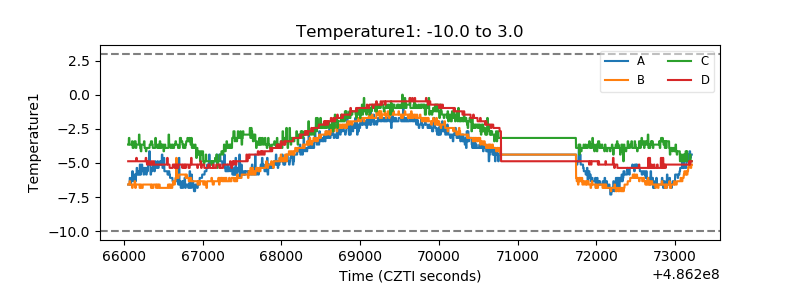 |
| Veto HV Monitor | 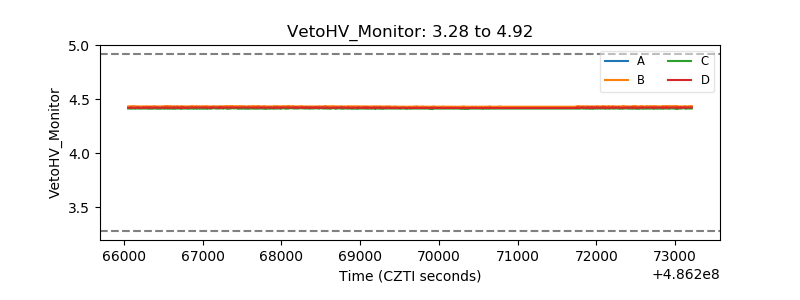 |
| Veto LLD | 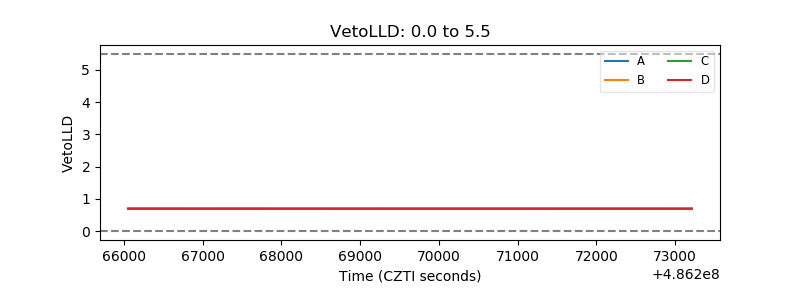 |
| Alpha Counter | 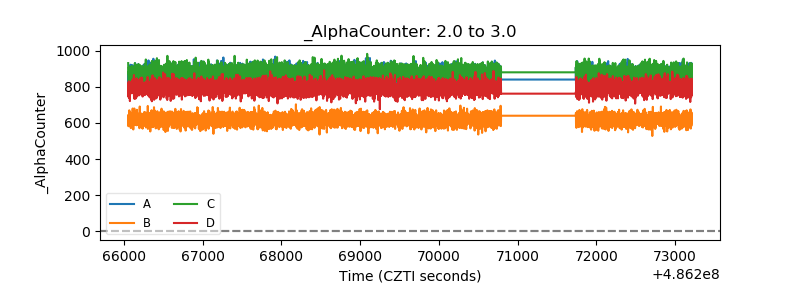 |
| _CPM_Rate | 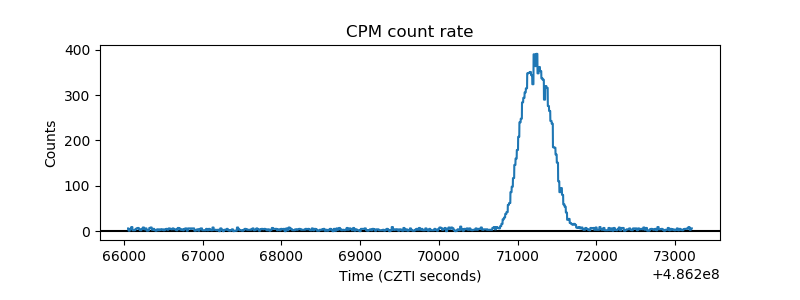 |
| CZT Counter | 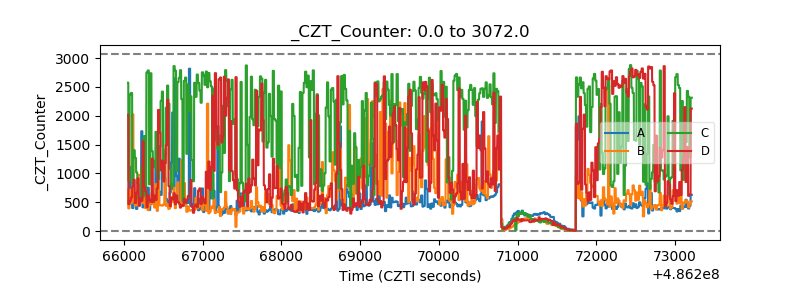 |
| +2.5 Volts monitor | 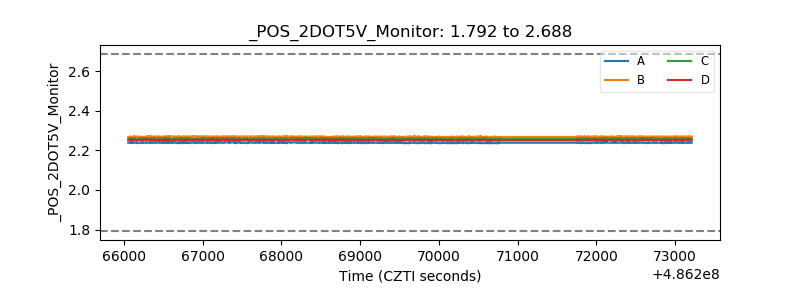 |
| +5 Volts monitor |  |
| _ROLL_ROT | 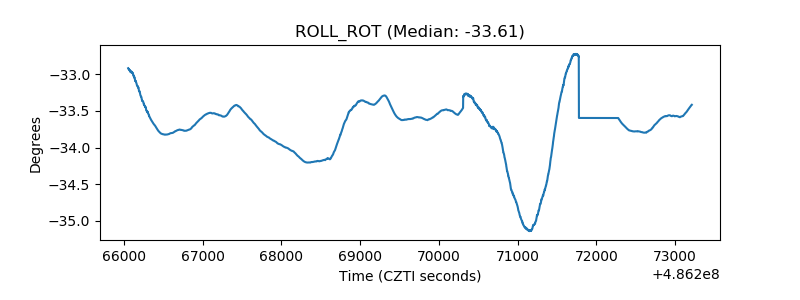 |
| _Roll_DEC | 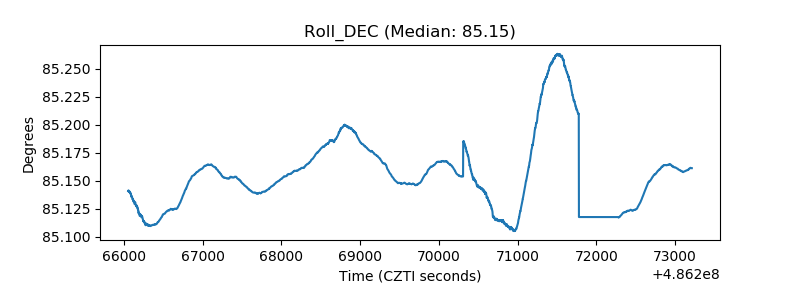 |
| _Roll_RA | 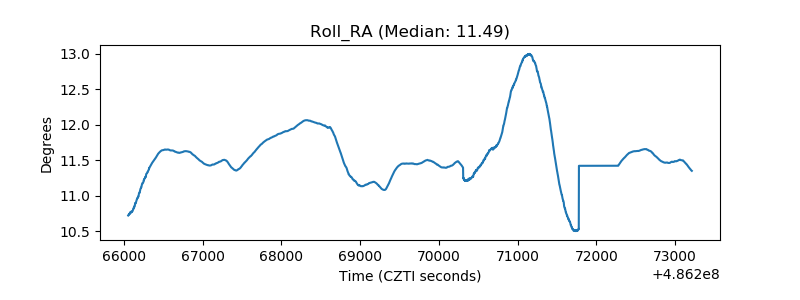 |
| Veto Counter | 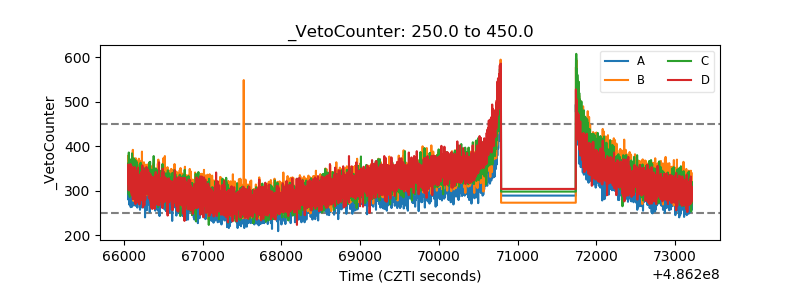 |