| Param | Original file | Final file |
|---|---|---|
| Filename | modeM0/AS1C09_011T05_9000006474_52306cztM0_level2.fits | modeM0/AS1C09_011T05_9000006474_52306cztM0_level2_quad_clean.evt |
| Size (bytes) | 779,852,160 | 72,993,600 |
| Size | 743.7 MB | 69.6 MB |
| Events in quadrant A | 2,955,933 | 571,245 |
| Events in quadrant B | 5,201,179 | 581,803 |
| Events in quadrant C | 10,810,294 | 307,337 |
| Events in quadrant D | 9,432,761 | 327,227 |
| Mode M0 | |||
|---|---|---|---|
| Quadrant | BADHDUFLAG | Total packets | Discarded packets |
| A | 0 | 13187 | 1 |
| B | 0 | 19719 | 1 |
| C | 0 | 36340 | 1 |
| D | 0 | 32233 | 1 |
| Mode SS | |||
|---|---|---|---|
| Quadrant | BADHDUFLAG | Total packets | Discarded packets |
| A | 0 | 124 | 0 |
| B | 0 | 124 | 0 |
| C | 0 | 124 | 0 |
| D | 0 | 124 | 0 |
| Mode M9 | |||
|---|---|---|---|
| Quadrant | BADHDUFLAG | Total packets | Discarded packets |
| A | 0 | 10 | 0 |
| B | 0 | 10 | 0 |
| C | 0 | 10 | 0 |
| D | 0 | 10 | 0 |
| Quadrant | Total seconds | Saturated seconds | Saturation percentage |
|---|---|---|---|
| A | 6040 | 37 | 0.612583% |
| B | 6041 | 421 | 6.969045% |
| C | 6041 | 2976 | 49.263367% |
| D | 6041 | 2338 | 38.702202% |
Noise dominated data is calculated using 1-second bins in cleaned event files. If a bin has >2000 counts, and if more than 50% of those come from <1% of pixels, then it is considered to be noise-dominated and hence unusable.
| Quadrant | # 1 sec bins | Bins with >0 counts | Bins with >2000 counts | High rate bins dominated by noise | Noise dominated (total time) | Noise dominated (detector-on time) | Marked lightcurve |
|---|---|---|---|---|---|---|---|
| A | 7080 | 6040 | 18 | 18 | 0.25% | 0.30% | 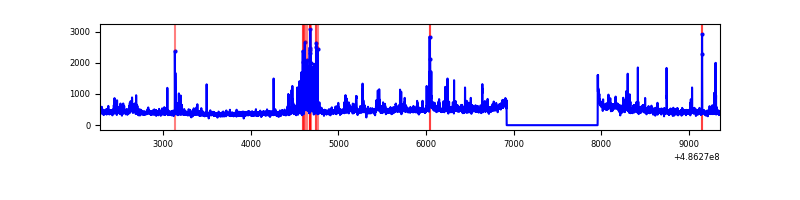 |
| B | 7081 | 6041 | 267 | 267 | 3.77% | 4.42% | 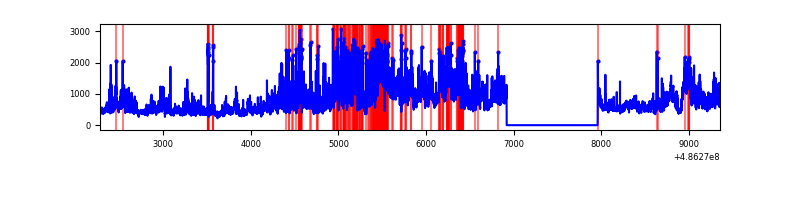 |
| C | 7080 | 6040 | 2813 | 2813 | 39.73% | 46.57% | 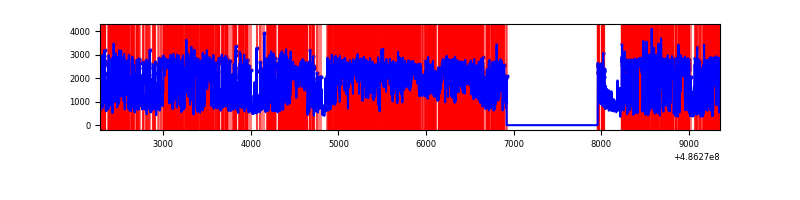 |
| D | 7080 | 6041 | 2245 | 2245 | 31.71% | 37.16% | 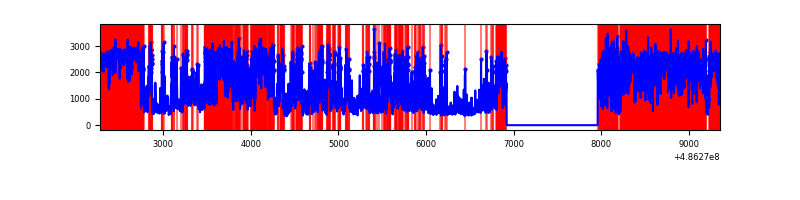 |
Top three noisy pixels from each quadrant. If the there are fewer than three noisy pixels in the level2.evt file, extra rows are filled as -1
| Pixel properties | Quadrant properties | ||||||
|---|---|---|---|---|---|---|---|
| Quadrant | DetID | PixID | Counts | Sigma | Mean | Median | Sigma |
| A | 4 | 249 | 138805 | 885.72 | 622 | 605 | 156.0 |
| A | 5 | 240 | 75943 | 482.84 | 622 | 605 | 156.0 |
| A | 3 | 14 | 75064 | 477.21 | 622 | 605 | 156.0 |
| B | 7 | 0 | 1069208 | 8323.57 | 603 | 582 | 128.4 |
| B | 4 | 171 | 771641 | 6005.81 | 603 | 582 | 128.4 |
| B | 0 | 216 | 589025 | 4583.41 | 603 | 582 | 128.4 |
| C | 15 | 224 | 2471470 | 19569.44 | 453 | 450 | 126.3 |
| C | 9 | 38 | 1628874 | 12896.44 | 453 | 450 | 126.3 |
| C | 0 | 161 | 1545336 | 12234.85 | 453 | 450 | 126.3 |
| D | 6 | 42 | 3379295 | 25025.71 | 464 | 443 | 135.0 |
| D | 12 | 2 | 2801177 | 20743.84 | 464 | 443 | 135.0 |
| D | 7 | 96 | 552879 | 4091.66 | 464 | 443 | 135.0 |
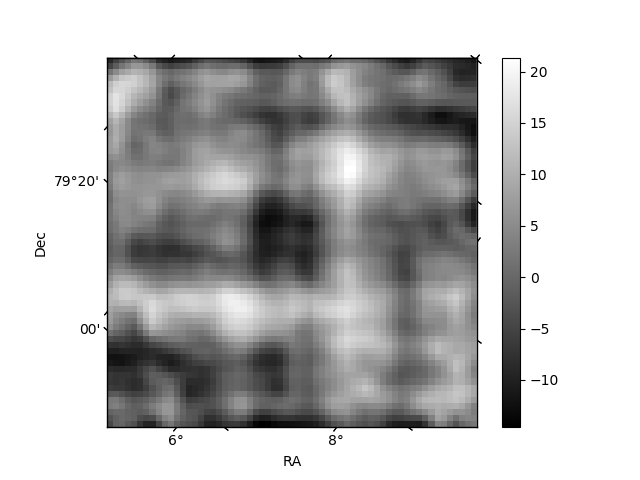
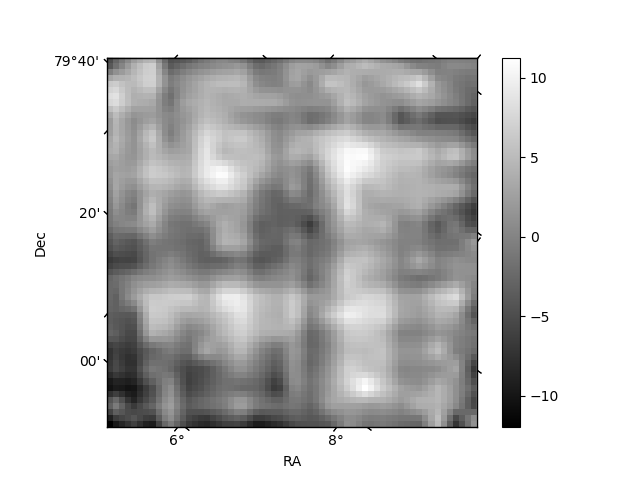
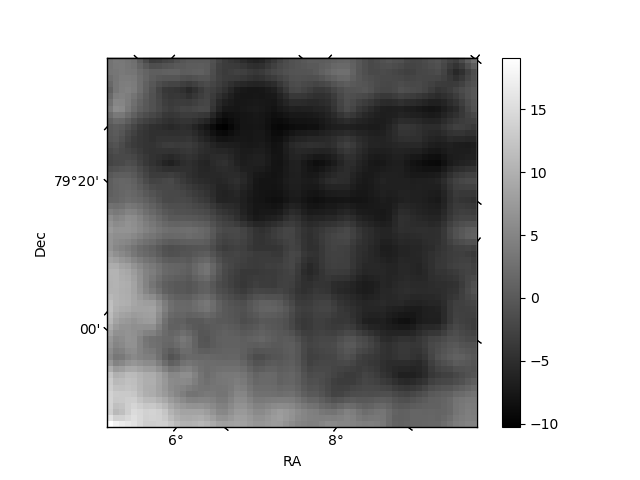
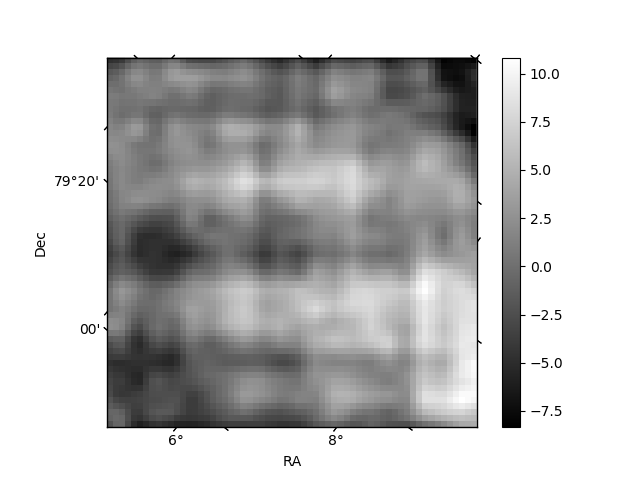
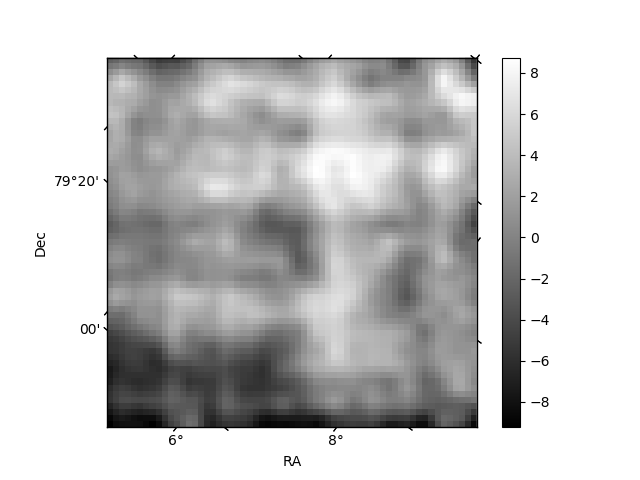
Histogram calculated using DETX and DETY for each event in the final _common_clean file
| Quadrant A | 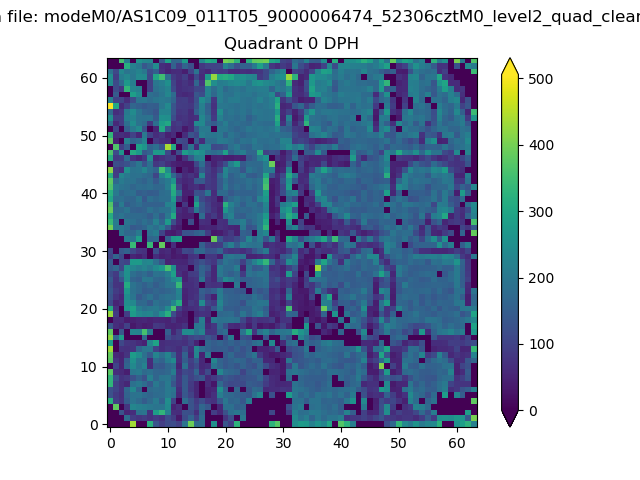 |
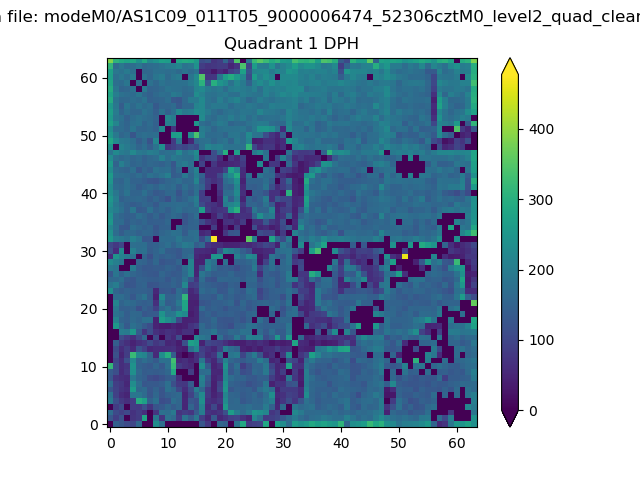 |
Quadrant B |
|---|---|---|---|
| Quadrant D | 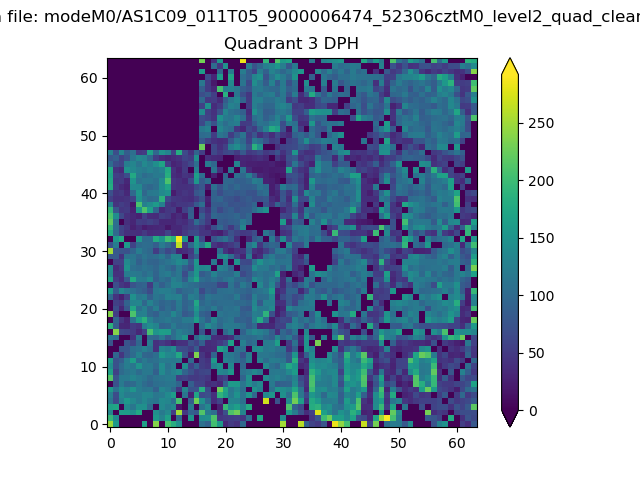 |
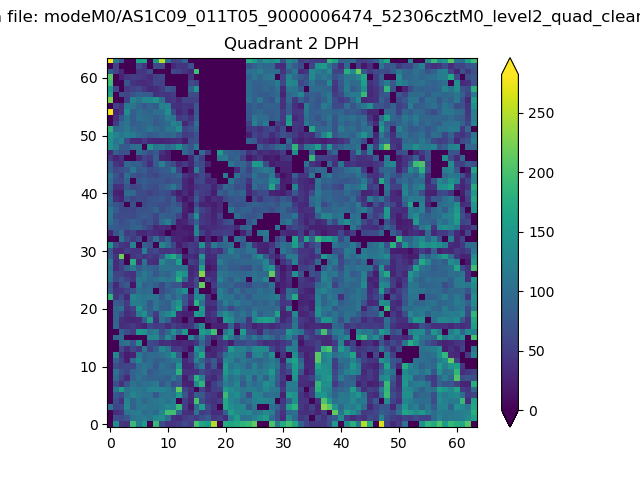 |
Quadrant C |
| Plot type | Count rate plots | Images |
|---|---|---|
| Comparison with Poisson distribution Blue bars denote a histogram of data divided into 1 sec bins. Red curve is a Poisson curve with rate = median count rate of data. |
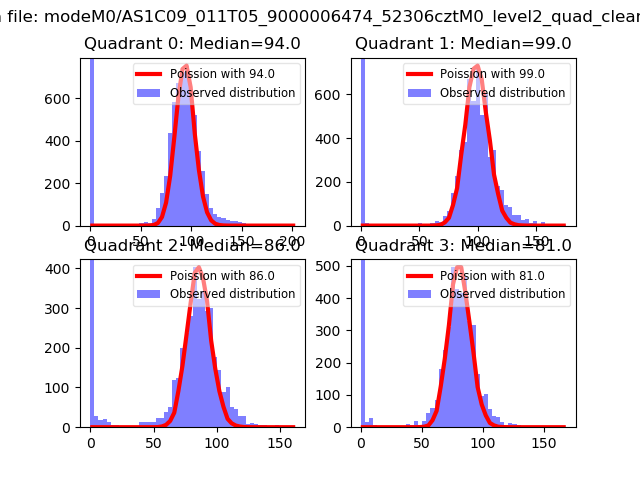 |
 |
| Quadrant-wise count rates Data is divided into 100 sec bins |
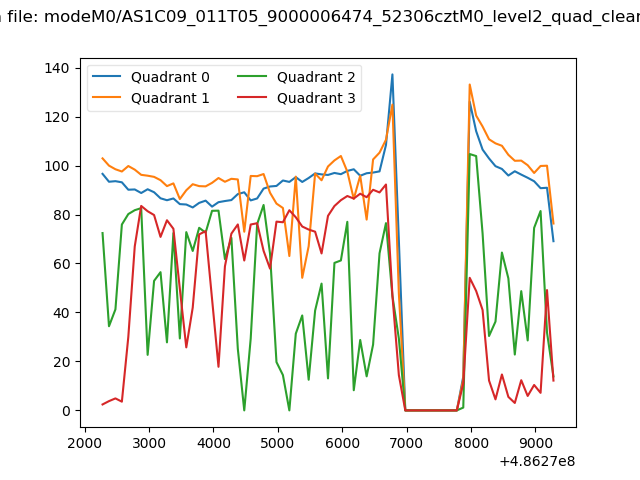 |
|
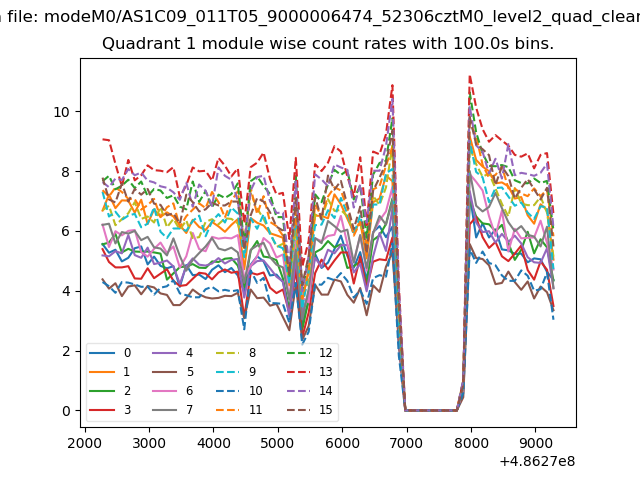
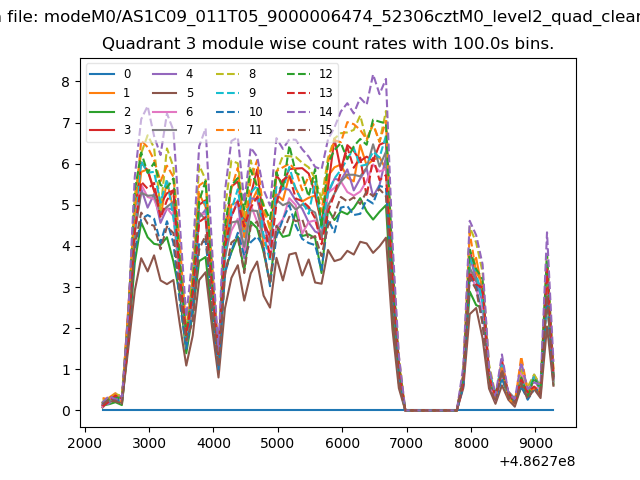
| Module-wise count rates for Quadrant A Data is divided into 100 sec bins |
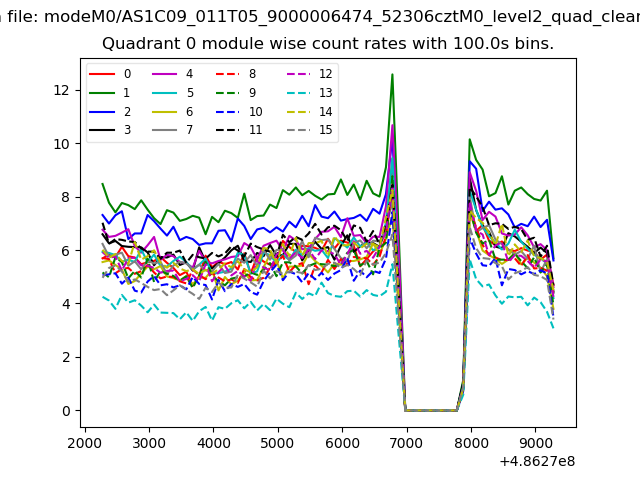 |
 |
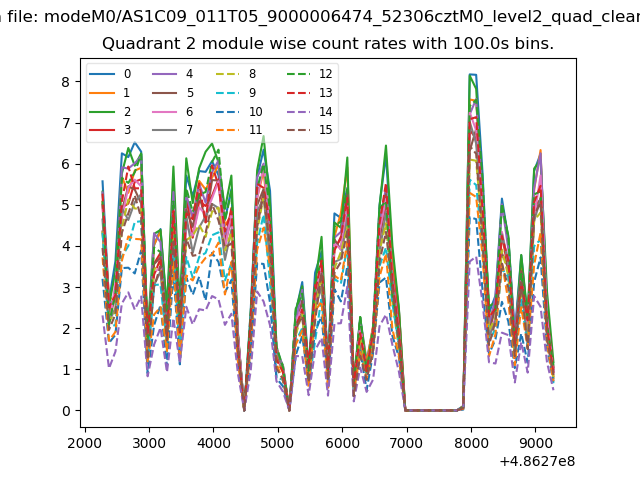
| Module-wise count rates for Quadrant B Data is divided into 100 sec bins |
 |
 |
| Module-wise count rates for Quadrant C Data is divided into 100 sec bins |
 |
 |
| Module-wise count rates for Quadrant D Data is divided into 100 sec bins |
 |
 |
| Parameter | Plot |
|---|---|
| CZT HV Monitor | 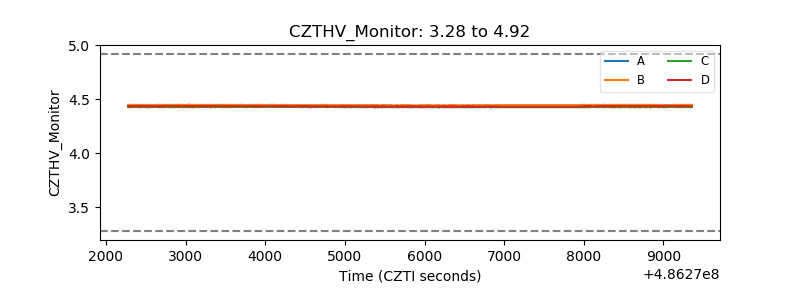 |
| D_VDD | 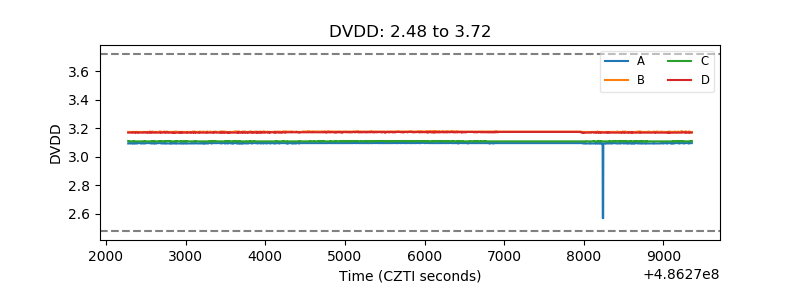 |
| Temperature 1 | 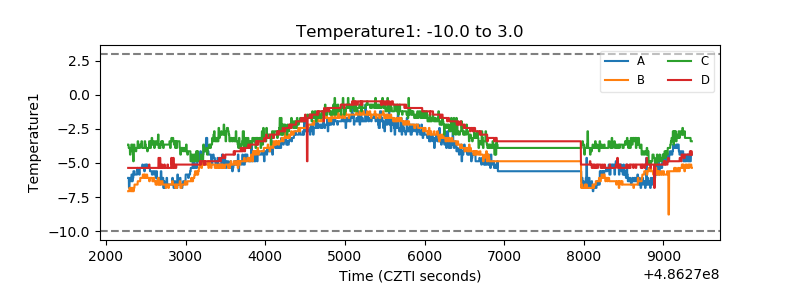 |
| Veto HV Monitor | 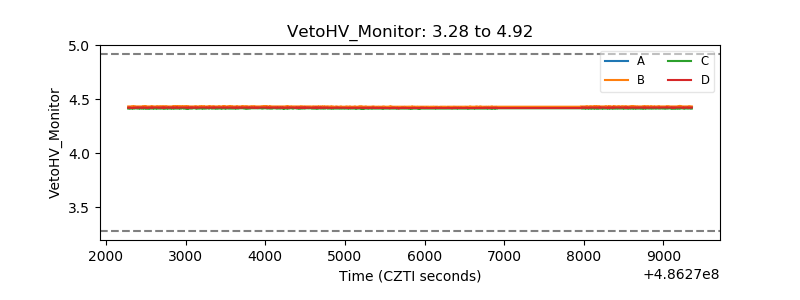 |
| Veto LLD | 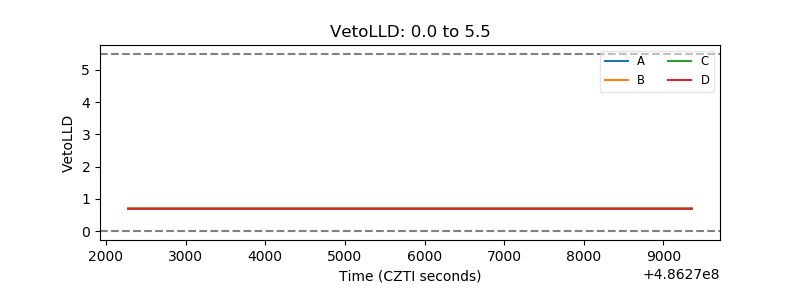 |
| Alpha Counter | 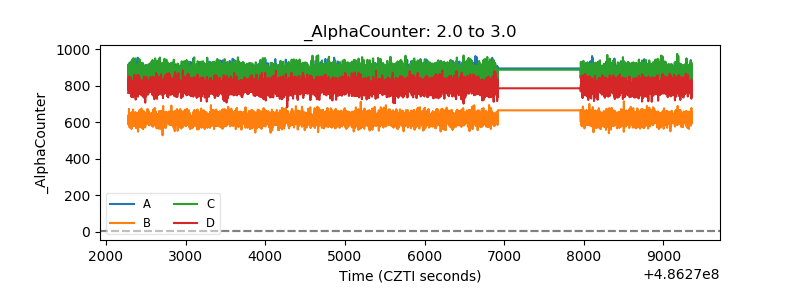 |
| _CPM_Rate | 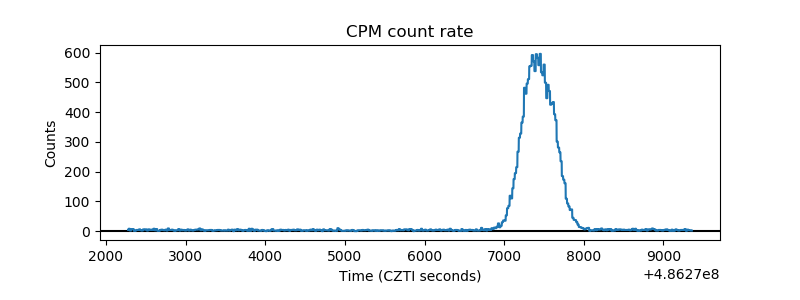 |
| CZT Counter | 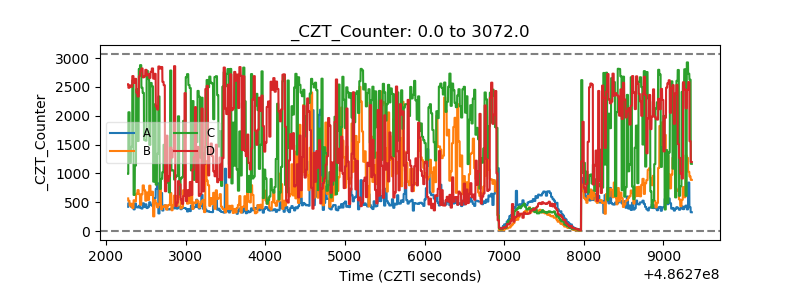 |
| +2.5 Volts monitor |  |
| +5 Volts monitor |  |
| _ROLL_ROT | 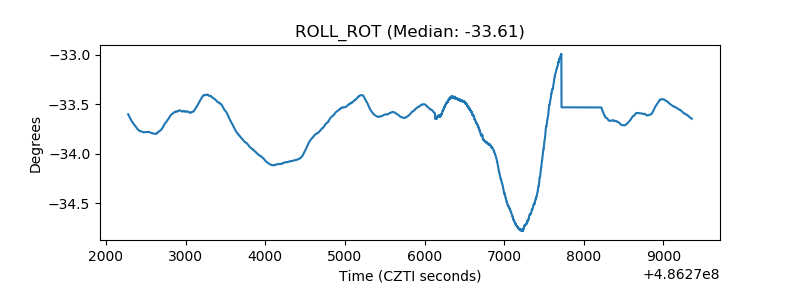 |
| _Roll_DEC | 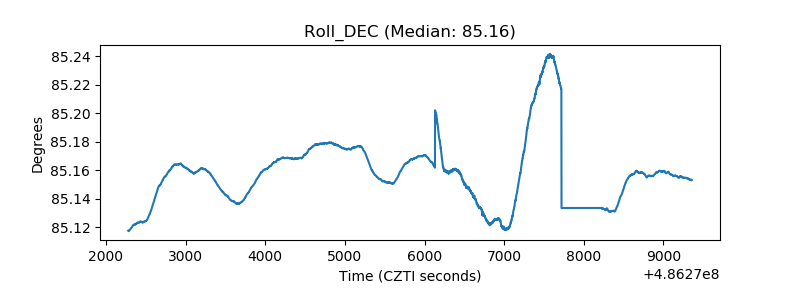 |
| _Roll_RA | 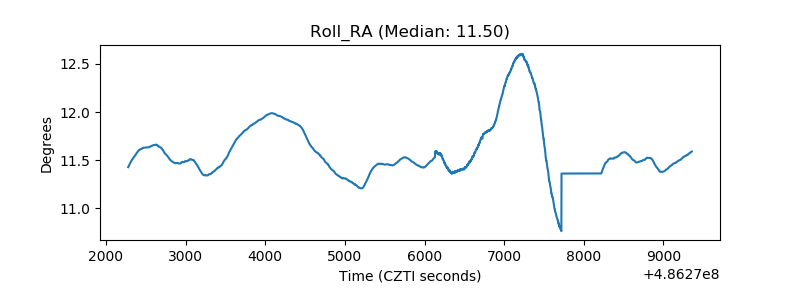 |
| Veto Counter | 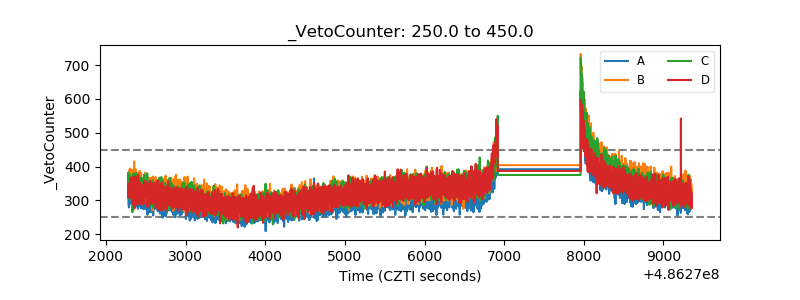 |