| Param | Original file | Final file |
|---|---|---|
| Filename | modeM0/AS1C09_011T05_9000006474_52307cztM0_level2.fits | modeM0/AS1C09_011T05_9000006474_52307cztM0_level2_quad_clean.evt |
| Size (bytes) | 824,391,360 | 74,957,760 |
| Size | 786.2 MB | 71.5 MB |
| Events in quadrant A | 3,204,561 | 605,501 |
| Events in quadrant B | 4,516,639 | 636,536 |
| Events in quadrant C | 10,690,413 | 337,392 |
| Events in quadrant D | 11,618,532 | 251,352 |
| Mode M0 | |||
|---|---|---|---|
| Quadrant | BADHDUFLAG | Total packets | Discarded packets |
| A | 0 | 13889 | 1 |
| B | 0 | 17797 | 1 |
| C | 0 | 36071 | 1 |
| D | 0 | 38856 | 1 |
| Mode SS | |||
|---|---|---|---|
| Quadrant | BADHDUFLAG | Total packets | Discarded packets |
| A | 0 | 128 | 0 |
| B | 0 | 128 | 0 |
| C | 0 | 128 | 0 |
| D | 0 | 128 | 0 |
| Mode M9 | |||
|---|---|---|---|
| Quadrant | BADHDUFLAG | Total packets | Discarded packets |
| A | 0 | 11 | 0 |
| B | 0 | 11 | 0 |
| C | 0 | 11 | 0 |
| D | 0 | 11 | 0 |
| Quadrant | Total seconds | Saturated seconds | Saturation percentage |
|---|---|---|---|
| A | 6280 | 75 | 1.194268% |
| B | 6280 | 229 | 3.646497% |
| C | 6281 | 2929 | 46.632702% |
| D | 6281 | 3623 | 57.681898% |
Noise dominated data is calculated using 1-second bins in cleaned event files. If a bin has >2000 counts, and if more than 50% of those come from <1% of pixels, then it is considered to be noise-dominated and hence unusable.
| Quadrant | # 1 sec bins | Bins with >0 counts | Bins with >2000 counts | High rate bins dominated by noise | Noise dominated (total time) | Noise dominated (detector-on time) | Marked lightcurve |
|---|---|---|---|---|---|---|---|
| A | 7390 | 6281 | 28 | 28 | 0.38% | 0.45% | 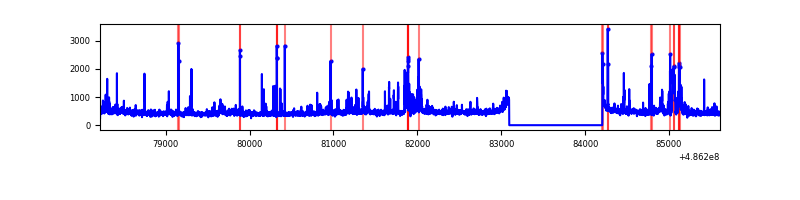 |
| B | 7390 | 6281 | 155 | 155 | 2.10% | 2.47% | 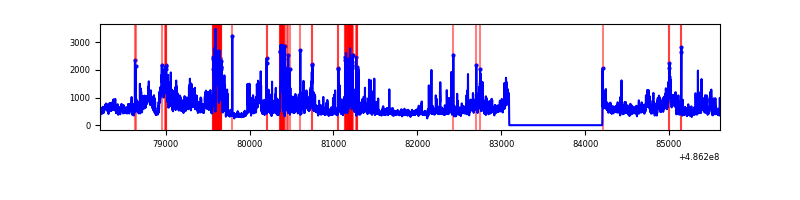 |
| C | 7391 | 6281 | 2759 | 2759 | 37.33% | 43.93% | 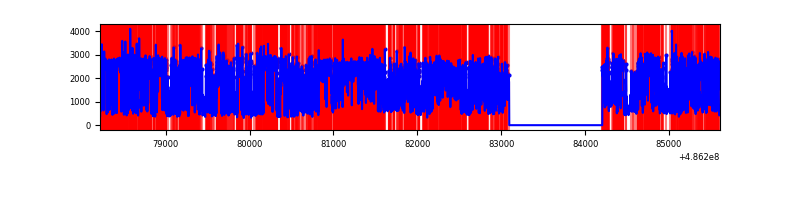 |
| D | 7391 | 6281 | 3441 | 3441 | 46.56% | 54.78% | 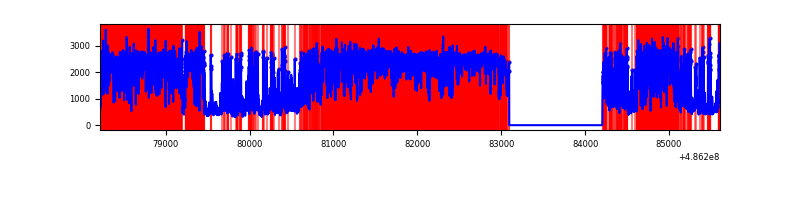 |
Top three noisy pixels from each quadrant. If the there are fewer than three noisy pixels in the level2.evt file, extra rows are filled as -1
| Pixel properties | Quadrant properties | ||||||
|---|---|---|---|---|---|---|---|
| Quadrant | DetID | PixID | Counts | Sigma | Mean | Median | Sigma |
| A | 12 | 3 | 200009 | 1211.48 | 658 | 643 | 164.6 |
| A | 3 | 14 | 97660 | 589.54 | 658 | 643 | 164.6 |
| A | 15 | 250 | 45709 | 273.85 | 658 | 643 | 164.6 |
| B | 7 | 0 | 844305 | 6194.4 | 641 | 619 | 136.2 |
| B | 4 | 171 | 379202 | 2779.58 | 641 | 619 | 136.2 |
| B | 0 | 216 | 233726 | 1711.49 | 641 | 619 | 136.2 |
| C | 9 | 38 | 3037081 | 22704.33 | 478 | 474 | 133.7 |
| C | 15 | 224 | 2636693 | 19710.68 | 478 | 474 | 133.7 |
| C | 0 | 161 | 1809449 | 13525.48 | 478 | 474 | 133.7 |
| D | 12 | 2 | 4483199 | 35259.59 | 436 | 415 | 127.1 |
| D | 15 | 93 | 3060630 | 24070.3 | 436 | 415 | 127.1 |
| D | 8 | 176 | 802914 | 6312.1 | 436 | 415 | 127.1 |
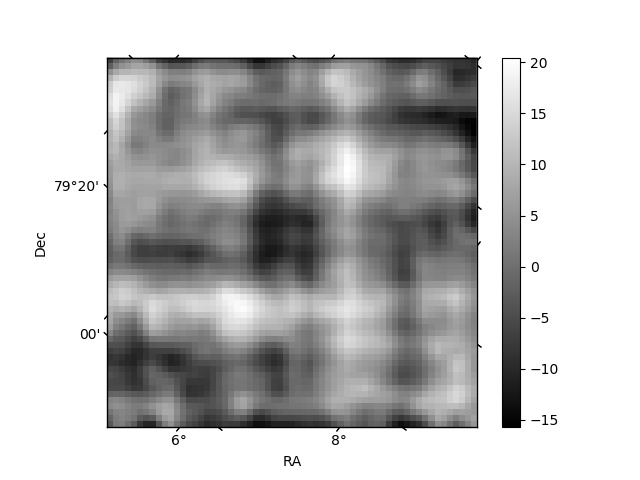
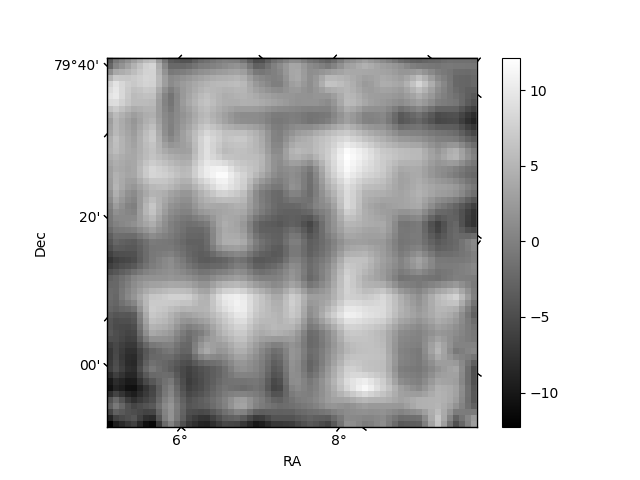
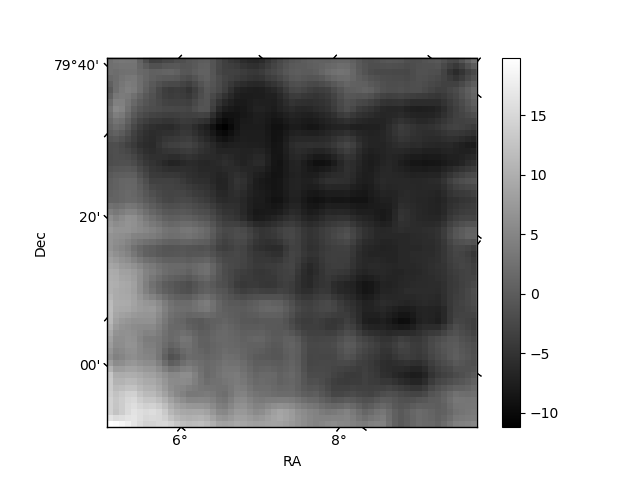
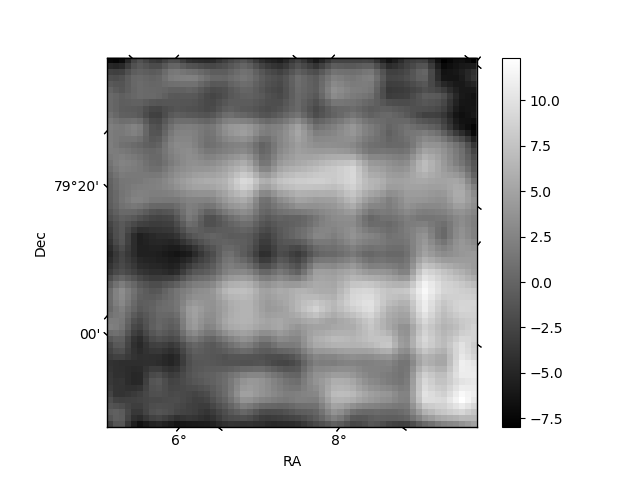
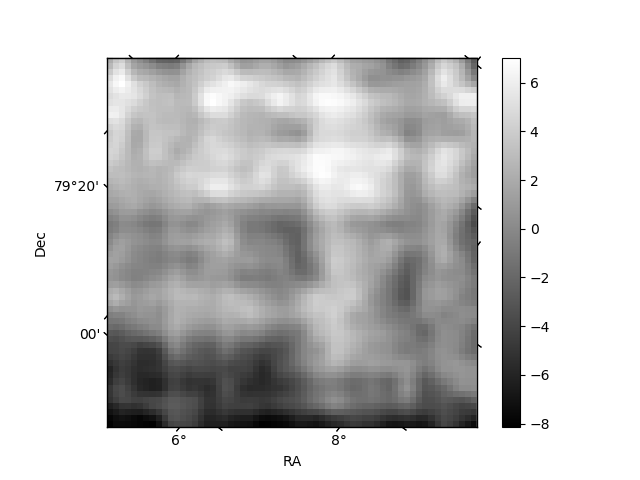
Histogram calculated using DETX and DETY for each event in the final _common_clean file
| Quadrant A | 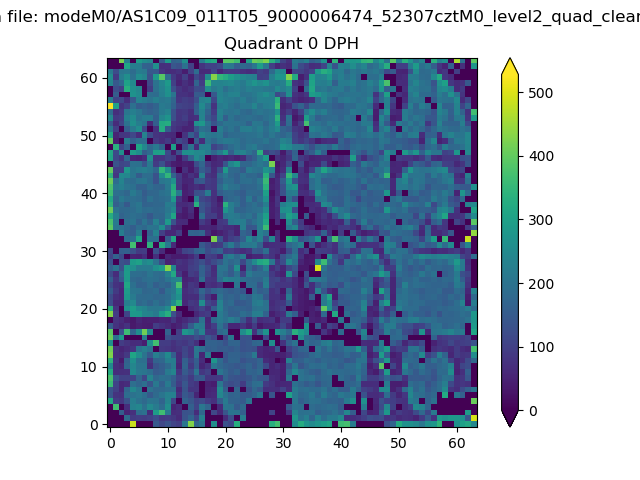 |
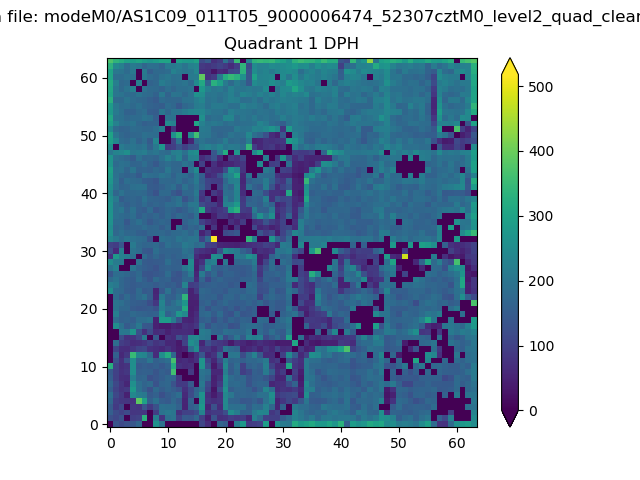 |
Quadrant B |
|---|---|---|---|
| Quadrant D | 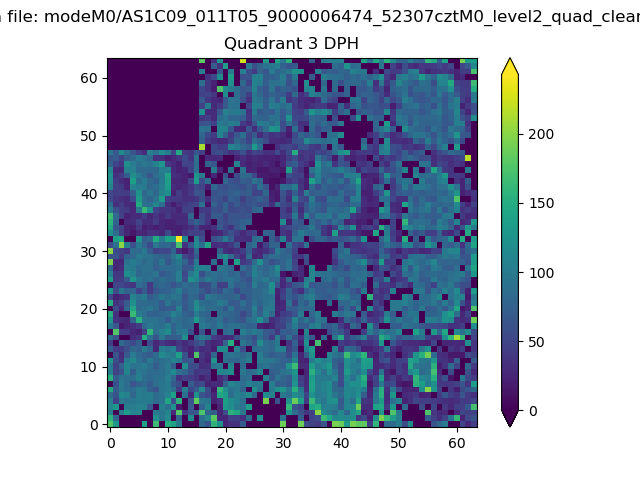 |
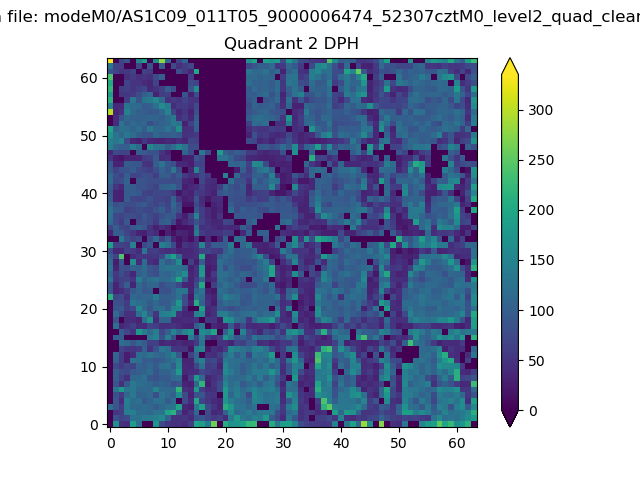 |
Quadrant C |
| Plot type | Count rate plots | Images |
|---|---|---|
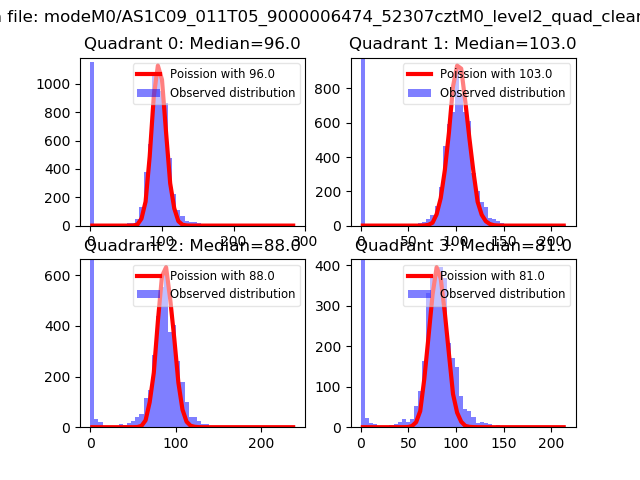
| Comparison with Poisson distribution Blue bars denote a histogram of data divided into 1 sec bins. Red curve is a Poisson curve with rate = median count rate of data. |
 |
 |
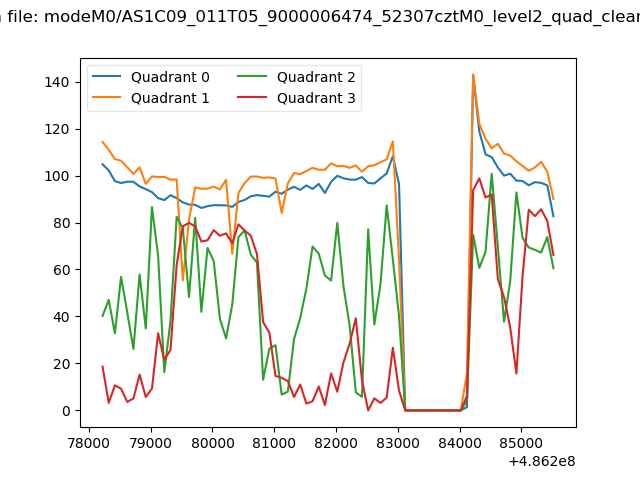
| Quadrant-wise count rates Data is divided into 100 sec bins |
 |
|
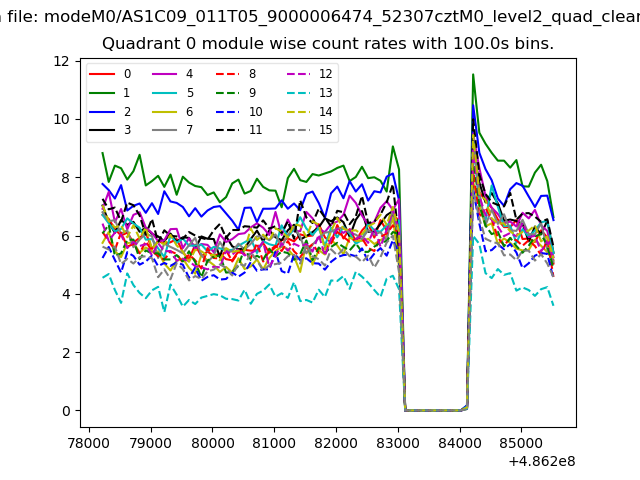
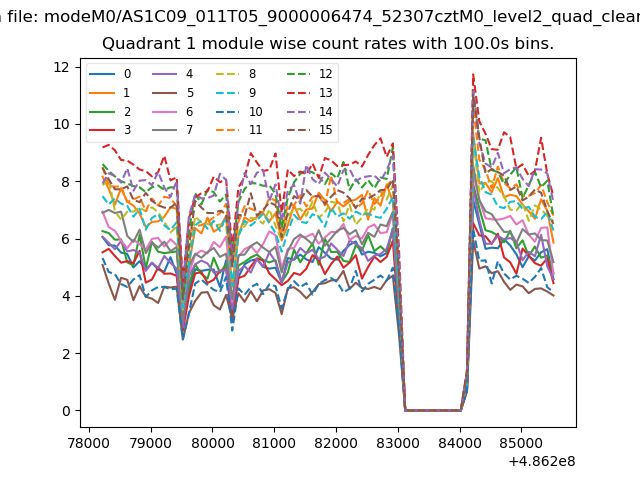
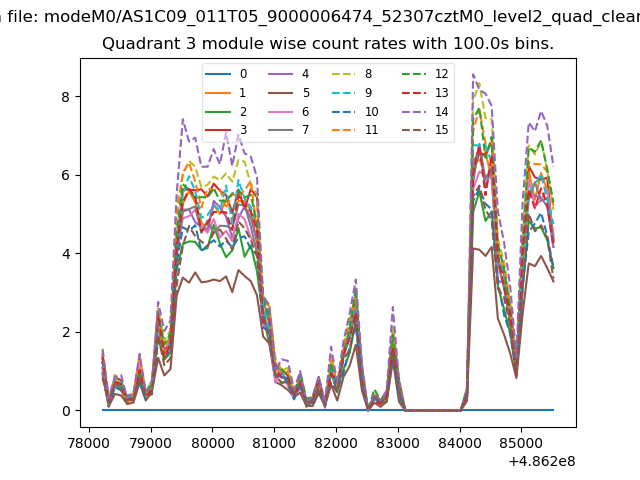
| Module-wise count rates for Quadrant A Data is divided into 100 sec bins |
 |
 |
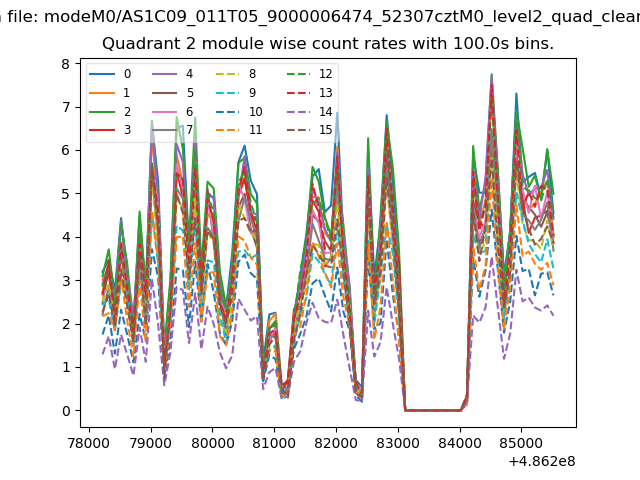
| Module-wise count rates for Quadrant B Data is divided into 100 sec bins |
 |
 |
| Module-wise count rates for Quadrant C Data is divided into 100 sec bins |
 |
 |
| Module-wise count rates for Quadrant D Data is divided into 100 sec bins |
 |
 |
| Parameter | Plot |
|---|---|
| CZT HV Monitor | 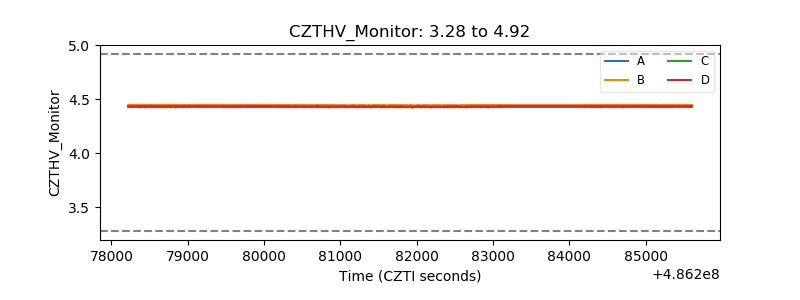 |
| D_VDD | 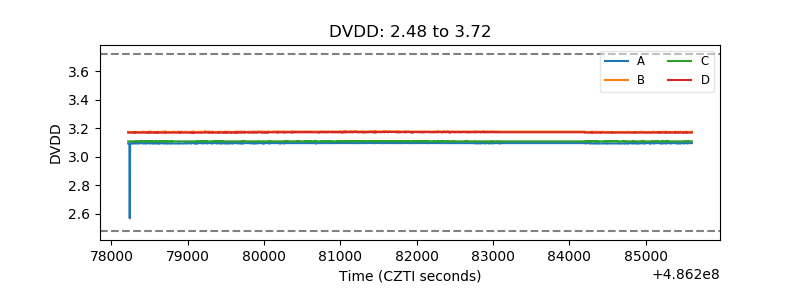 |
| Temperature 1 | 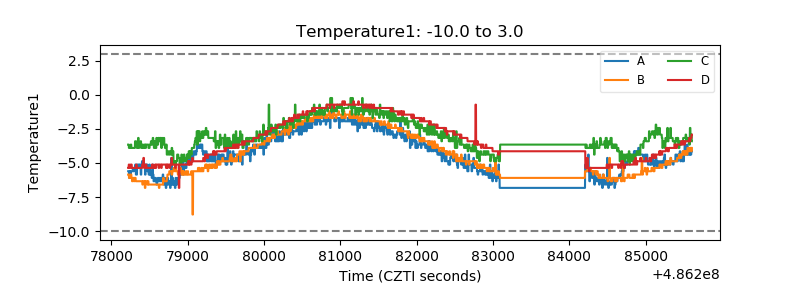 |
| Veto HV Monitor | 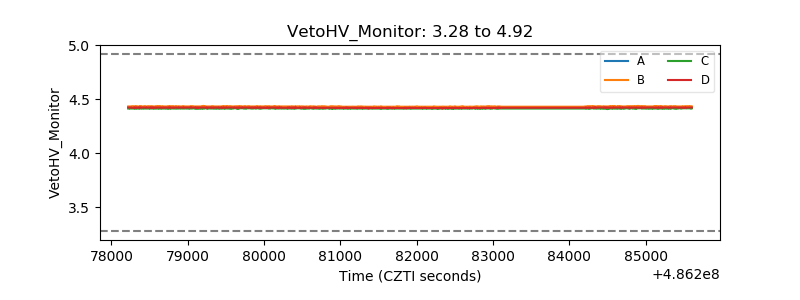 |
| Veto LLD | 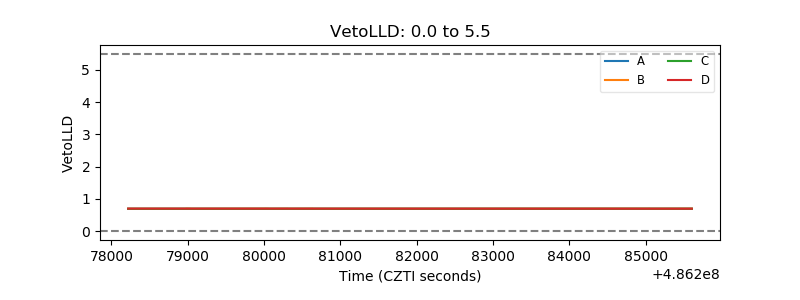 |
| Alpha Counter | 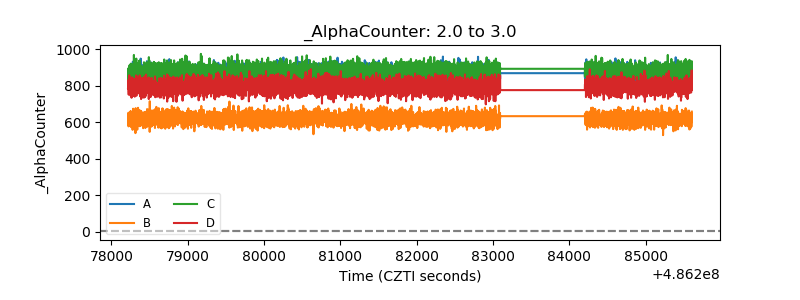 |
| _CPM_Rate | 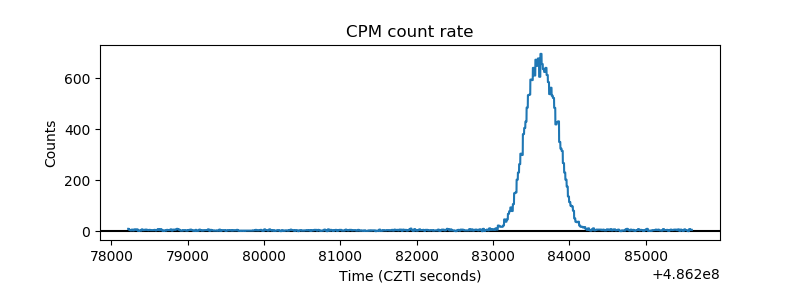 |
| CZT Counter | 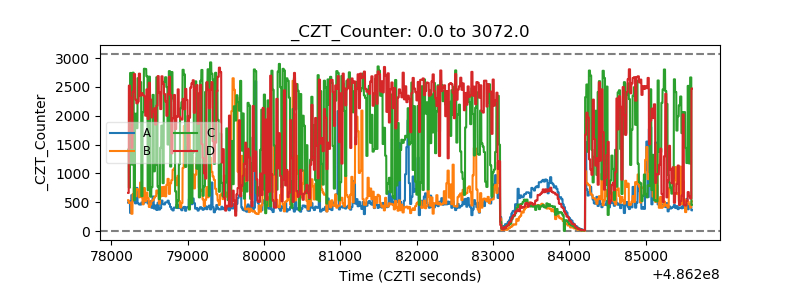 |
| +2.5 Volts monitor | 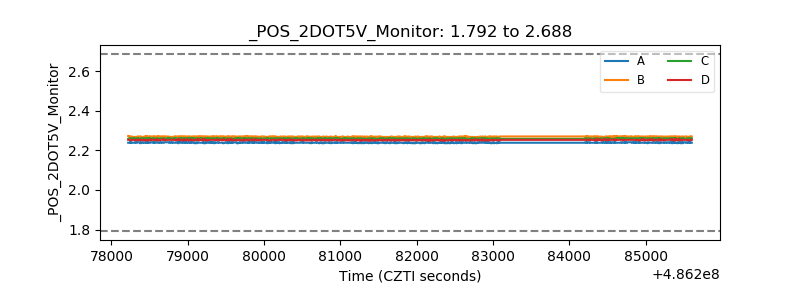 |
| +5 Volts monitor |  |
| _ROLL_ROT | 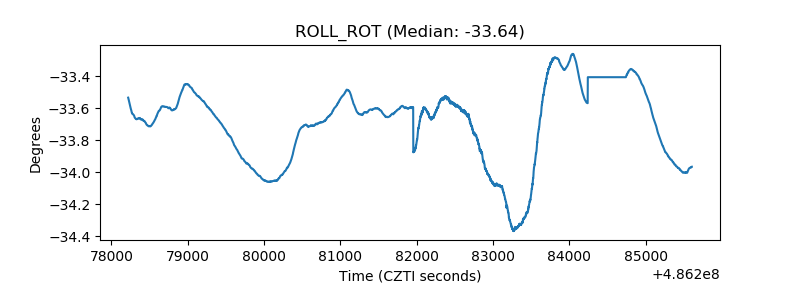 |
| _Roll_DEC | 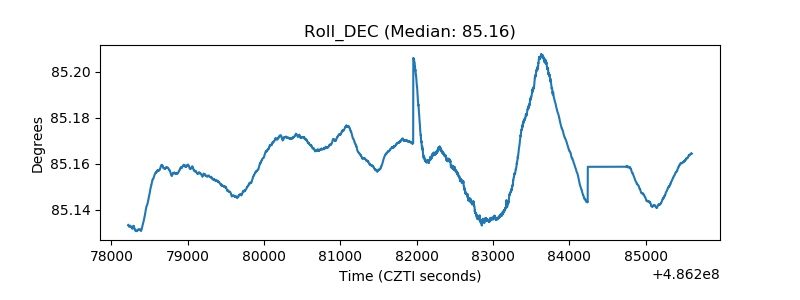 |
| _Roll_RA | 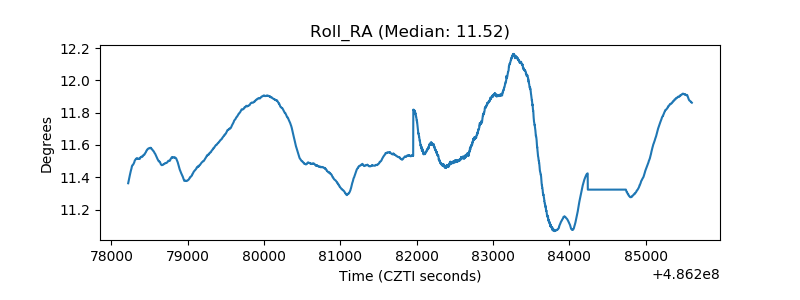 |
| Veto Counter | 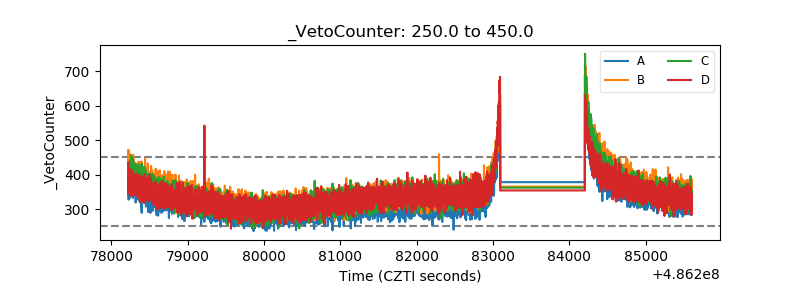 |