| Param | Original file | Final file |
|---|---|---|
| Filename | modeM0/AS1C09_011T05_9000006474_52308cztM0_level2.fits | modeM0/AS1C09_011T05_9000006474_52308cztM0_level2_quad_clean.evt |
| Size (bytes) | 728,752,320 | 74,695,680 |
| Size | 695.0 MB | 71.2 MB |
| Events in quadrant A | 3,163,592 | 570,209 |
| Events in quadrant B | 3,652,772 | 608,074 |
| Events in quadrant C | 10,761,345 | 286,682 |
| Events in quadrant D | 8,940,688 | 383,513 |
| Mode M0 | |||
|---|---|---|---|
| Quadrant | BADHDUFLAG | Total packets | Discarded packets |
| A | 0 | 13370 | 1 |
| B | 0 | 14925 | 1 |
| C | 0 | 36060 | 1 |
| D | 0 | 30699 | 1 |
| Mode SS | |||
|---|---|---|---|
| Quadrant | BADHDUFLAG | Total packets | Discarded packets |
| A | 0 | 120 | 0 |
| B | 0 | 120 | 0 |
| C | 0 | 120 | 0 |
| D | 0 | 120 | 0 |
| Mode M9 | |||
|---|---|---|---|
| Quadrant | BADHDUFLAG | Total packets | Discarded packets |
| A | 0 | 11 | 0 |
| B | 0 | 11 | 0 |
| C | 0 | 11 | 0 |
| D | 0 | 11 | 0 |
| Quadrant | Total seconds | Saturated seconds | Saturation percentage |
|---|---|---|---|
| A | 5908 | 91 | 1.540284% |
| B | 5909 | 132 | 2.233881% |
| C | 5909 | 3123 | 52.851582% |
| D | 5909 | 1876 | 31.748181% |
Noise dominated data is calculated using 1-second bins in cleaned event files. If a bin has >2000 counts, and if more than 50% of those come from <1% of pixels, then it is considered to be noise-dominated and hence unusable.
| Quadrant | # 1 sec bins | Bins with >0 counts | Bins with >2000 counts | High rate bins dominated by noise | Noise dominated (total time) | Noise dominated (detector-on time) | Marked lightcurve |
|---|---|---|---|---|---|---|---|
| A | 7048 | 5909 | 69 | 69 | 0.98% | 1.17% | 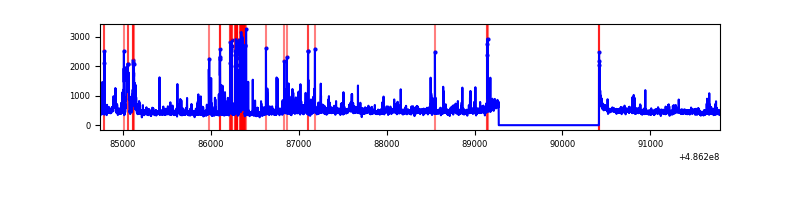 |
| B | 7049 | 5909 | 59 | 59 | 0.84% | 1.00% | 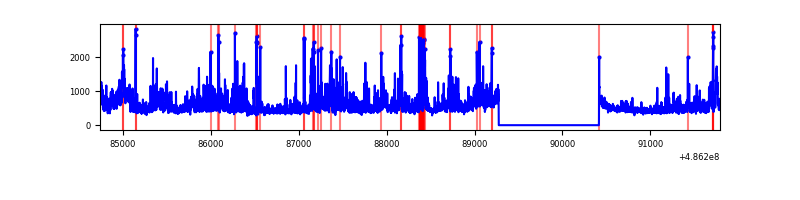 |
| C | 7048 | 5908 | 2996 | 2996 | 42.51% | 50.71% | 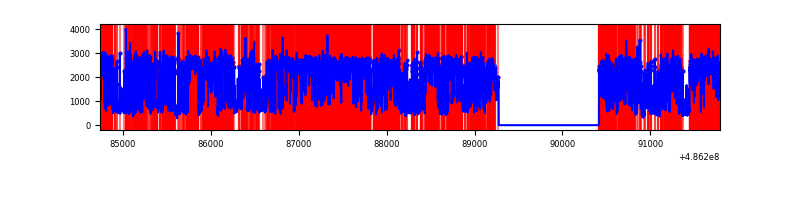 |
| D | 7049 | 5910 | 1854 | 1854 | 26.30% | 31.37% | 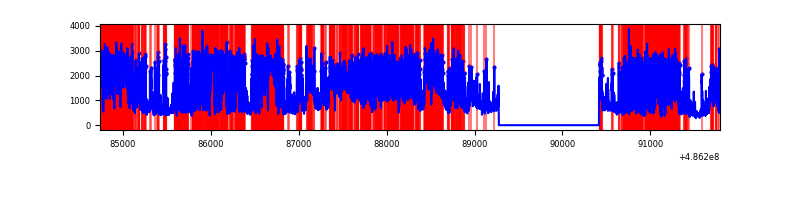 |
Top three noisy pixels from each quadrant. If the there are fewer than three noisy pixels in the level2.evt file, extra rows are filled as -1
| Pixel properties | Quadrant properties | ||||||
|---|---|---|---|---|---|---|---|
| Quadrant | DetID | PixID | Counts | Sigma | Mean | Median | Sigma |
| A | 11 | 3 | 264624 | 1704.91 | 619 | 604 | 154.9 |
| A | 12 | 3 | 105338 | 676.32 | 619 | 604 | 154.9 |
| A | 3 | 14 | 67391 | 431.28 | 619 | 604 | 154.9 |
| B | 0 | 216 | 325149 | 2557.21 | 606 | 586 | 126.9 |
| B | 4 | 171 | 305046 | 2398.82 | 606 | 586 | 126.9 |
| B | 10 | 254 | 224923 | 1767.54 | 606 | 586 | 126.9 |
| C | 9 | 38 | 3345986 | 27370.79 | 438 | 435 | 122.2 |
| C | 15 | 224 | 2372750 | 19408.5 | 438 | 435 | 122.2 |
| C | 0 | 161 | 1251493 | 10235.22 | 438 | 435 | 122.2 |
| D | 12 | 2 | 4048353 | 27475.01 | 512 | 487 | 147.3 |
| D | 2 | 172 | 1109396 | 7526.75 | 512 | 487 | 147.3 |
| D | 15 | 93 | 808254 | 5482.74 | 512 | 487 | 147.3 |
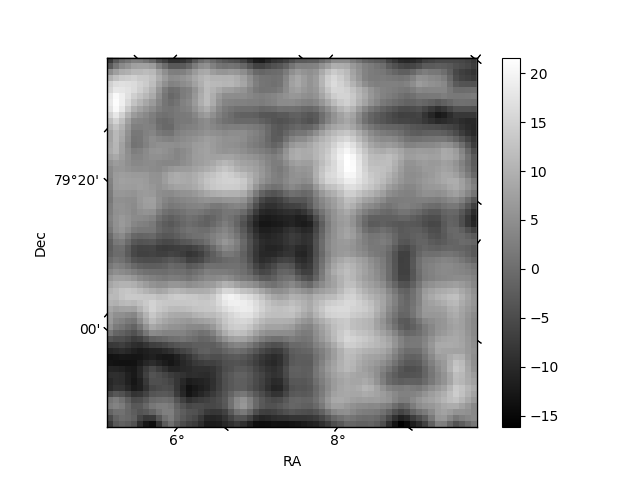
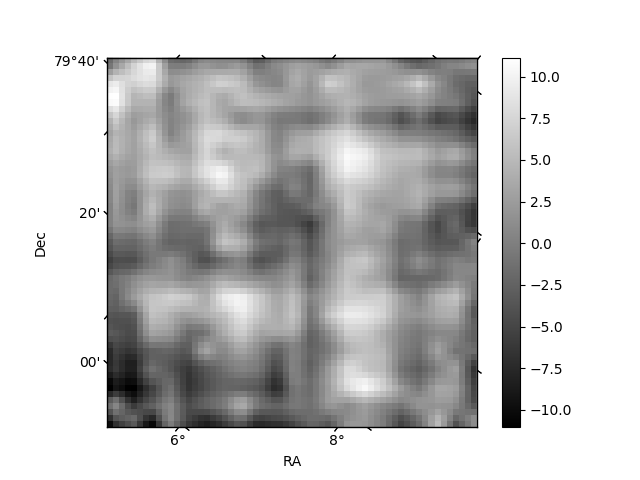
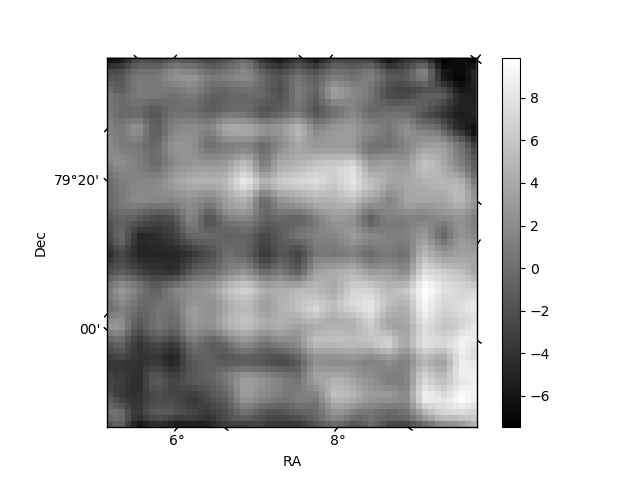
Histogram calculated using DETX and DETY for each event in the final _common_clean file
| Quadrant A | 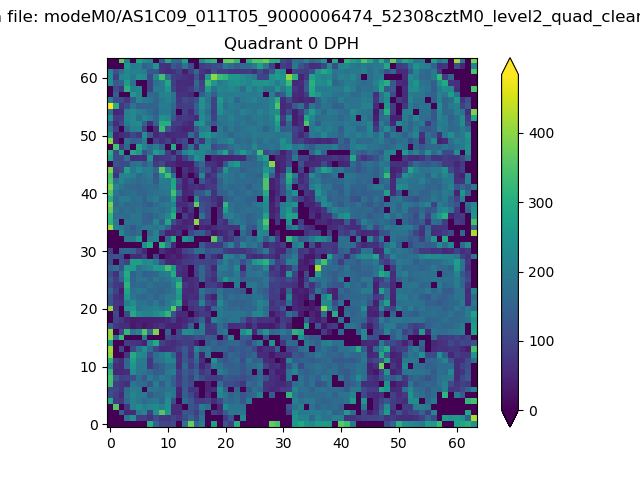 |
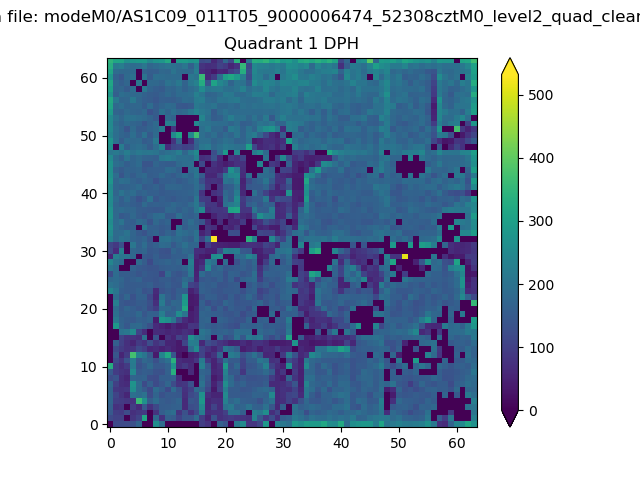 |
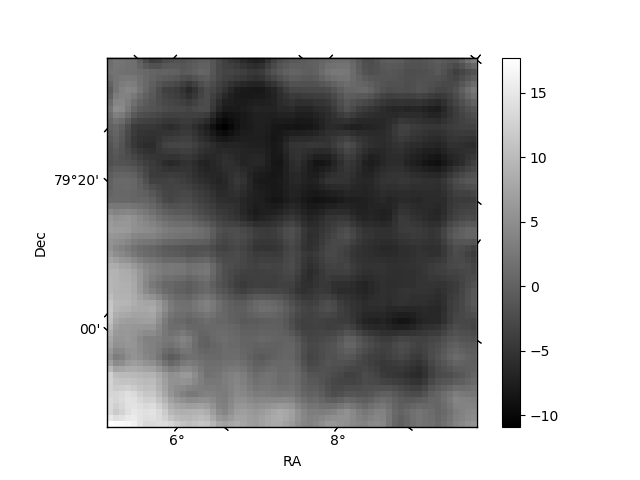
Quadrant B |
|---|---|---|---|
| Quadrant D | 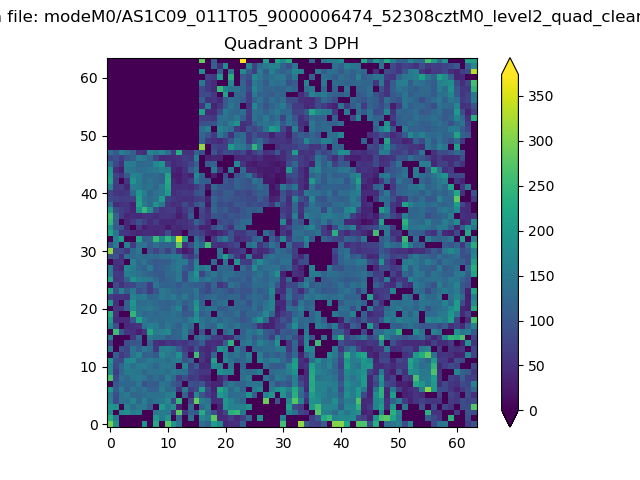 |
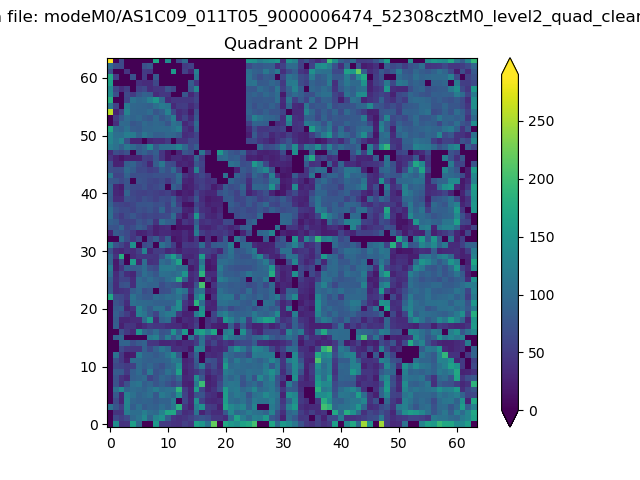 |
Quadrant C |
| Plot type | Count rate plots | Images |
|---|---|---|
| Comparison with Poisson distribution Blue bars denote a histogram of data divided into 1 sec bins. Red curve is a Poisson curve with rate = median count rate of data. |
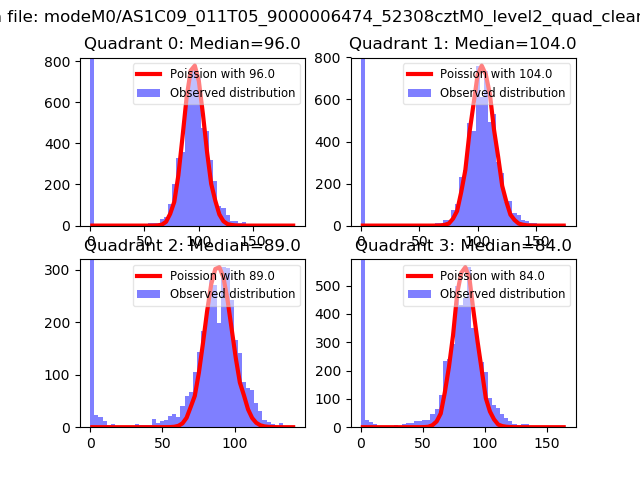 |
 |
| Quadrant-wise count rates Data is divided into 100 sec bins |
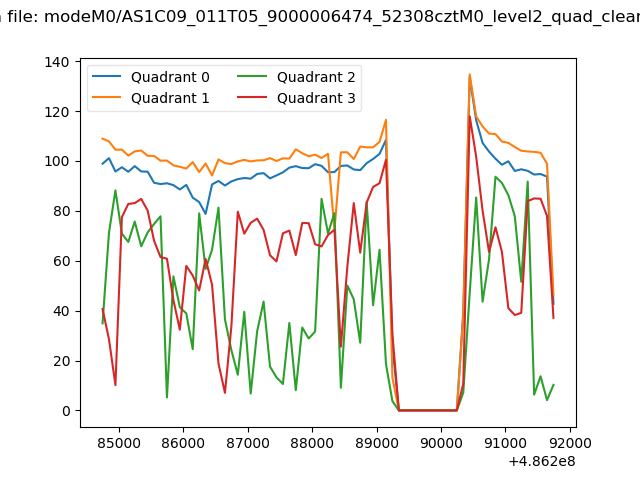 |
|
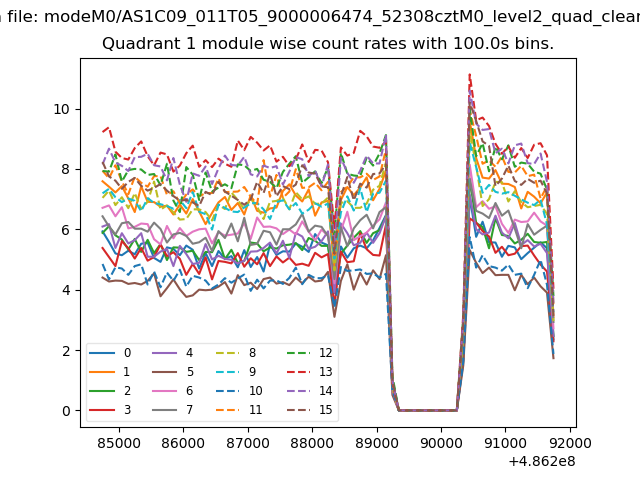
| Module-wise count rates for Quadrant A Data is divided into 100 sec bins |
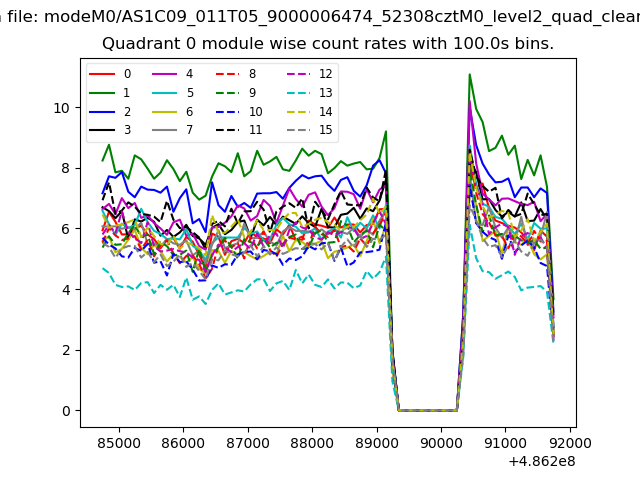 |
 |
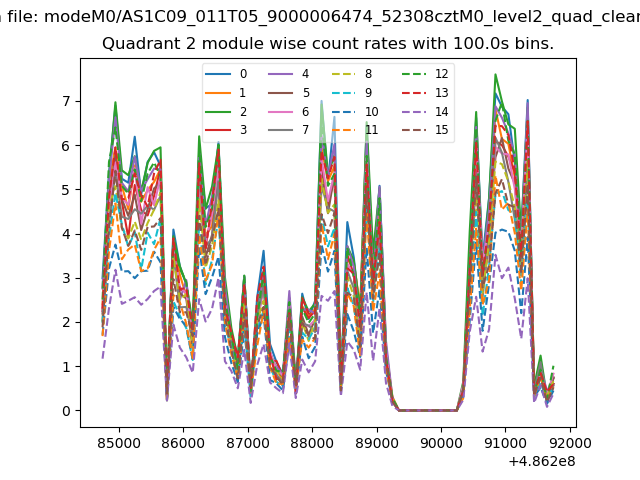
| Module-wise count rates for Quadrant B Data is divided into 100 sec bins |
 |
 |
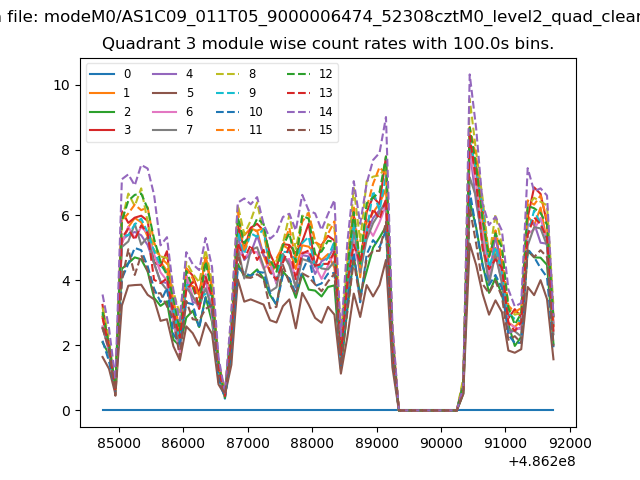
| Module-wise count rates for Quadrant C Data is divided into 100 sec bins |
 |
 |
| Module-wise count rates for Quadrant D Data is divided into 100 sec bins |
 |
 |
| Parameter | Plot |
|---|---|
| CZT HV Monitor | 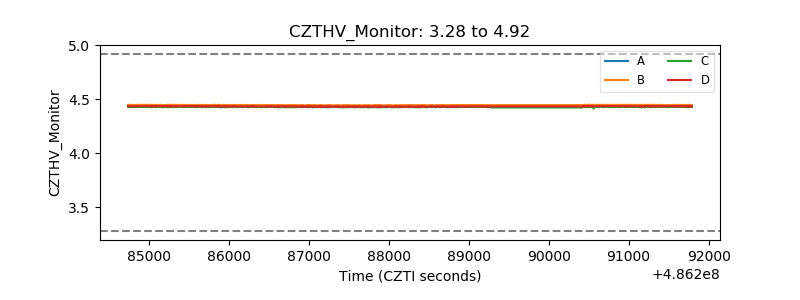 |
| D_VDD | 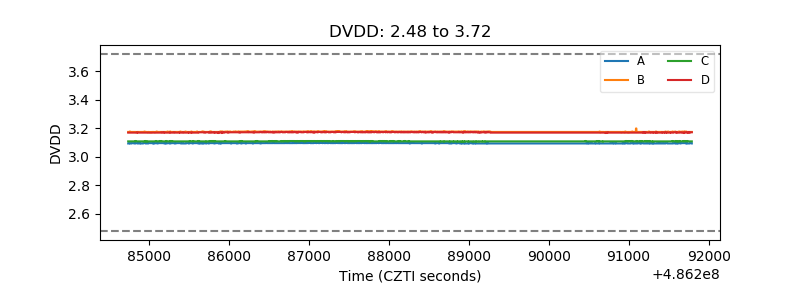 |
| Temperature 1 | 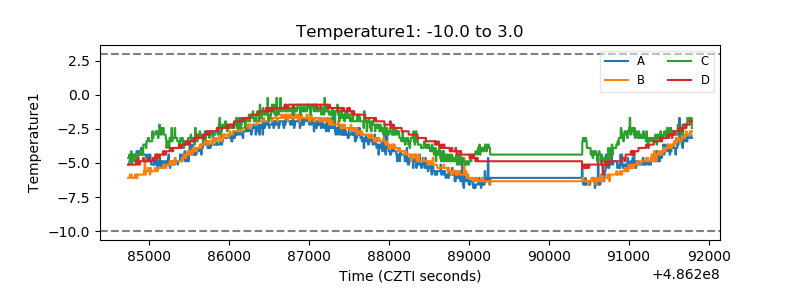 |
| Veto HV Monitor | 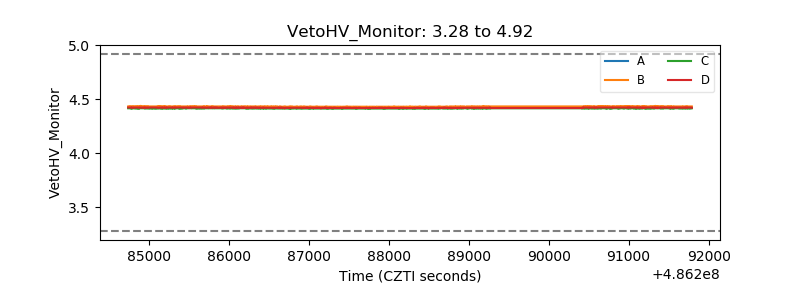 |
| Veto LLD | 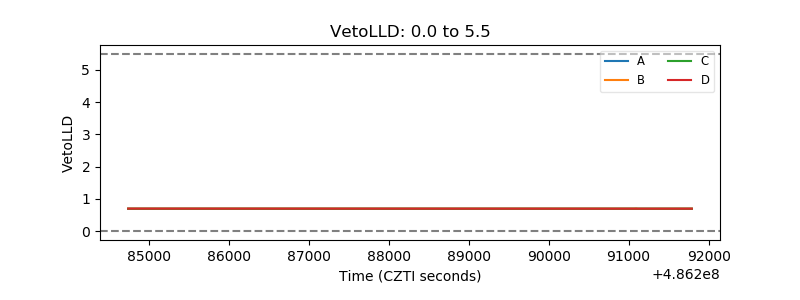 |
| Alpha Counter | 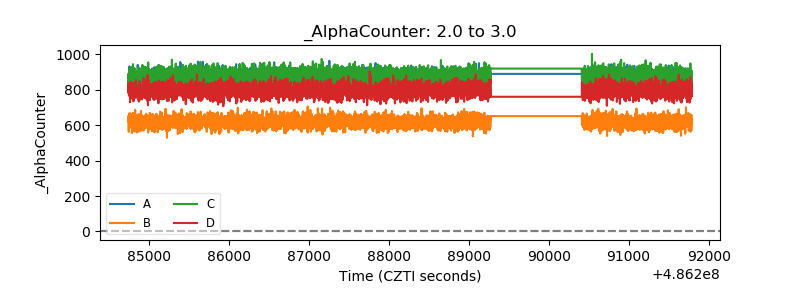 |
| _CPM_Rate | 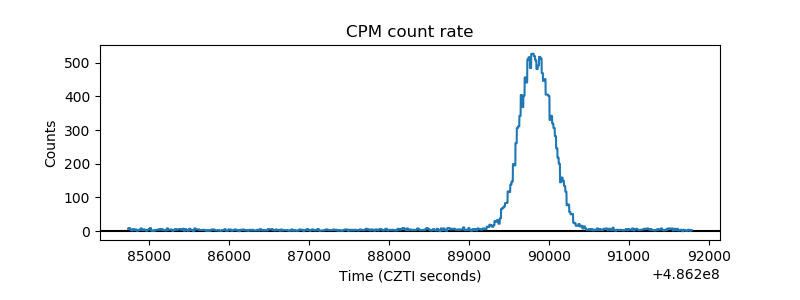 |
| CZT Counter | 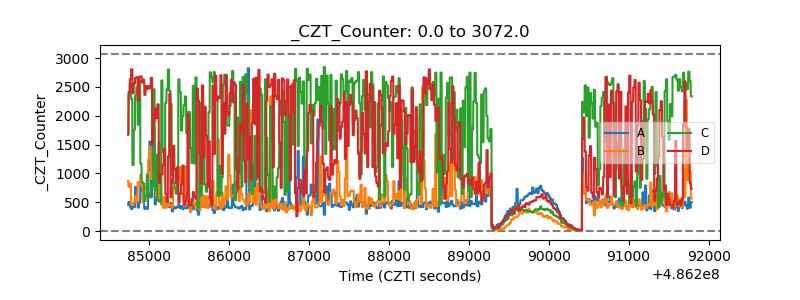 |
| +2.5 Volts monitor | 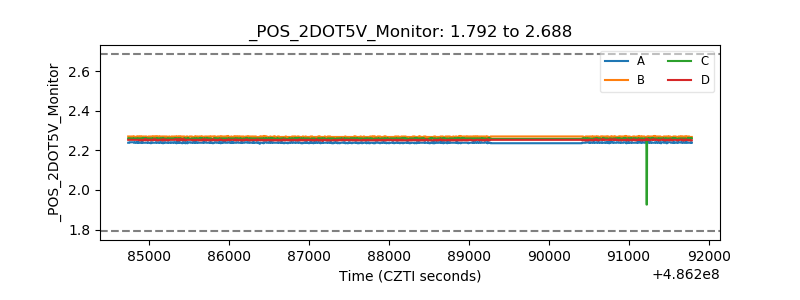 |
| +5 Volts monitor |  |
| _ROLL_ROT | 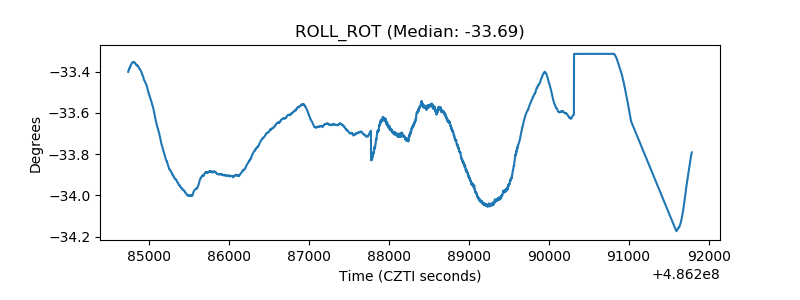 |
| _Roll_DEC | 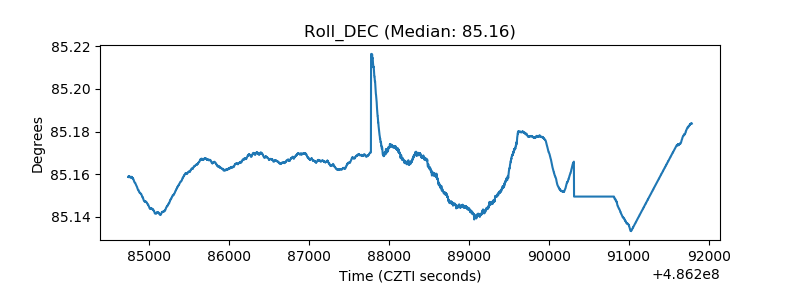 |
| _Roll_RA | 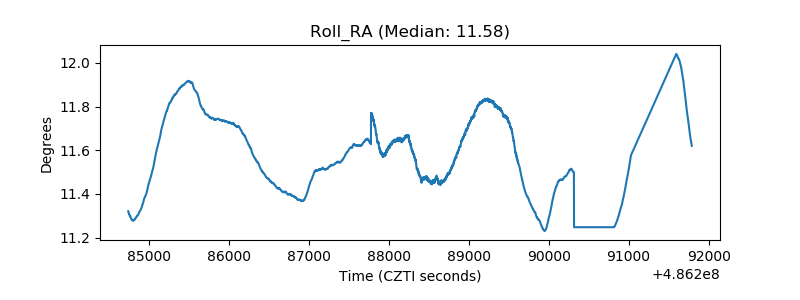 |
| Veto Counter | 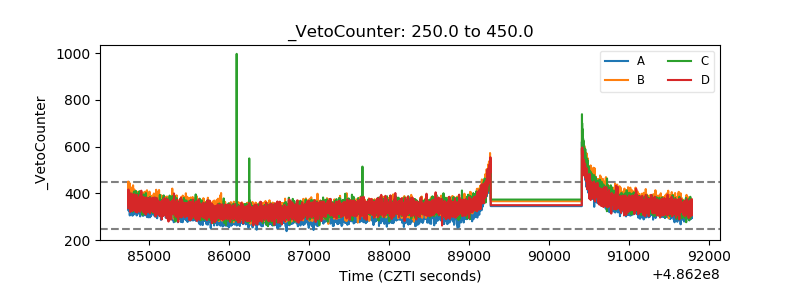 |