| Param | Original file | Final file |
|---|---|---|
| Filename | modeM0/AS1C09_011T05_9000006474_52309cztM0_level2.fits | modeM0/AS1C09_011T05_9000006474_52309cztM0_level2_quad_clean.evt |
| Size (bytes) | 394,211,520 | 38,260,800 |
| Size | 375.9 MB | 36.5 MB |
| Events in quadrant A | 1,722,665 | 299,068 |
| Events in quadrant B | 2,492,619 | 316,222 |
| Events in quadrant C | 5,882,387 | 99,939 |
| Events in quadrant D | 4,250,092 | 219,831 |
| Mode M0 | |||
|---|---|---|---|
| Quadrant | BADHDUFLAG | Total packets | Discarded packets |
| A | 0 | 7765 | 487 |
| B | 0 | 10316 | 702 |
| C | 0 | 20938 | 1311 |
| D | 0 | 15750 | 932 |
| Mode SS | |||
|---|---|---|---|
| Quadrant | BADHDUFLAG | Total packets | Discarded packets |
| A | 0 | 73 | 3 |
| B | 0 | 73 | 4 |
| C | 0 | 73 | 3 |
| D | 0 | 72 | 2 |
| Mode M9 | |||
|---|---|---|---|
| Quadrant | BADHDUFLAG | Total packets | Discarded packets |
| A | 0 | 9 | 0 |
| B | 0 | 9 | 0 |
| C | 0 | 9 | 0 |
| D | 0 | 9 | 0 |
| Quadrant | Total seconds | Saturated seconds | Saturation percentage |
|---|---|---|---|
| A | 3142 | 91 | 2.896244% |
| B | 3128 | 139 | 4.443734% |
| C | 3130 | 2182 | 69.712460% |
| D | 3130 | 727 | 23.226837% |
Noise dominated data is calculated using 1-second bins in cleaned event files. If a bin has >2000 counts, and if more than 50% of those come from <1% of pixels, then it is considered to be noise-dominated and hence unusable.
| Quadrant | # 1 sec bins | Bins with >0 counts | Bins with >2000 counts | High rate bins dominated by noise | Noise dominated (total time) | Noise dominated (detector-on time) | Marked lightcurve |
|---|---|---|---|---|---|---|---|
| A | 6278 | 3162 | 36 | 36 | 0.57% | 1.14% | 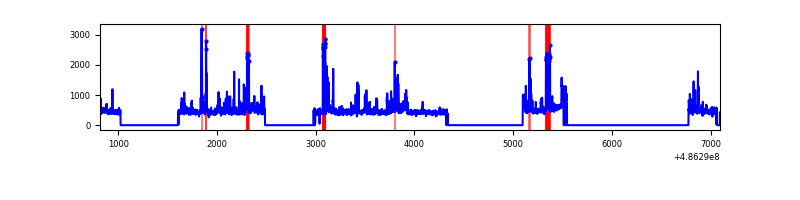 |
| B | 6250 | 3144 | 70 | 70 | 1.12% | 2.23% | 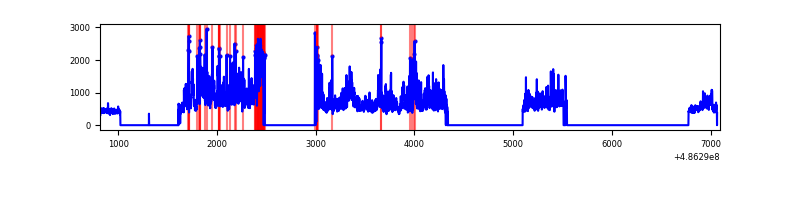 |
| C | 6248 | 3137 | 1654 | 1654 | 26.47% | 52.73% | 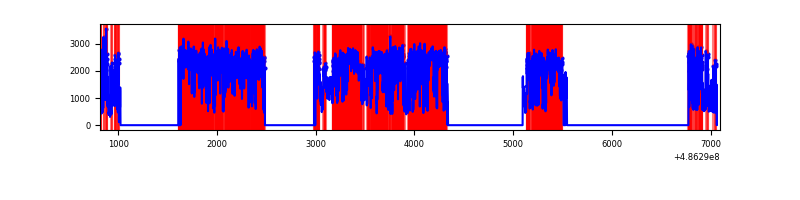 |
| D | 6255 | 3142 | 714 | 714 | 11.41% | 22.72% | 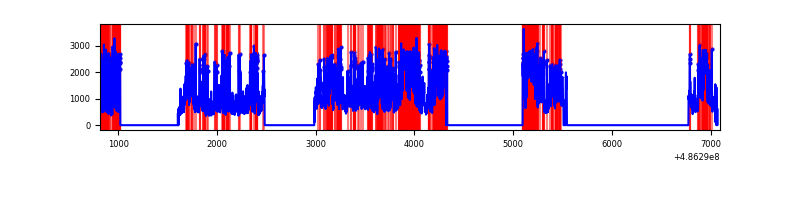 |
Top three noisy pixels from each quadrant. If the there are fewer than three noisy pixels in the level2.evt file, extra rows are filled as -1
| Pixel properties | Quadrant properties | ||||||
|---|---|---|---|---|---|---|---|
| Quadrant | DetID | PixID | Counts | Sigma | Mean | Median | Sigma |
| A | 5 | 240 | 107605 | 1304.88 | 326 | 318 | 82.2 |
| A | 11 | 3 | 89799 | 1088.32 | 326 | 318 | 82.2 |
| A | 12 | 3 | 79444 | 962.37 | 326 | 318 | 82.2 |
| B | 10 | 254 | 679113 | 9877.94 | 321 | 311 | 68.7 |
| B | 4 | 171 | 170372 | 2474.73 | 321 | 311 | 68.7 |
| B | 0 | 216 | 88507 | 1283.43 | 321 | 311 | 68.7 |
| C | 0 | 161 | 2542846 | 50824.65 | 178 | 176 | 50.0 |
| C | 15 | 224 | 1117326 | 22330.37 | 178 | 176 | 50.0 |
| C | 9 | 38 | 786717 | 15721.93 | 178 | 176 | 50.0 |
| D | 15 | 93 | 1324725 | 15743.8 | 290 | 276 | 84.1 |
| D | 12 | 2 | 509901 | 6057.94 | 290 | 276 | 84.1 |
| D | 13 | 84 | 368310 | 4374.84 | 290 | 276 | 84.1 |
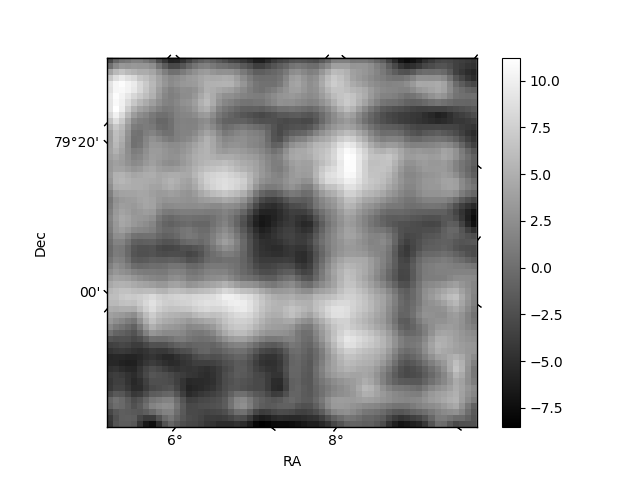
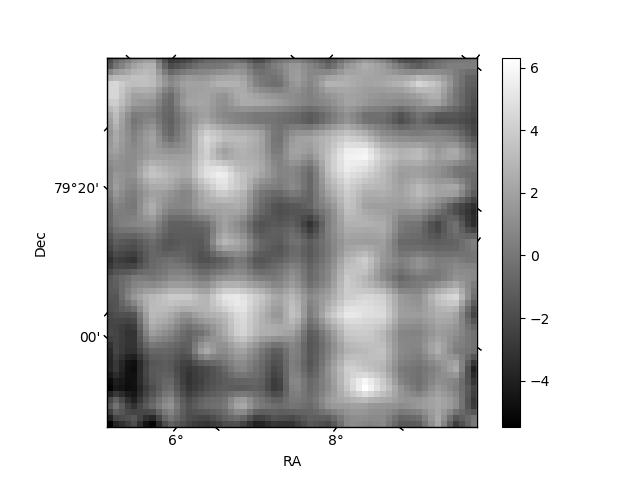
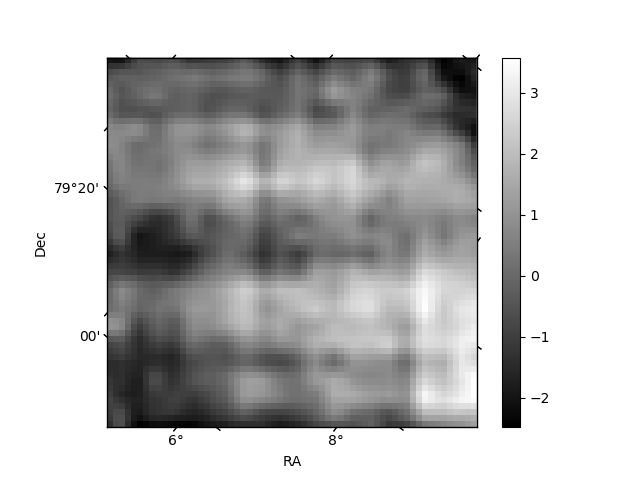
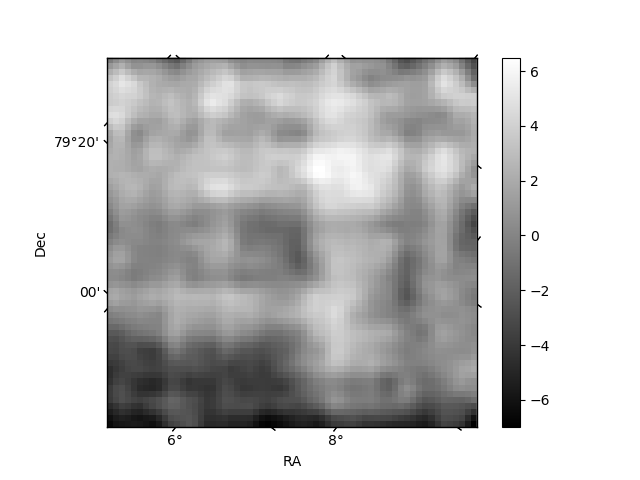
Histogram calculated using DETX and DETY for each event in the final _common_clean file
| Quadrant A | 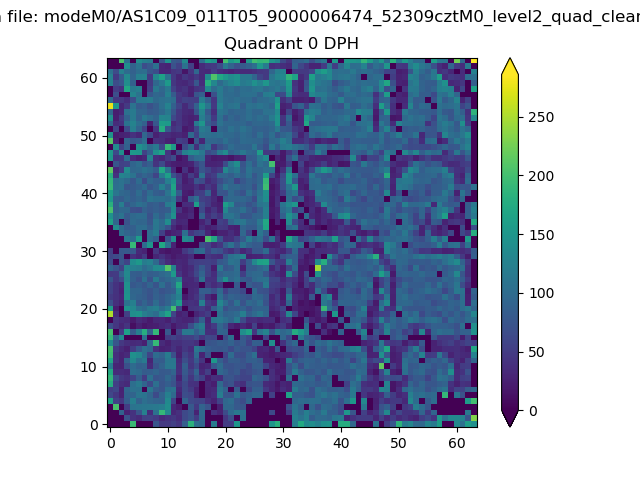 |
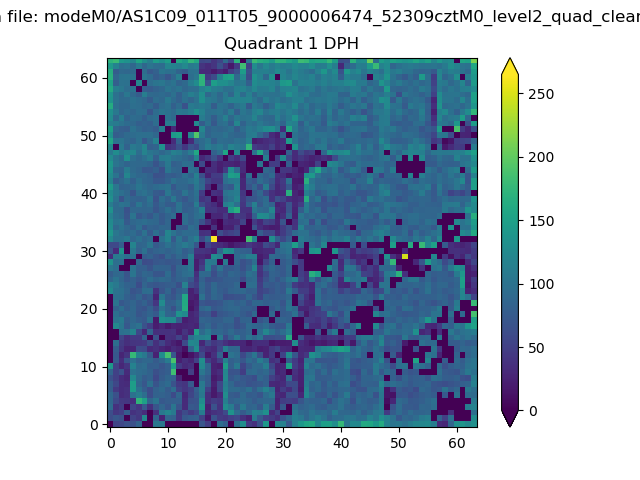 |
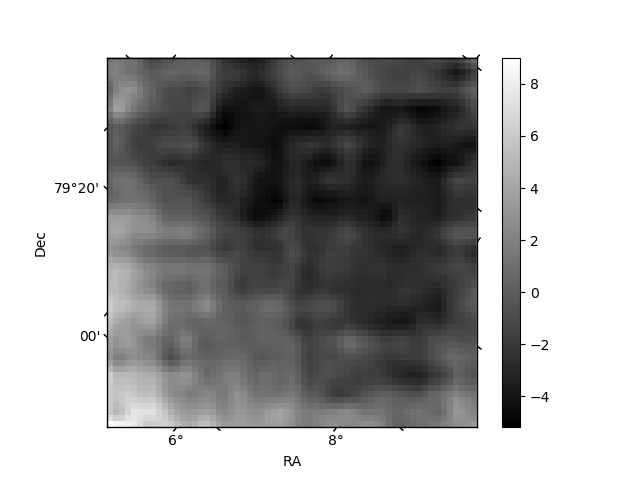
Quadrant B |
|---|---|---|---|
| Quadrant D | 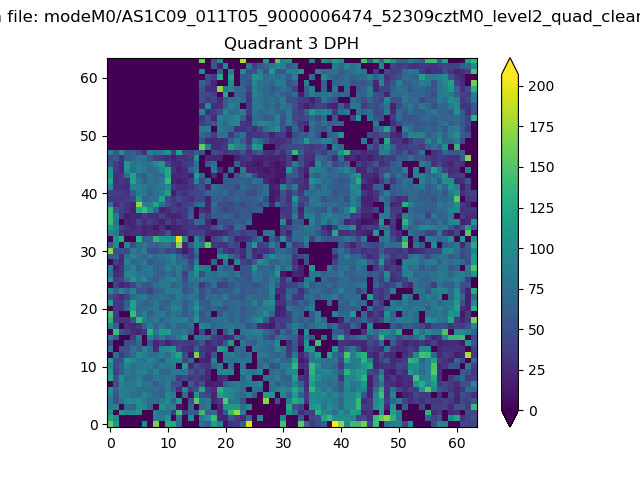 |
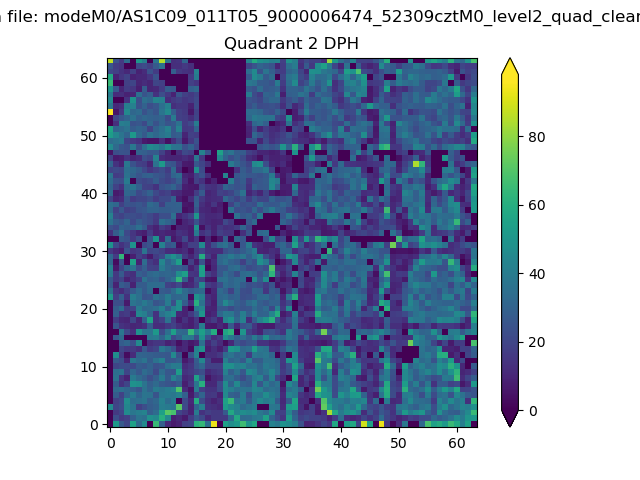 |
Quadrant C |
| Plot type | Count rate plots | Images |
|---|---|---|
| Comparison with Poisson distribution Blue bars denote a histogram of data divided into 1 sec bins. Red curve is a Poisson curve with rate = median count rate of data. |
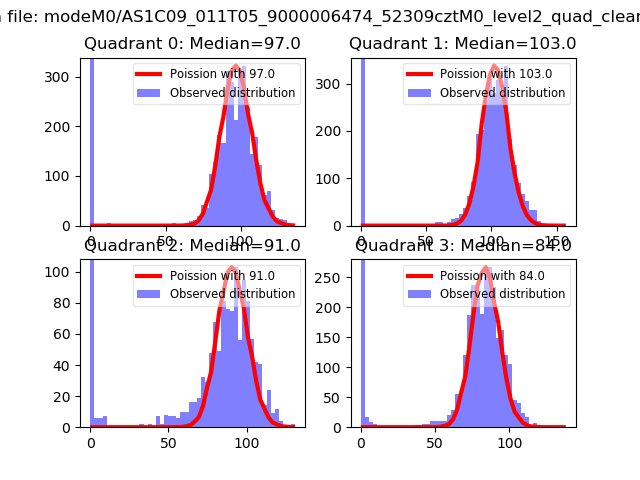 |
 |
| Quadrant-wise count rates Data is divided into 100 sec bins |
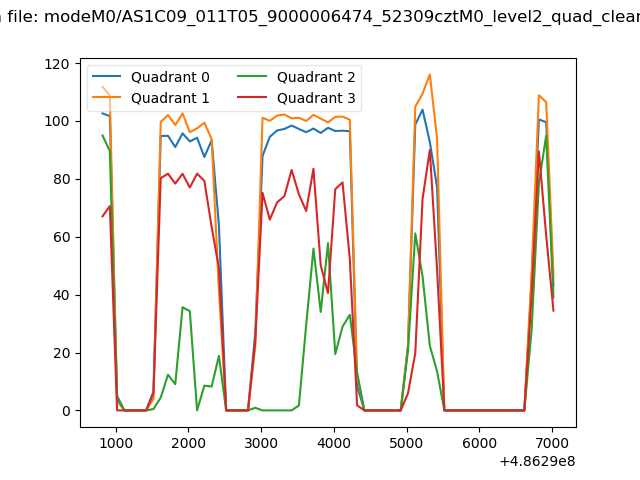 |
|
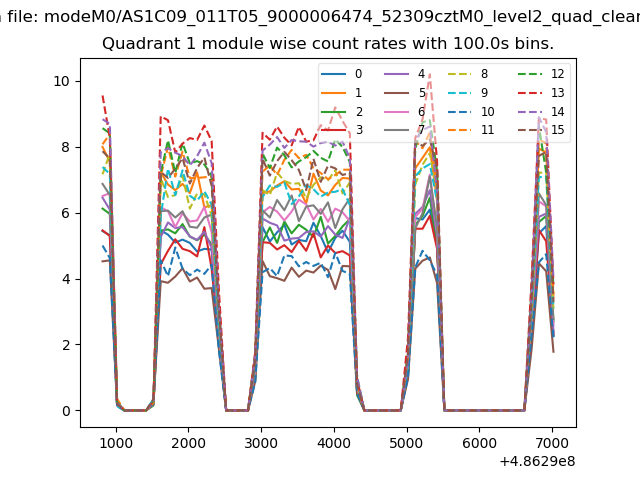
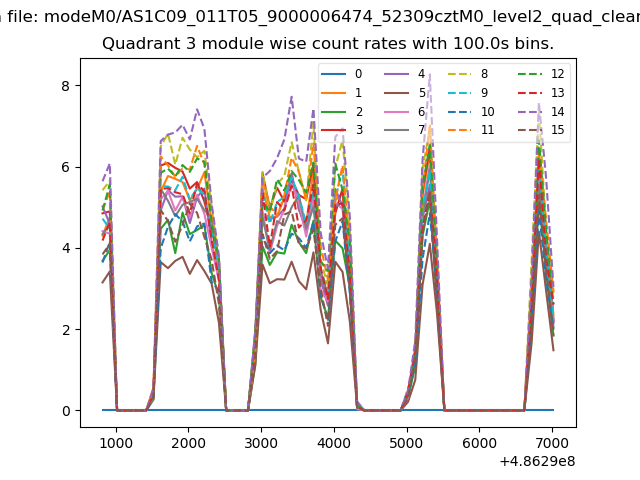
| Module-wise count rates for Quadrant A Data is divided into 100 sec bins |
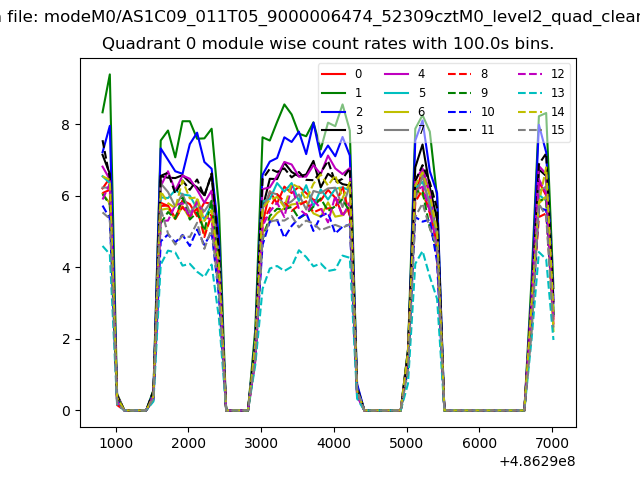 |
 |
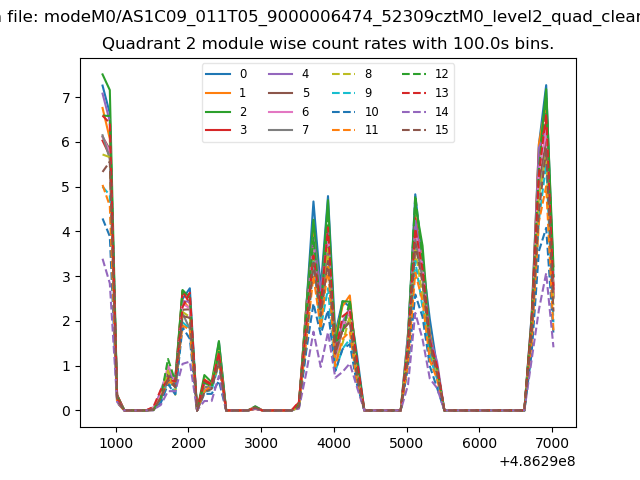
| Module-wise count rates for Quadrant B Data is divided into 100 sec bins |
 |
 |
| Module-wise count rates for Quadrant C Data is divided into 100 sec bins |
 |
 |
| Module-wise count rates for Quadrant D Data is divided into 100 sec bins |
 |
 |
| Parameter | Plot |
|---|---|
| CZT HV Monitor | 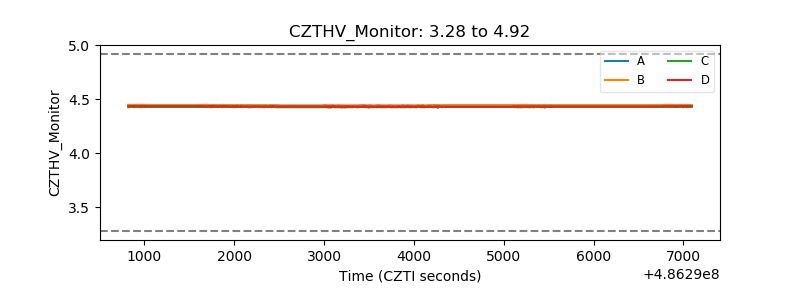 |
| D_VDD | 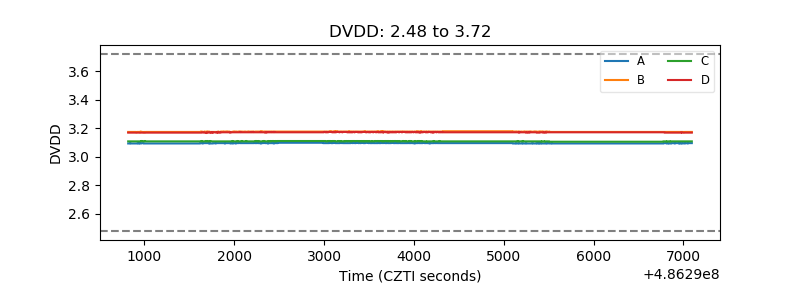 |
| Temperature 1 | 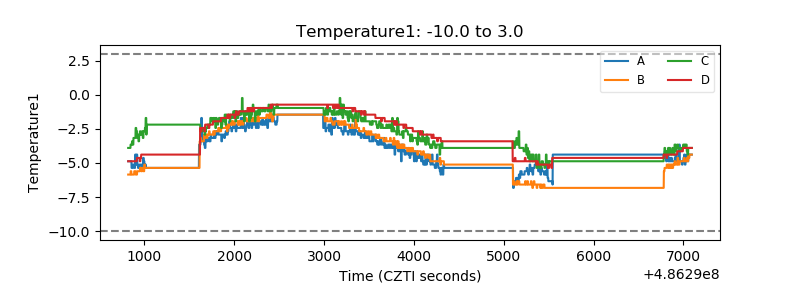 |
| Veto HV Monitor | 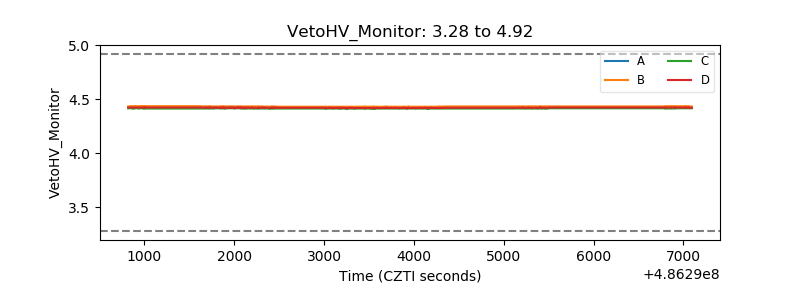 |
| Veto LLD | 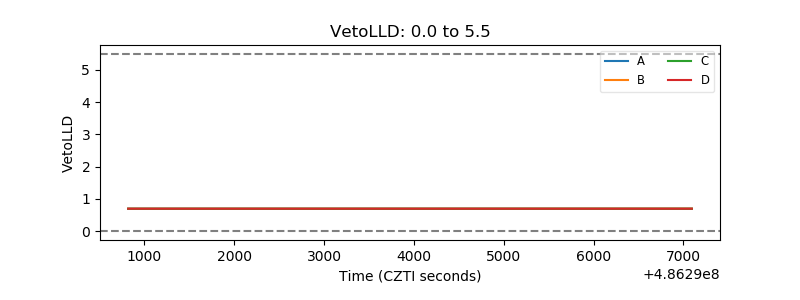 |
| Alpha Counter | 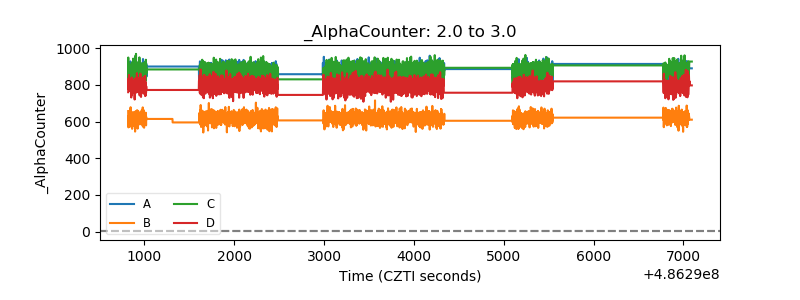 |
| _CPM_Rate | 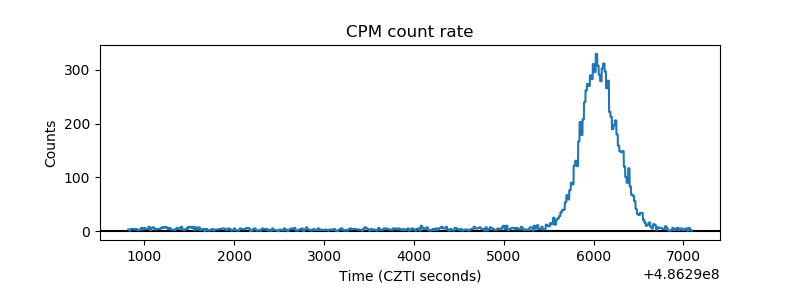 |
| CZT Counter | 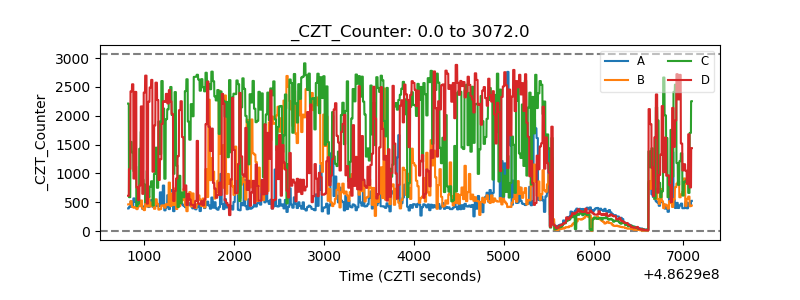 |
| +2.5 Volts monitor | 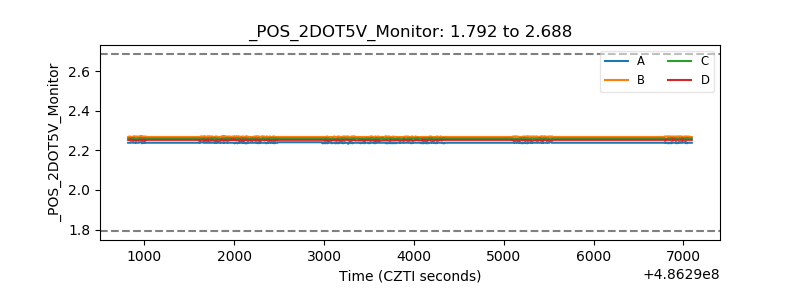 |
| +5 Volts monitor |  |
| _ROLL_ROT | 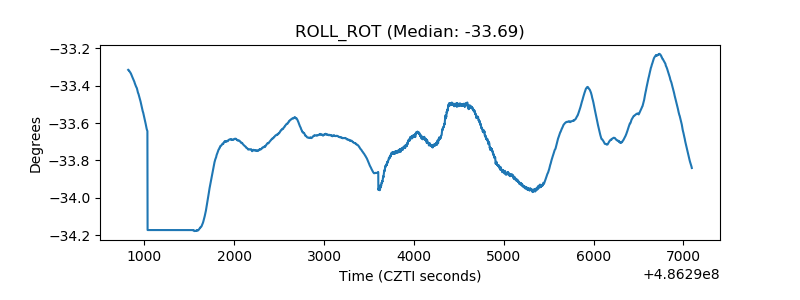 |
| _Roll_DEC | 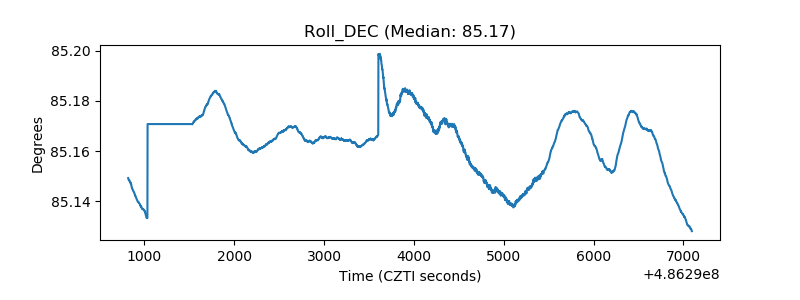 |
| _Roll_RA | 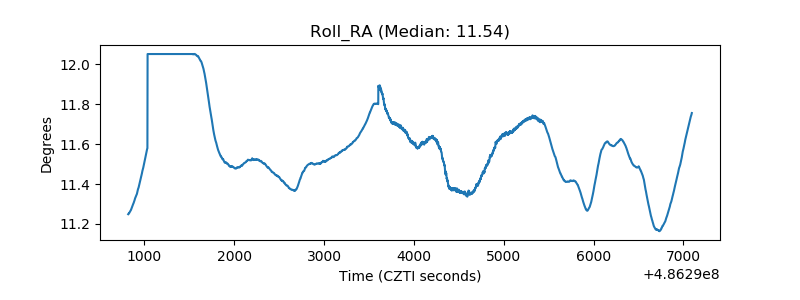 |
| Veto Counter | 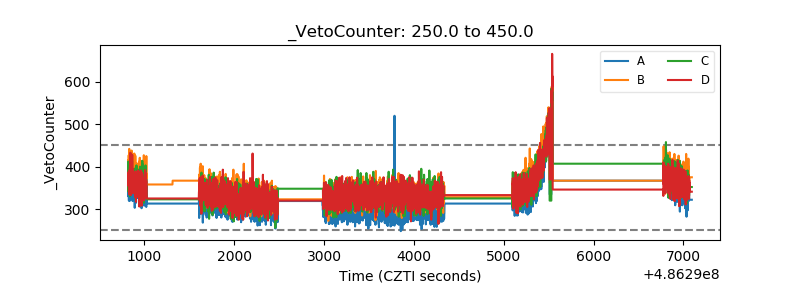 |