| Param | Original file | Final file |
|---|---|---|
| Filename | modeM0/AS1C09_011T05_9000006474_52310cztM0_level2.fits | modeM0/AS1C09_011T05_9000006474_52310cztM0_level2_quad_clean.evt |
| Size (bytes) | 1,492,836,480 | 123,914,880 |
| Size | 1.4 GB | 118.2 MB |
| Events in quadrant A | 6,366,597 | 1,001,570 |
| Events in quadrant B | 9,793,318 | 1,004,242 |
| Events in quadrant C | 19,510,912 | 458,243 |
| Events in quadrant D | 18,754,445 | 537,825 |
| Mode M0 | |||
|---|---|---|---|
| Quadrant | BADHDUFLAG | Total packets | Discarded packets |
| A | 0 | 26414 | 2 |
| B | 0 | 36586 | 2 |
| C | 0 | 65426 | 2 |
| D | 0 | 63240 | 10 |
| Mode SS | |||
|---|---|---|---|
| Quadrant | BADHDUFLAG | Total packets | Discarded packets |
| A | 0 | 220 | 0 |
| B | 0 | 220 | 0 |
| C | 0 | 220 | 0 |
| D | 0 | 220 | 0 |
| Mode M9 | |||
|---|---|---|---|
| Quadrant | BADHDUFLAG | Total packets | Discarded packets |
| A | 0 | 21 | 0 |
| B | 0 | 21 | 0 |
| C | 0 | 21 | 0 |
| D | 0 | 21 | 0 |
| Quadrant | Total seconds | Saturated seconds | Saturation percentage |
|---|---|---|---|
| A | 10827 | 404 | 3.731412% |
| B | 10828 | 1057 | 9.761729% |
| C | 10827 | 6383 | 58.954466% |
| D | 10826 | 4936 | 45.593941% |
Noise dominated data is calculated using 1-second bins in cleaned event files. If a bin has >2000 counts, and if more than 50% of those come from <1% of pixels, then it is considered to be noise-dominated and hence unusable.
| Quadrant | # 1 sec bins | Bins with >0 counts | Bins with >2000 counts | High rate bins dominated by noise | Noise dominated (total time) | Noise dominated (detector-on time) | Marked lightcurve |
|---|---|---|---|---|---|---|---|
| A | 12847 | 10827 | 253 | 253 | 1.97% | 2.34% | 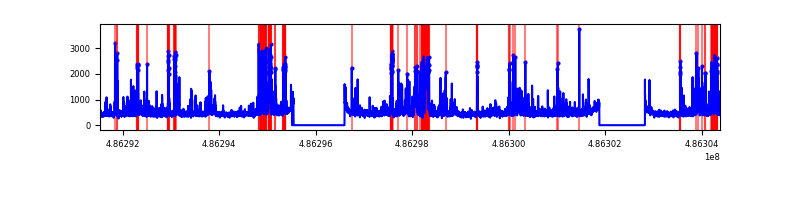 |
| B | 12848 | 10828 | 778 | 778 | 6.06% | 7.19% | 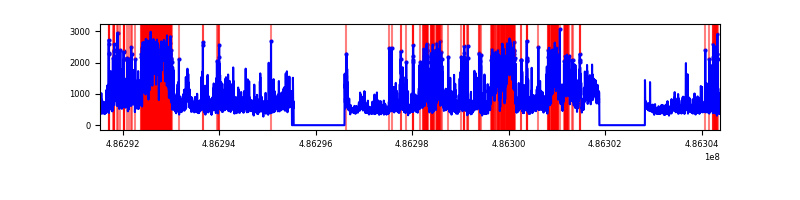 |
| C | 12846 | 10827 | 5396 | 5396 | 42.01% | 49.84% | 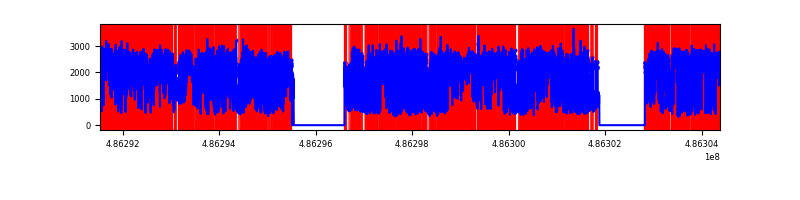 |
| D | 12846 | 10826 | 4782 | 4782 | 37.23% | 44.17% | 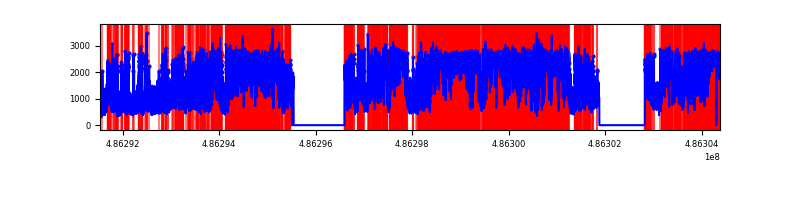 |
Top three noisy pixels from each quadrant. If the there are fewer than three noisy pixels in the level2.evt file, extra rows are filled as -1
| Pixel properties | Quadrant properties | ||||||
|---|---|---|---|---|---|---|---|
| Quadrant | DetID | PixID | Counts | Sigma | Mean | Median | Sigma |
| A | 12 | 3 | 348651 | 1234.51 | 1122 | 1093 | 281.5 |
| A | 3 | 48 | 266420 | 942.43 | 1122 | 1093 | 281.5 |
| A | 11 | 3 | 230813 | 815.96 | 1122 | 1093 | 281.5 |
| B | 10 | 254 | 2727277 | 11892.54 | 1092 | 1054 | 229.2 |
| B | 4 | 171 | 1061277 | 4624.99 | 1092 | 1054 | 229.2 |
| B | 0 | 216 | 443009 | 1927.93 | 1092 | 1054 | 229.2 |
| C | 0 | 161 | 6577630 | 32937.72 | 727 | 718 | 199.7 |
| C | 15 | 224 | 3994686 | 20002.12 | 727 | 718 | 199.7 |
| C | 9 | 38 | 2271119 | 11370.35 | 727 | 718 | 199.7 |
| D | 15 | 93 | 8232351 | 32989.37 | 855 | 814 | 249.5 |
| D | 12 | 2 | 3411801 | 13670.15 | 855 | 814 | 249.5 |
| D | 13 | 84 | 793366 | 3176.3 | 855 | 814 | 249.5 |
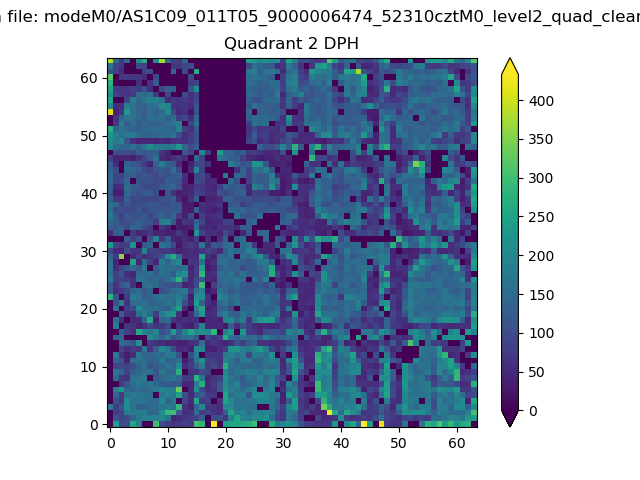
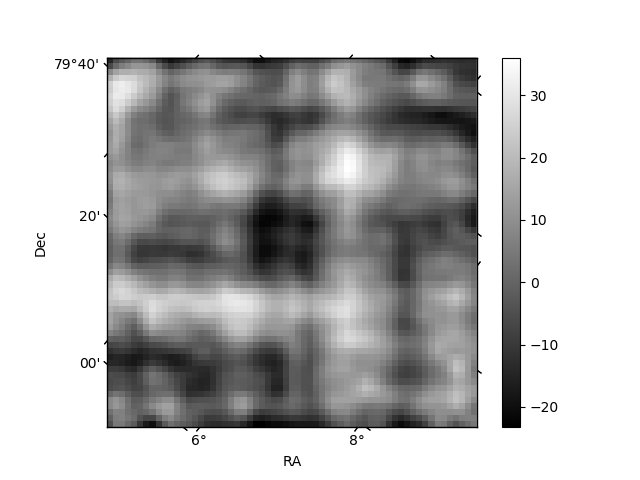
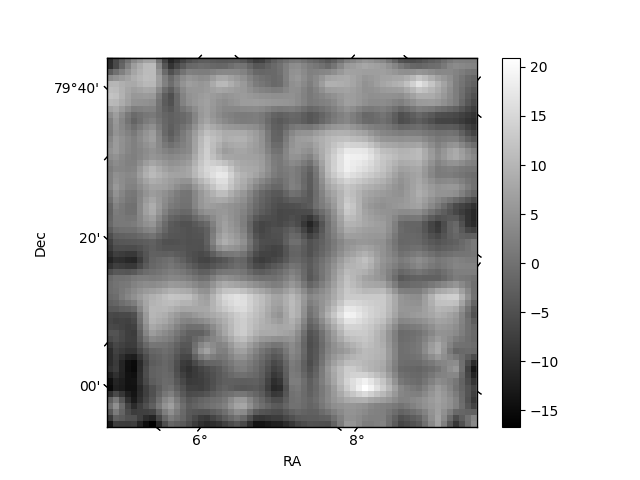
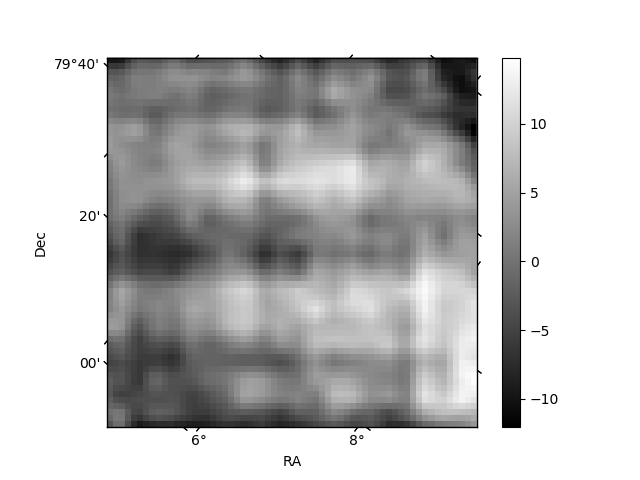
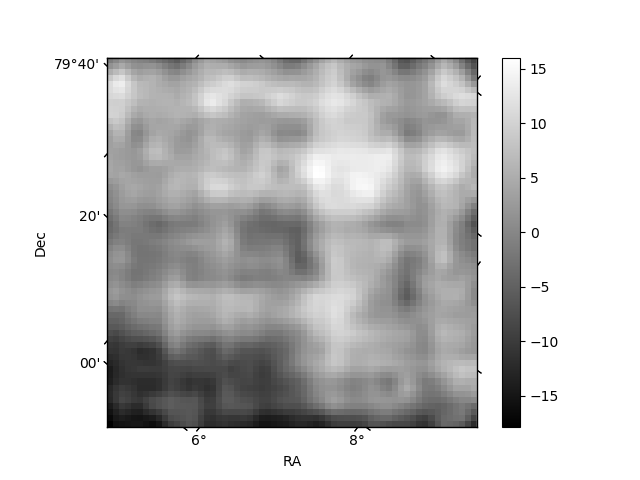
Histogram calculated using DETX and DETY for each event in the final _common_clean file
| Quadrant A | 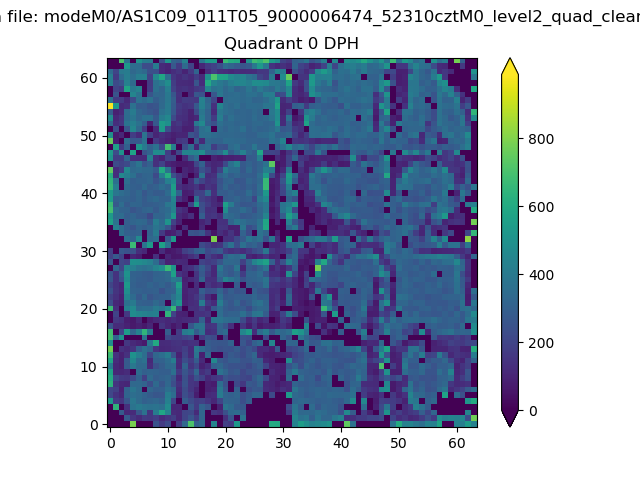 |
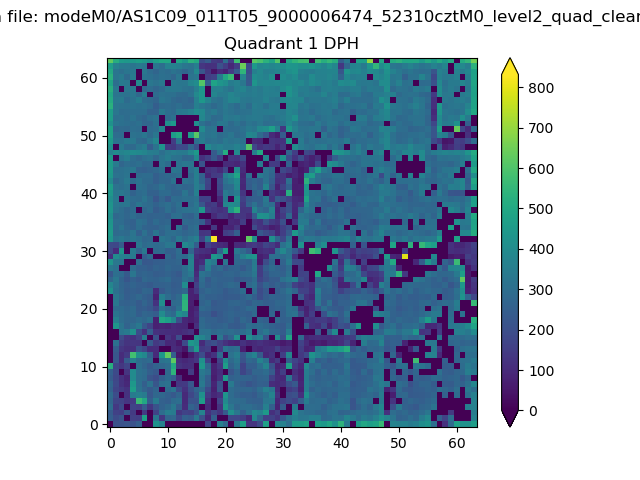 |
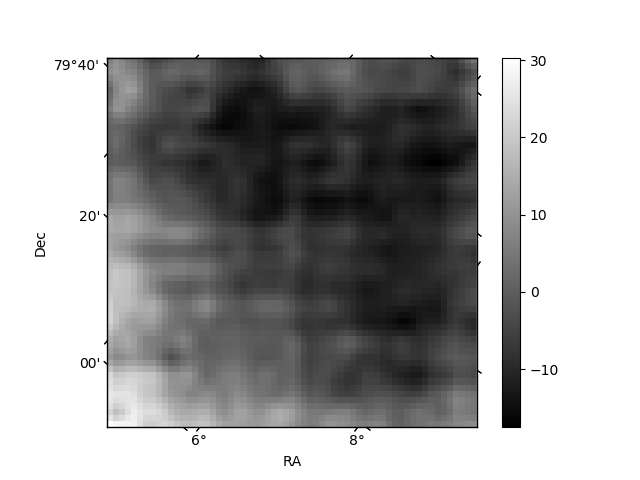
Quadrant B |
|---|---|---|---|
| Quadrant D | 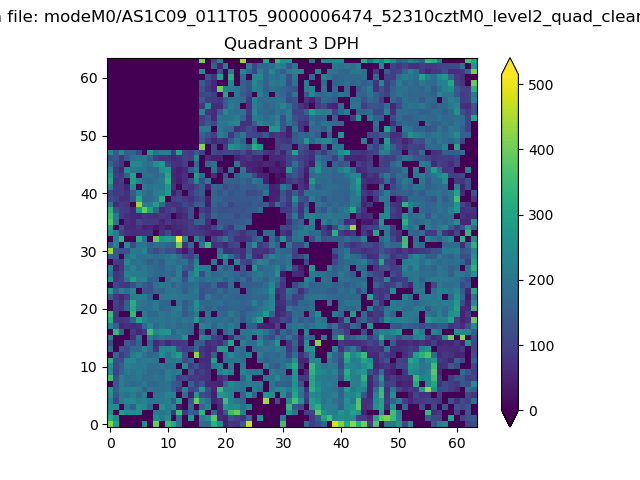 |
 |
Quadrant C |
| Plot type | Count rate plots | Images |
|---|---|---|
| Comparison with Poisson distribution Blue bars denote a histogram of data divided into 1 sec bins. Red curve is a Poisson curve with rate = median count rate of data. |
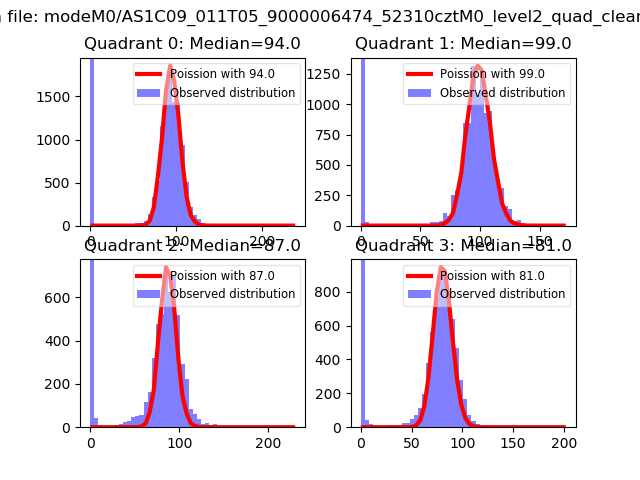 |
 |
| Quadrant-wise count rates Data is divided into 100 sec bins |
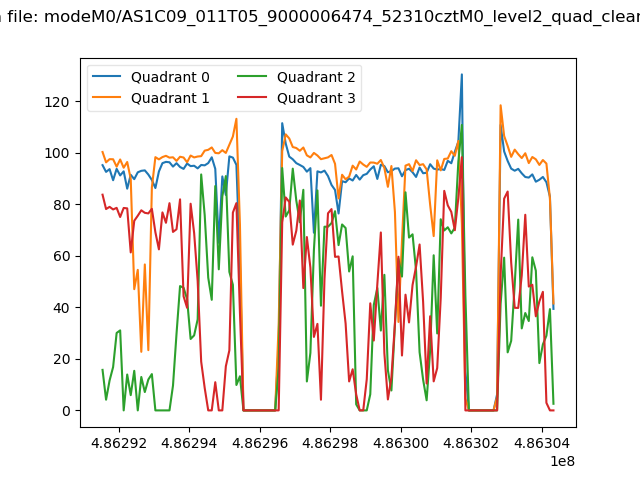 |
|
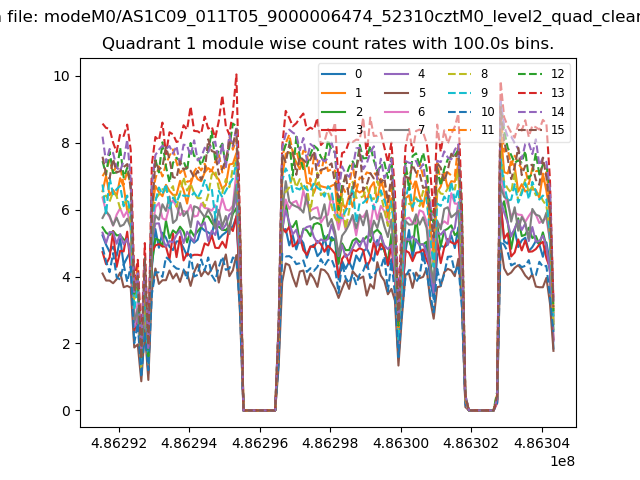
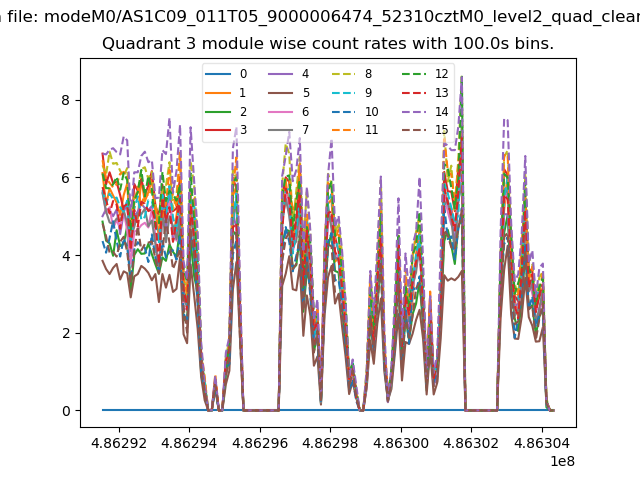
| Module-wise count rates for Quadrant A Data is divided into 100 sec bins |
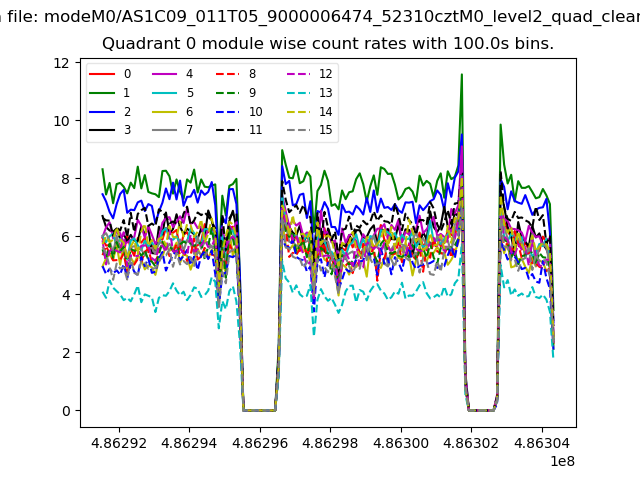 |
 |
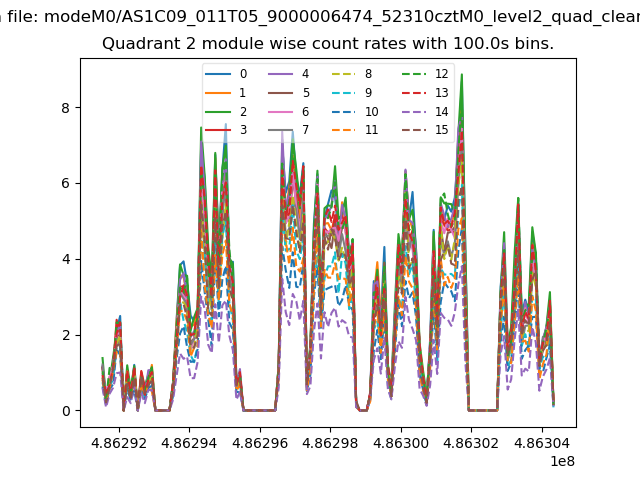
| Module-wise count rates for Quadrant B Data is divided into 100 sec bins |
 |
 |
| Module-wise count rates for Quadrant C Data is divided into 100 sec bins |
 |
 |
| Module-wise count rates for Quadrant D Data is divided into 100 sec bins |
 |
 |
| Parameter | Plot |
|---|---|
| CZT HV Monitor | 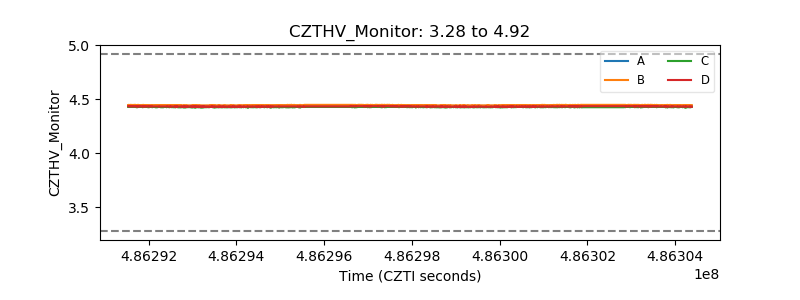 |
| D_VDD | 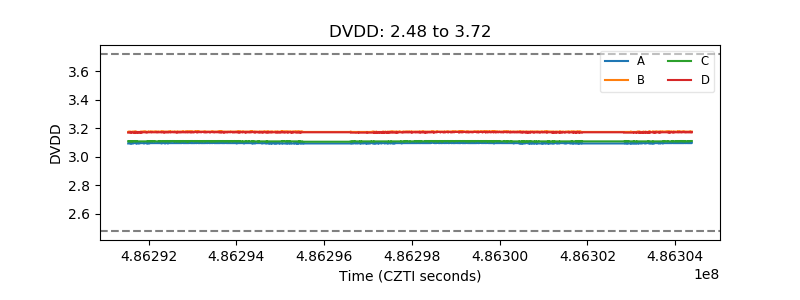 |
| Temperature 1 | 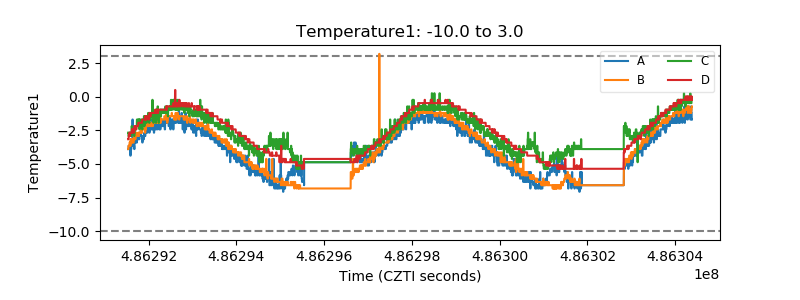 |
| Veto HV Monitor | 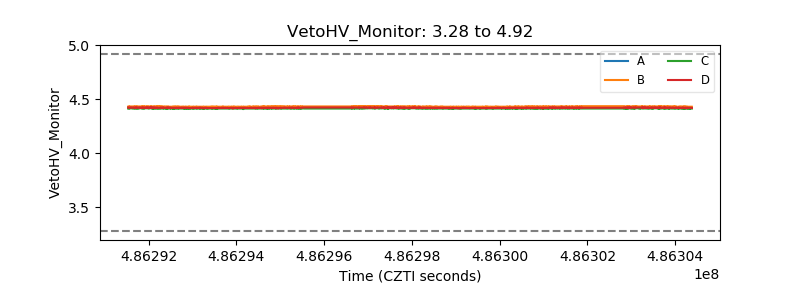 |
| Veto LLD | 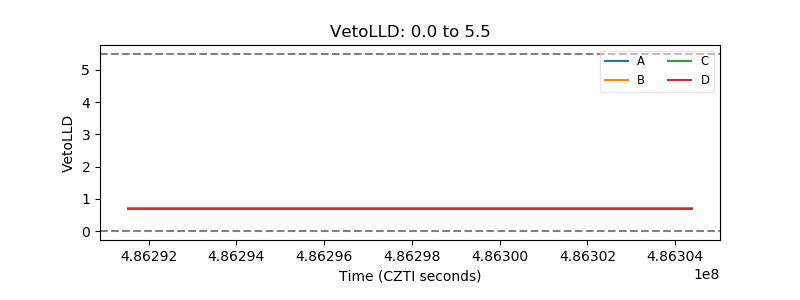 |
| Alpha Counter | 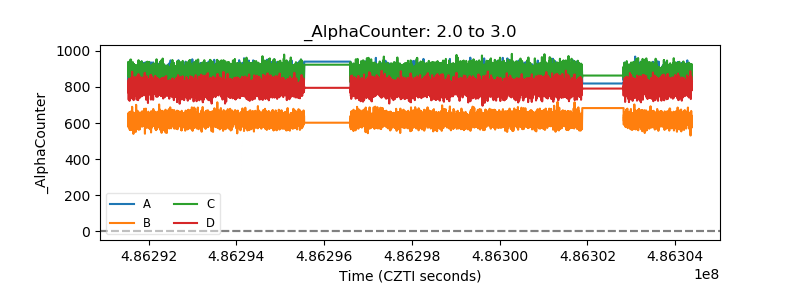 |
| _CPM_Rate | 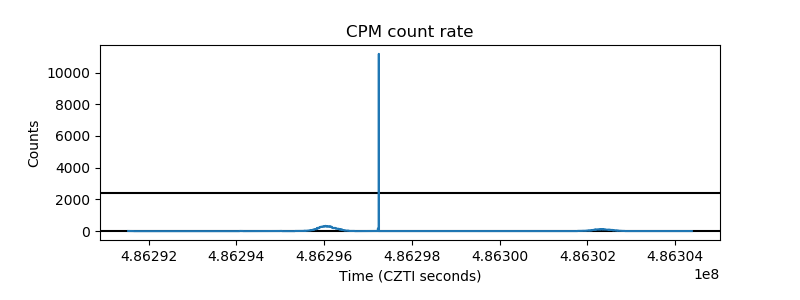 |
| CZT Counter | 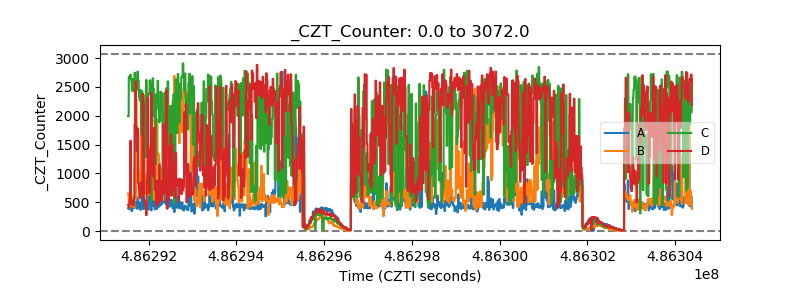 |
| +2.5 Volts monitor |  |
| +5 Volts monitor |  |
| _ROLL_ROT | 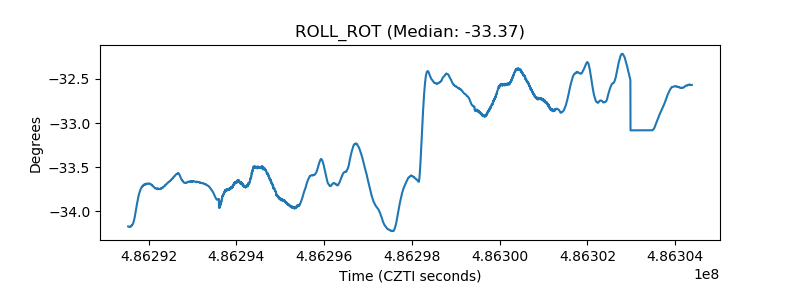 |
| _Roll_DEC | 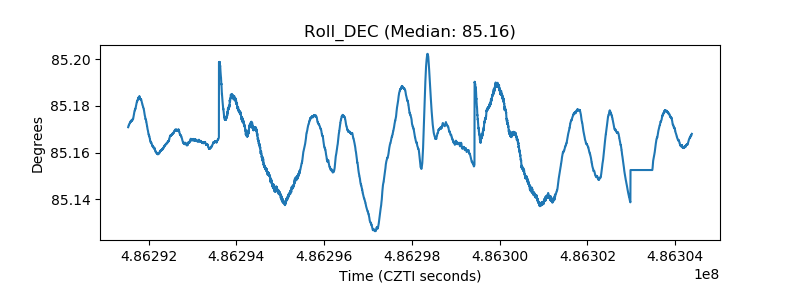 |
| _Roll_RA | 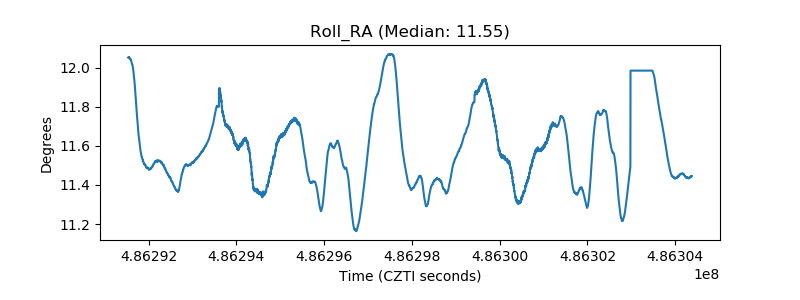 |
| Veto Counter | 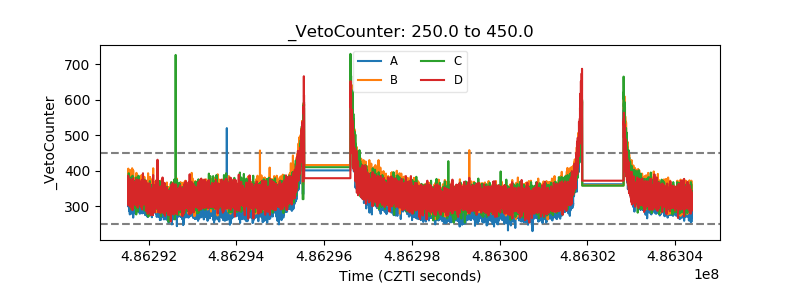 |